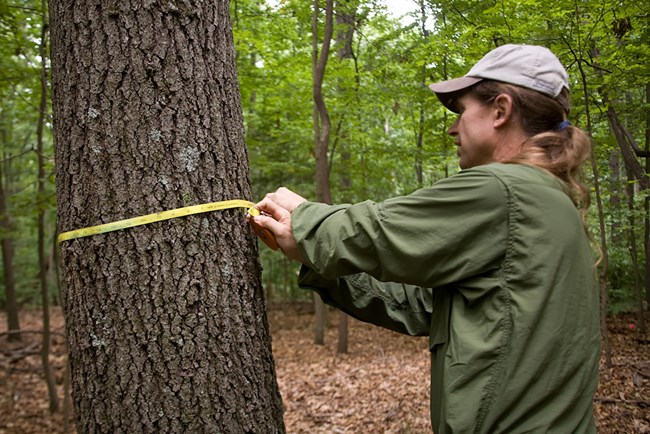
The National Capital Region Inventory & Monitoring Network monitors air quality, amphibians, birds, forest pests, vegetation, invasive plants, stream water, and stream fish and macroinvertebrates at Prince William Forest Park. The results of that monitoring provide park managers with scientific information for decision-making.
Prince William Forest Park sits at the transition from the rolling Piedmont Plateau to the low-lying Atlantic Coastal Plain and protects the largest piedmont forest ecosystem in the national park system. It is home to unique geological features like waterfalls and rock outcroppings, and several rare plant communities.
The park’s main natural resource management concerns are invasive plants and diseases, overpopulation of deer, and encroaching urban development. Regional air quality and land use patterns can have strong effects on park resources.
What’s Happening in Prince William Forest Park
NCRN Monitoring at Prince William by the Numbers
| What We Monitor | Sites at Prince William* | Monitoring Frequency | Information We Collect |
|---|---|---|---|
| Amphibians | 120 known wetland pools 72 known stream transects |
Annual sampling on a subset of known wetlands Wetland sites are monitored twice per sampling period |
|
| Birds – forest only | 132 (forest bird) | Forest plots are monitored twice a year |
|
| Forest vegetation | 145 (forest vegetation) | Approximately a quarter of plots each year on a four-year cycle |
|
| Stream biota – fish and macroinvertebrates | At streams listed below | Periodic sampling 2007-2014, 2019-2023 |
|
| Stream water quality | 9 (stream sites) on Boneyard Run, Carters Run, Mary Bird Branch, Mawavi Run, North Fork Quantico Creek, Orenda Run, South Fork Quantico Creek, Sow Run, and Taylor Run | Stream sites are monitored every other month |
|
Last updated: August 23, 2023
