Updated: December 2012 Water Quality Conditions within the Wetlands Prior to Restoration Of course, not all the pollutants came from upstream. The dairy also represented a sizeable source of potential pollutants to Tomales Bay. During full-scale agricultural operation, the East Pasture was intensively managed through construction and frequent dredging of ditches, manuring of pastures, and grazing of several active dairy herds. The West Pasture, which was located across Lagunitas Creek from the dairy facility, was less intensively managed and grazed. Practices such as frequent dredging of ditches led to some of the pasture ditch waters, particularly in the East Pasture, being very low in oxygen--low enough to impact and perhaps even kill aquatic organisms (Parsons 2009). 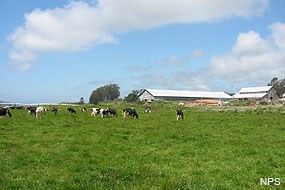
Not surprisingly, concentrations of nutrients and pathogens were typically highest in the dairy relative to levels in Lagunitas Creek, other creeks flowing into the Giacomini Ranch, or natural tidal marshes in Tomales Bay (Parsons 2009). One of the predominant nutrients in Tomales Bay is nitrates. The relatively well oxygenated conditions present in most of the Study Areas--except the East Pasture ditches--may have contributed to the dominance of nitrates as the primary source of nutrients (Parsons 2009). For pollutants such as nitrates, pulses appeared to substantially drive nutrient dynamics more than consistent loading, as median concentrations (central values) of nitrates within the dairy (0.83 mg/L) were not much different from those in natural marshes (0.7 mg/L; ibid). However, mean nitrate concentrations, which reflect the influence of "spikes" or "pulses," showed greater disparity, with concentrations averaging 7.25 mg/L (NO3-) for the East Pasture and dropping below 1.1 mg/L for other areas (Parsons 2009). Another form of nitrogen, ammonia, typically present in more low-oxygen environments, was only infrequently detected during pre-restoration sampling, but of the 64 detections of ammonia during the study, more than 47% of them occurred in the East Pasture (Parsons 2009). In general, pathogens represent one of the major water quality issues facing Tomales Bay. While seemingly pristine, the Bay and its surrounding watershed generate a considerable volume of pathogen indicator bacteria, total and fecal coliform, because of the large amount of land in agricultural use, leaking septic systems in the many rural residential communities perched on the Bay's edge, and other factors such as bilge discharge from boats. With Giacomini Ranch supporting a considerable number of dairy cattle during its operation, pathogen concentrations were definitely elevated relative to natural waters. Prior to restoration, the Project Area had substantially higher estimated median concentrations of fecal coliforms (1,600.9 mpn/100 ml) than natural marshes (72.0 mpn/100 ml), although, based on results of statistical analyses, seeming differences with upstream areas or source creeks (705.6 mpn/100 ml) might have been obscured by high variability in the data (Parsons 2009). Not surprisingly, the heavily managed East Pasture had significantly higher estimated levels (6,298.8 mpn/100 ml) than most of the other areas sampled, with the possible exception, from a statistical standpoint, of Olema Marsh (1,821.4 mpn/100 ml; ibid). Estimated geometric means or medians for all other areas ranged between 356.9 mpn/100 ml for downstream Lagunitas Creek to 1,131.7 mpn/100 ml for the West Pasture (ibid). 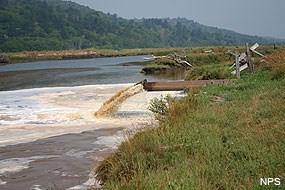
While concentrations of nutrients and pathogens were highest in the dairy, loading or the volume of pollutant was actually highest in the creeks or upstream areas flowing into the restoration project area and, eventually, into Tomales Bay (Parsons 2009). These results are not surprising. The East Pasture was entirely leveed and only had flow into Lagunitas Creek during periods when the pump was actively operated or when floodwaters overtopped the levees and flowed through the pasture to drain out via the spillways at the ranch's northern end. The West Pasture functioned as a muted tidal system in that a somewhat leaky one-way tidegate on Fish Hatchery Creek's downstream regulated inflow and outflow into the pasture. There were some exceptions. For example, for fecal coliform, estimated loading rates for the restoration project area (mean=249,389 mpn/s) were lower than upstream area or source creeks (mean=3.86 million mpn/s), but higher than natural marshes (mean=60,094.1 mpn/s; ibid). Conversely, natural marshes had the highest loading rates for phosphates (0.15 mg/s), with rates for the restoration project area (0.03 mg/s) and upstream areas or source creeks (0.06 mg/s) much lower, which may relate to the more substantial marine influence on natural marshes (ibid). As with many other parameters, loading rates or pollutant volumes were typically driven by pulses or spikes, particularly during storm events. The importance of storm events to downstream loading is evident in the disparity between mean (10.11 mg/s) and median (0.66 mg/s) instantaneous loading rates for nitrates on Lagunitas Creek: During an April 2006 storm, rates reached as high as an estimated 220 mg/s (Parsons 2009). Research on other agricultural watersheds has also documented the highest export of nutrients and pathogens in stormflow, with levels generally higher in the wet season than the dry season (Vanni et al. 2001, Lewis and Atwill 2007). Ironically, storms have been the least sampled due to inherent planning and logistical difficulties, however, we are increasing efforts to capture storm events in the monitoring record. Water Quality Conditions After Restoration Restoration of the Giacomini Wetlands has actually occurred in several distinct phases. While the Giacomini family had a Reservation of Use Agreement that allowed them to operate through fall 2007, the family elected to sell off their main dairy herds in 2006 and instead a graze a smaller number of dairy heifers or young cows. From this point in 2006 through construction in fall 2008, the restoration process began to occur, but in a more passive manner. Most of the active agricultural management--including ditching and manure-spreading--was discontinued in 2006 with limited irrigation and grazing continued until fall 2007. Phase I of construction in fall 2007 involved removal of most of the agricultural infrastructure--barns, pipelines, fencing, and surface scraping of the manure slurry disposal pasture--as well as removal of the southernmost levee in the East Pasture. However, full restoration, which hydrologically reconnected the former historic marsh to Lagunitas and Tomasini Creeks, was not realized until October 2008, when the levees on both the East and West Pastures were fully removed. Analyses performed as part of environmental compliance predicted that water quality conditions within the restored wetlands immediately after restoration would remain similar or even worsen before showing improvement over the long-term (NPS 2007). While removal of cows, manure, and agricultural practices such as ditching would be expected to improve water quality, improvement was not expected to happen overnight due to high levels of nutrients and pathogens in present. In addition, conversion of the pasture back to marshland would cause a massive die-off in mostly non-native pasture grasses and herbs that would, upon breakdown by bacteria, release large amounts of organic and inorganic nutrients into overlying waters. Changes in water salinity and hydrologic regime would also affect soils, most of which have high nutrient--and possibly pathogen--levels from decades of agricultural management. Nutrients would be expected to flux or move out of the soils into overlying waters, as well, in response to changes in soil chemistry. With accelerated breakdown of organic matter both above and below-ground would come higher demands on oxygen in water and soils, leading to possible episodes of oxygen depletion in overlying waters. Breakdown of organic matter could also lead to decreases in pH from release of humic acids. The die-off of vegetation and resulting increase in bare ground would also be expected to exacerbate turbidity issues resulting from disturbance of soils during construction for creation of new tidal channels and excavation of certain areas to lower intertidal elevations. Interestingly, during the first water year after restoration (October 2008 through September 2009), most of the anticipated short-term negative impacts to water quality within the restored wetlands were not observed (Parsons 2010). Rather, there was a general improvement in overall water quality conditions that occurred at a much more rapid pace than initially anticipated (ibid). Remarkably, despite the fact that movement of sediment from the wetland was evident in shoaling at creek mouths in Lagunitas Creek (KHE 2009), turbidity levels with wetland waters remained equivalent to pre- and passive restoration conditions (Parsons 2010). Lower turbidity levels may have been driven to some degree by the dry conditions during the 2008-2009 winter, but sampling events did capture at least two small to moderately sized storm events (ibid). 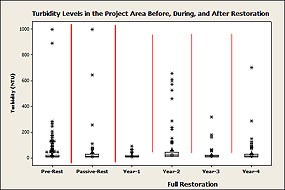
The influence of storm events was perhaps more evident in Year Two (October 2009 through September 2010). While there were no statistically significant differences in turbidity levels between pre-and post-restoration in Year 1, differences did exist between pre and post-restoration, with mean turbidity levels more than tripling from 15.7 Nephelometric Turbidity Units (NTU) to 60.8 NTU during Year 2 (Parsons 2011; Figure 1 - 88 KB PDF). In WY 2009/2010, rainfall totals jumped, and 50% of the sampling events occurred moderate to large storm events, although there was still no overbank flooding, at least from Lagunitas Creek. The fact that turbidity levels were significantly higher in the Project Area than in the Reference Areas suggests that turbidity levels in the restoring wetlands exceeded those that would be expected in mature marshes simply based on normal sediment resuspension pulses during storm events. Therefore, Year 2 may better represent the short-term increase in turbidity levels immediately after restoration that was predicted in the environmental compliance analysis documents. Turbidity during subsequent years dropped relative to Year 2, but still remained higher in Year 3 (21.3 NTU) and Year 4 (32.6) than in Year 1. Overall, turbidity has increased by 49% after the levees were breached, but, interestingly, there were no statistically significant differences in turbidity between the restored wetland and natural marshes (Parsons 2012). Following restoration, mean oxygen levels in the Project Area increased 14% from 7.30 during Pre-Restoration to 8.55 mg/L during Passive Restoration and 8.30 mg/L during Full Restoration. Lower D.O. levels occurred in Year 2 than Years 1, 2, and 4: both Years 2 and 3 were quite wet, although the Year 2 sampling approach may have captured more storm events. Cold temperatures and strong flow conditions could suppress biological activity in waters relative to warmer, more quiescent periods. Improvement was especially marked in the East Pasture, where mean oxygen levels climbed 69% from 4.98 mg/L pre-restoration to 8.39 mg/L after restoration (Parsons 2012). With restoration, oxygen concentrations might have been expected to decrease--or only increase somewhat overall--due to the abundant organic matter that die-off of pasture vegetation that has been released into Project Area waters during the first year and even second year of restoration. With high levels of organic matter, bacteria become extremely active and rapidly deplete oxygen levels in overlying waters, particularly during the night, when oxygen stores are not replenished through primary production. While pasture vegetation went through multiple stages of die-off in the first year with some die-off in the second year, the effect of this die-off has not been evident in Project Area oxygen concentrations, and, in fact, oxygen levels in Years 2, 3, and 4 were almost exactly equivalent to those in Reference Areas or natural marshes (Parsons 2012). The temperature of waters in the restored wetlands depends to some degree on the temperature of the waters flowing into it, as well as what happens to that water once there. Temperatures would have been expected to increase perhaps with reintroduction of warmer tidal waters to the former freshwater-dominated dairy, although an increase in daily exchange of waters with adjacent once levees were removed could also act to lower water temperatures. Since breaching of the levees, mean temperatures dropped by 4% within the Project Area from 15.9 degrees Centigrade Pre-Restoration to 14.2 degrees Centigrade during Passive Restoration and 15.2 degrees Centigrade during Full Restoration (Parsons 2012). This temperature decline could have simply reflected the change in hydrologic regime within the restored wetland. However, this same decline occurred in natural marshes following 2008, even those that are too distant to have been affected by restoration. This suggests that more regional or watershed-scale factors affected temperature regimes such as climatic patterns. Years 2 and 3 had higher-than-average rainfall, and stormwater-influenced creek flows are colder than tidal waters. These regional factors may have narrowed any differences that might have otherwise existed between the newly restored wetland and natural marshes, as levels did not differ during the post-restoration period (Parsons 2012). Similarly, the alkalinity or pH of waters also reflects both the pH of source waters, as well as conditions within the wetland. Most creeks feeding into the Project Area actually have fairly high pHs (range = 7.7-8.1) regardless of differences in geologic substrate between the granitic Inverness Ridge and the Point Reyes Mesa coastal marine terrace and surrounding Franciscan Formation hills, which are separated by the San Andreas Fault that created this tectonic estuary (Parsons 2009). This pH range is similar to that of tidal waters. Lower pH waters (~5.9-6.6) only occur in areas where there is more extensive influence from groundwater (ibid). 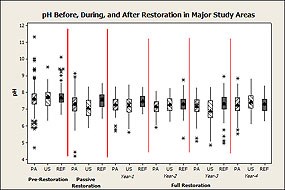
While introduction of full tidal flows to the Project Area might have been expected to boost pH, the geometric mean or median pH in the Project Area has actually decreased as much as 5% since dairy operation, from 7.60 during Pre-Restoration to 7.30 during Passive Restoration and to 7.23 during Full Restoration (Parsons 2012; Figure 2 - 111 KB PDF). Median pH during the first three years after restoration was 7.25 during Year 1, 7.14 during Year 2, 7.26 during Year 3, and 7.22 during Year 4 (Parsons 2012). The seeming drop in pH could be attributed a number of factors. First, the increase in hydrologic exchange and decrease in water residence time may have reduced the influence of phytoplankton blooms on pH relative to pre-restoration conditions: phytoplankton or algal blooms tend to drive up the alkalinity of waters (Parsons 2010). Secondly, breakdown of organic matter from extensive die-off of pasture vegetation can also increase release of humic acids into overlying Project Area waters, resulting in a decrease in pH. In addition, other biogeochemical processes can cause release of acidic substances into overlying waters when soils of tidal wetlands are dry for long periods of time. For example, flushing of sulfuric and iron-associated acids from oxidation of reduced sulfur and iron in soils into overlying waters can also decrease pH: sulfuric and iron-associated acids are generated when pyrites or other reduced or anoxic forms of sulfate and iron in the soil are oxidized and broken down or converted during drawdown or low-water periods, with soluble acids from oxidation then released into overlying waters when tidal exchange is reintroduced. The Project Area was deliberately dried out before and during construction to improve constructability conditions, resulting in even drier conditions than when the Project Area was ranched. Most of these factors relate to possible changes in physical and biological conditions that may have occurred after restoration. However, a similar seemingly slight, but significant, decrease in median pH has also been observed in natural marshes, which should not necessarily be affected by the restoration (Parsons 2012; Figure 2 - 111 KB PDF). In Reference Areas, pH dropped from a median of 7.62 during both Pre-Restoration and Passive Restoration sampling periods to 7.33 during Full Restoration (Parsons 2012; Figure 2 - 111 KB PDF). In evaluating the data more closely, it appears that the median pH for Reference Areas started declining in WY 2007 prior to restoration and continued declining each year until WY 2010, when values appear to have roughly stabilized around 7.30 (ibid). The largest declines were observed at the Undiked Marsh directly north of the Giacomini Wetlands and Limantour Marsh in Limantour Estero (ibid). From a historical perspective, pHs in Limantour Marsh and the Undiked Marsh appeared relatively stable until 2007, when values began to decline (ibid). The changes in these two natural marsh systems could relate directly to the fact that, in both cases, upstream areas have been restored, and restoration could be affecting the pH of downstream marshes, as well as that of the Project Areas. However, pHs in more distant areas of Tomales Bay were also lower during this period, as well. University of California, Davis, (UC Davis) researcher Ann Russell and her colleagues temporarily reoccupied the Tomales Bay sampling stations established by the Land Margin Ecological Research (LMER) program in the 1980s as part of a current research effort to understand the impacts of ocean acidification and climate change on estuarine invertebrates. During LMER, sampling was conducted at 10 stations from the outer Tomales Bay near the mouth to the southernmost one some distance north of the Undiked Marsh between 1987 and 1995. Russell reinitiated sampling in fall 2008 just when the restoration project was almost complete. During sampling efforts from 2008 to 2010, Russell has found no difference in most of the field parameters between the LMER and recently collected data, however, pH did appear to have declined in both the outer and inner Bay by as much as 0.25 pH units (A. Russell, UC Davis, pers. comm.). While apparent decreases in pH in Tomales Bay and its marshes might lead to questions about the effect of ocean acidification on pH of tidal waters flowing into estuaries, there are several factors that throw this into question. While Russell and colleagues did observe larger decreases in pH in the Outer Bay relative to the Inner Bay (Russell et al. 2010), in our results, pH decline appears to have been greatest furthest from the mouth of the estuary, which suggests that, for our study, changes are not directly related to inflow of lower pH waters from the ocean. Russell also believes that the change observed in pH for Tomales Bay was too large to be attributable to dissolution of CO2 from the atmosphere into estuarine waters (A. Russell, UCDavis, pers. comm.). However, not all carbon inputs into the estuary come from the atmosphere (ibid). In addition to changes in pH, concentrations of dissolved organic carbon (DOC) and, in the Outer Bay, dissolved inorganic carbon (DIC) also appeared higher relative to the LMER program sampling period (Russell et al. 2010). Some of these differences may relate to the fact that the sampling period during the study implemented by Russell and her colleagues was during a wetter period than the LMER sampling period (J. Largier, UC Davis, pers. comm.). This would also affect transport of carbon from the upper watershed into the Bay. At least in terms of the Park Service's dataset, cumulative rainfall volume did appear slightly higher during the post-restoration sampling period (mean for Oct 2008-Sept 2012=3.51 in>normal) than the pre-restoration one (mean for Oct 2004-Sept 2008=0.70 in>normal). This would increase freshwater inflow from both surface water and groundwater sources, which tends to be lower in pH than tidal waters: this is evident in the generally lower range of values for the Upstream Areas during the post-restoration sampling period (Figure 2 - 111 KB PDF). In particular, the groundwater outflow in this area tends to have a slightly lower pH: these factors could affect pH within the restored wetlands, above and beyond any restoration effect. In addition, while these pH changes may be unrelated to ocean acidification, it does not rule out that we may begin to see changes related to climate change in future years, although pH in estuaries is normally more highly variable than that of oceans even without the influence of climate change. 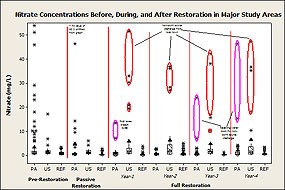
Nitrates did actually show a sharp pulse immediately after the levees were breached, with levels in newly restored waters averaging 3.44 mg/L (Parsons 2010; Figure 3 - 149 KB PDF). However, concentrations dropped dramatically in future sampling events, which included two storm events (Figure 3 - 149 KB PDF). By January 2009, estimated concentrations had dropped to an average of 0.18 mg/L and median of 0.13 mg/L, with May 2009 (average=0.02 mg/L) and August 2009 (average=0.06 mg/L) even lower (ibid). This pulse in November--and continued inputs of nitrates from non-point source run-off from Point Reyes Station--led to average nitrate concentrations for 2008-2009 or Year 1 (3.45 mg/L) being similar to that of levels prior to restoration (3.22 mg/L; ibid; Figure 3 - 149 KB PDF). Median values, however, showed much stronger disparity, with a 55% decrease in median or central value from 0.83 mg/L pre-restoration to 0.13 mg/L after restoration (Parsons 2010). In Year 2, estimated mean nitrate concentrations dropped even further to 0.63 mg/L, but they climbed again in Year 3 to 1.02 mg/L and again in Year 4, doubling relative to Year 3 to 2.00 mg/L (Figure 3 - 149 KB PDF). A slightly different pattern was observed with median nitrate levels. During Year 1 post-restoration, median nitrate concentrations plummeted to 0.04 mg/L in Year 1, but then rose again in subsequent years to 0.38 mg/L in Year 2, 0.28 mg/L in Year 3, and 0.25 mg/L in Year 4 (Figure 3 - 149 KB PDF). Despite increases in nitrate concentrations during recent years, nitrate concentrations during Full Restoration (1.16 mg/L) were still 64% lower than those during recorded prior to restoration (3.22 mg/L), but statistically equivalent to levels recorded during Passive Restoration (4.52 mg/L; Figure 3 - 149 KB PDF). A slightly different trend appeared to occur with estimated medians, which perhaps better reflect "average" conditions as they are not affected by localized hot spots or one-time spikes in nutrients. Estimated median nitrate values dropped from 0.83 mg/L Pre-Restoration to 0.37 mg/L during Passive Restoration and 0.26 during Full Restoration. The difference between patterns in mean and median levels suggest that certain sites or sampling events have elevated mean nitrate levels: this could possibly be the influence of a non-point source discharge from Point Reyes Station into one of the restored wetland features, which is sporadically causing large spikes in nitrate concentrations. This sampling location exceeded the U.S. Environmental Protection Agency maximum standard of 10 mg/L during every sampling event in Years 2, 3, and 4 and 75% of the events in Year 1 (Figure 3 - 149 KB PDF). Not surprisingly, the highest nitrate levels in the restored wetland during Years 3 and 4 occurred in the Tomasini Triangle Pond, which is a created freshwater marsh into which this non-point source discharges: it also may be affected by septic-influenced groundwater from the Point Reyes Mesa. Interestingly, Year 1--which had very low median nitrate levels following restoration--was one of the drier years after the levees were breached while Year 2--which had the lowest mean nitrate concentrations, but higher median concentrations--was one of the wettest: Years 3 and 4 had either slightly above or below average rainfall, respectively, and the patterns of rainfall distribution were very different (Parsons 2012). During storm events, nitrate concentrations in Lagunitas Creek can reach as high as 2.0 to 2.5 mg/L, which is notably higher than the peak nitrate concentrations of approximately 1.5 mg/L (24 μM) documented off the Point Reyes coast that is potentially exported into Tomales Bay during upwelling events (Largier et al. 2006, Wilkerson et al. 2006). The influence of rainfall patterns is evident in results for natural marshes, as well. Estimated mean nitrate concentrations appeared higher in Year 2 (0.76 mg/L) than in Year 1 (0.35 mg/L) and Year 3 (0.34 mg/L; ibid). However, Year 4, which had similar rainfall totals to Year 1, had nitrate levels more similar to Year 2, with the estimated mean being 0.64 mg/L (ibid). This suggests, as was hypothesized even prior to restoration, that factors other than watershed loading may influence nitrate levels such as internal cycling of nutrients from breakdown of organic matter during the dry season. Interestingly, within natural marshes, estimated median nitrate levels appeared to drop after the Pre-Restoration period from 0.70 mg/L to 0.13 mg/L during Passive Restoration (~2007-2008) and then climb slightly again to 0.27 mg/L during the full restoration sampling period (Oct 2008 to Sept 2012), which is a slightly different pattern occurred in the restored wetland. 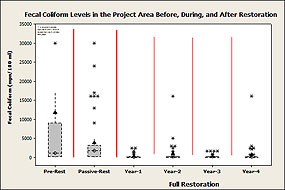
Declines were even more dramatic for fecal coliform. Following restoration, the estimated geometric mean or median fecal coliform concentrations decreased significantly in the Project Area, dropping 93% from 1,600.9 mpn/100 mL during Pre-Restoration to 107.0 mpn/mL during Full Restoration (Parsons 2012; Figure 4 - 99 KB PDF). Coliform levels, which had already declined somewhat during Passive Restoration, dropped sharply again immediately after restoration in Year 1 (median=90.4 mpn/mL; ibid). Median concentrations appeared to climb slightly in both Years 2 and 3 to 141.3 and 134.1 mpn/100 mL, respectively, but dropped again in Year 4 (74.0 mpn/100 mL). The fact that many of the sampling events coincided with storm events during these somewhat wetter years undoubtedly increased fecal coliform levels, particularly as similar increases were seen in natural marshes (ibid). The dramatic declines in fecal coliform concentrations following restoration, even during wetter periods, are also evident in changes in the frequency of exceedance of Basin Plan or Total Maximum Daily Loads (TMDL) standards. Approximately 38% of samples collected after restoration exceeded the contact water recreation standards of 200 mpn/100 mL, compared to approximately 78% Pre-Restoration, at least a 51% decrease (Parsons 2012). Only 6% of samples collected after levees were breached exceeded 2,000 mpn/100 mL, the standards for non-contact water recreation, whereas 47% exceeded before levee removal. Exceedance of municipal water supply thresholds of 20 mpn/100 mL dropped from 95% of all samples collected in the Project Area Pre-Restoration to between 80% and 89% of all samples collected during Years 1-4 of Full Restoration, respectively. Exceedances in upstream areas of Lagunitas Creek remained roughly similar between pre- and post-restoration, with the TMDL standard of 200 mpn/100 mL being exceeded approximately 60% of the time in Year 1, 71% of the time in Year 2, and 65% of the time in Year 3, compared to 72% of the time prior to restoration (ibid). One of the established sites for fecal coliform monitoring in the TMDL program is Lagunitas Creek at the Green Bridge, just upstream of the restoration period. The restoration project would not be expected to directly influence fecal coliform concentrations at this location, because it is upstream of the restoration project, and fecal coliform levels are strongly associated with watershed loading. However, there may be indirect effects due to changes in hydrologic circulation and other factors. Coliform levels at the upstream end of the Project Area boundary on Lagunitas Creek at the Green Bridge remained roughly similar to Pre-Restoration conditions, with the TMDL standard of 200 mpn/100 mL being exceeded approximately 60% of the time, compared to 72% of the time prior to the restoration period. The 90th percentile of 400 mpn/100 mL standard was exceeded approximately 44% of the sampling periods during the post-restoration period, as opposed to 58% of the time Pre-Restoration. Exceedances of the 95 mpn/100 mL TMDL load-based allocation for the Green Bridge sampling site dropped somewhat from 100% during Pre-Restoration to 76% after restoration. 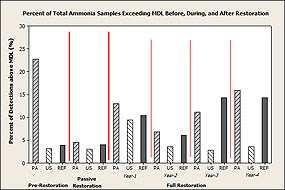
Perhaps, some of the most interesting results came from the ammonia data. In the first year following restoration, the number of ammonia detections decreased 43% from 22.8% of the samples in restoration project area prior to restoration to 13.0% of the samples in the first year after restoration (Parsons 2010; Figure 5 - 114 KB PDF). Estimated East Pasture concentrations fell even more dramatically from 2.61 mg/L pre-restoration to 0.44 mg/L in Year 1 post-restoration, a decrease of 83% (ibid). The number of total ammonia detections decreased even more dramatically in Year 2 of Full Restoration, with 6.8% of the samples exceeding detection limits (Parsons 2012). In Years 3 and 4, detections climbed again to 11.1% of the samples in Year 3 and 15.9% of the samples in Year 4, but were still seemingly lower than Pre-Restoration (ibid). Interestingly, the number of detections was even lower during the Passive Restoration period (4.6%; Parsons 2012). The increase in ammonia detections from passive to full restoration could be attributable to restoration-related changes: increase in ammonia following breakdown and conversion of decomposing organic matter into organic and inorganic nutrients and flushing of ammonia from soils into overlying waters. Also, it should be noted that while the number of times total ammonia was detected increased, mean concentrations actually appeared to decrease 73%-88% after restoration from 1.26 mg/L Pre-Restoration to 0.34 mg/L during Year 1, 0.15 mg/L during Year 2, and 0.52 mg/L during Year 3 (ibid). One interesting caveat to this hypothesis is that ammonia detections increased in all of the Study Areas following restoration, even those natural marshes that were distant from the restored wetland (Parsons 2012). The number of detections in natural marshes jumped from 3.9% of the samples pre-restoration to 10.3% in Year 1, while detection frequencies in natural marshes during the passive restoration period were roughly equivalent to Pre-Restoration (4.0%; ibid; Figure 5 - 114 KB PDF). During Years 1-4, ammonia detection totaled 11% of samples, a 182% increase. While the number of detections increased, the estimated average ammonia concentrations for natural marshes appeared roughly equivalent pre-restoration and post-restoration (ibid). The overall increase in the presence, if not concentrations, of total ammonia within both the restoration project area and natural marshes--some of which are distant from the Project Area--suggests that the increases in ammonia detections documented post-restoration do not all result from the effects of restoration. One possible explanation for the increase in ammonia detections, at least in Year 1, may have been the dry winter, which allowed tidal influence to extend further upstream due to the lack of a strong countering force from freshwater flows. Recent research on salinity intrusion associated with sea level rise on the East Coast found that intrusion of even weakly saline waters into formerly freshwater tidal areas--areas where tides affect rise and fall of water level, but do not affect salinity--mobilized ammonia into overlying waters, causing a net efflux or outflow from the system. In these areas, ammonium, phosphate, and silicate fluxes or transport from the system increased by 20 to 38% (Joye et al. undated). Most of this increase probably results from cation exchange of the strongly ionic salt in seawater (sodium chloride or NaCl) for the more weakly ionic ammonium (NH4-; Craft et al. 2009), but ammonia may also be produced through increased mineralization of organic matter in soils. Salinity data collected in Year 1 showed increases in salinity not only in the restoration project area understandably, but in natural marshes, so this supports the potential for increased upstream tidal influence to have caused biogeochemical changes that resulted in more frequent ammonia detections (Parsons 2010). In Years 2 and 3, wetter conditions drove down salinities below Pre-Restoration median levels by as much as 9-11 parts per thousand (ppt), so higher ammonia detection frequencies in Years 2 and 3 relative to Passive Restoration periods are harder to explain (Parsons 2012). Because levees essentially precluded or minimized export of pollutant loads from the ranch pastures, with full levee removal, the contribution of the restored wetlands to downstream loading would be expected to increase, even if concentrations within the wetlands dropped dramatically. For example, for fecal coliform, estimated geometric mean or median loading rates jumped 274% from 57.5 mpn/s during Pre-Restoration to 242.8 mpn/s during Passive Restoration and 215.2 mpn/s during Full Restoration (Parsons 2012). Conversely, estimated arithmetic mean loading rates, which were higher than median values, seemingly decreased from 249,389 mpn/s during Pre-Restoration to 52,716.9 mpn/s during Year 1, 33,657.5 mpn/s during Year 2, and 34,036 mpn/s during Year 3 (ibid). This suggests that peak loading during high flow events may have dropped relative to Pre-Restoration conditions, but the average loading rate for fecal coliform during non-storm flows has apparently increased. For nitrates, loading increased between Pre-, Passive, and Full Restoration, with estimated means climbing from 0.60 mg/s pre-restoration to 1.17 mg/s during Passive Restoration and 1.44 mg/s after restoration. In comparison, within natural marshes, loading rates decreased for fecal coliform and remained equivalent for nitrates during the post-restoration sampling period. Conclusions: Some improvement in water quality conditions were expected immediately following restoration due to decreases in residence time for leveed waters. However, these improvements were expected to be tempered to a large degree initially by pulses in sediment and nutrients from re-working of exposed soils by tides, floods, and decomposition and mineralization of pasture vegetation, with variables such as pH and dissolved oxygen (D.O.) responding accordingly to the resulting flux in nutrients. During the first several years after restoration, the speed with which conditions improved within the Project Area for variables such as dissolved oxygen and nitrate and fecal coliform concentrations far exceeded our expectations, and expected issues as discussed above with large temporary increases in turbidity and temporary decreases in dissolved oxygen did not materialize or were not as dramatic as anticipated. At least initially, some of this may have partially resulted from the fact that Year 1 or WY 2009 was a dry year, and few large storms occurred that would have contributed to reworking of this evolving landscape, even though some of the few larger storm events that did occur were captured. Even in the second year, which was much wetter, there were no overbank flooding events. Despite the lack of storms, reworking of the landscape did occur, largely due to reintroduction of tidal action, with shoals evident at the mouth of newly created tidal channels due to sediment efflux from the marsh (KHE 2009). Later years were wetter and even included an overbank flooding event, but, still, through Year 4, water quality conditions have improved much more quickly than anticipated without the degree of short-term adverse impacts that were originally predicted. With some exceptions, water quality parameters have shown significant, positive improvements in conditions between Pre- and Full-Restoration phases. Dissolved oxygen levels increased 14%, while nitrate, ammonia, phosphate, phosphorous, and fecal coliform levels decreased at least 23%, with some of these parameters falling quite substantially (phosphates; 900%). With restoration, vegetated waterways within the East Pasture of the Project Area were no longer regularly dredged, which increased organic matter available for breakdown by bacteria that depleted oxygen in the relatively stagnant waters. Elimination of this management practice, coupled with a decrease in residence time of waters with removal of levees and tidegates, has increased oxygen levels. Nitrate, ammonia, fecal coliform, and, to a lesser extent, phosphate levels were expected to drop with removal of cows and discontinuation of manure spreading. After only a short time (four years), most of the parameters, including temperature, dissolved oxygen, ammonia, phosphates, phosphorous, and seemingly at least median concentrations of nitrates were actually statistically equivalent to levels in natural marshes. Even turbidity levels in the Project Area showed no statistical difference with those in Reference Areas, despite the fact that they had increased relative to Pre-Restoration conditions in the Project Area. Restoration appears to be the primary factor driving changes in levels of salinity, dissolved oxygen, turbidity, ammonia, and fecal coliform and loading rates of nitrates and fecal coliform in the Project Area since the levees were breached. However, the situation is not as clear cut for some of the other variables such as pH, temperature, nitrates, and phosphates, levels of which dropped in both the Project and Reference Areas between the pre- and post-restoration sampling periods. In the case of pH, the rate of decline was identical between the Study Areas, strongly suggesting that external factors such as the volume and distribution of rainfall and its effect on lower-pH freshwater inflow may more influence pH in the restored wetlands than any restoration-related factors such as release of acids from decomposition of organic matter or oxidation of soils. The same appears true appears true for temperature. However, the differences in the magnitude of change between the Project and Reference Areas for variables such as nitrates and particularly phosphates suggests that both restoration and climatic factors may be playing a role in shaping current water quality conditions in the restored wetland. Others factors also have an effect, including non-point source run-off: reductions in nitrates might even have been dramatic had mean levels not been artificially inflated by a non-point source run-off that flows into the created freshwater marsh discussed earlier. Perhaps, some of the most interesting results were those in which the trajectory of change differed completely between the two Study Areas. For example salinity decreased within natural marshes during the post-restoration sampling period, but increased considerably during this period in the Project Area: any climate-related reduction in salinities within these estuaries as a whole was obviously overwhelmed by the re-introduction of tidal waters to the artificially maintained freshwater environment of the former dairy ranch. Similarly, detection of total ammonia decreased in the restored wetland after levee breaching, but increased considerably in natural marshes. Factors driving this change are not understood, but similar increases have been observed at other sampling sites in the Tomales Bay during recent years (Rob Carson, Tomales Bay Watershed Council, pers. comm.). Ultimately, restoration of more than 600 acres of historic floodplain/marshplain is expected to not only restore water quality conditions within the Project Area, but Tomales Bay itself. Therefore, one of the most important indicators of the success of this project will be changes in concentrations and, even more importantly, loading between upstream and downstream sampling locations. As was expected, during the first four years after restoration, loading rates of pathogens and presumably nitrates actually increased in the Project Area relative to pre-restoration conditions, because, prior to levee removal, the pastures had either no direct connection to Lagunitas or other creeks (East Pasture) or only muted tidal connection (West Pasture) and, therefore, were only very infrequently in a position to contribute to downstream "loading." It is likely that watershed-scale benefits will take time to be realized due to the continuing evolution occurring within the Project Area, as pasture vegetation continues to die off and convert into more natural salt- and brackish-marsh vegetation communities. Glossary: Loading: Loading refers to the amount of pollutants conveyed in a given volume of water at one point in time. Loading takes into account concentration of a nutrient or pollutant in the water and adjusts concentration based on streamflow discharge (cubic feet/second), which is based on flow rate and width and depth of the water body at the time the sample is collected. mpn: mpn stands for "Most Probable Number" and refers to a method that uses dilution cultures and a probability calculation to determine the approximate number of viable cells in a given volume of sample. It is useful when samples contain too few organisms for agar plates to be used or when organisms will not grow on agar. For example: 50 mpn/100 mL means that the Most Probable Number of viable cells in 100 mL of sample is 50 (Cascade Analytical Environmental Laboratory, Yakima, WA, web site 2010). References Craft, C. (2009). Effects of Climate Change on Water Quality Improvement Functions of Tidal Forests and Marshes. Oral Presentation. Coastal and Estuarine Research Federation. Portland, OR. Fischer, D. T., S. V. Smith, et al. (1996). Simulation of a century of runoff across the Tomales watershed. Marin County, California. Journal of Hydrology 186: 253-273. Joye, S. et al. (undated). Salinization of Coastal Freshwater Wetlands. University of Georgia, Athens. Web site. KHE (2009b). Evaluation of recent topographic profiles at selected locations in Lagunitas Creek Lewis, D. J., E.R. Atwill, et al. (2001). Linking on-farm dairy management practices to storm-flow fecal coliform loading for California coastal watersheds. Santa Rosa, California, University of California Cooperative Extension. Parsons, L. (2009). Improving Wetland and Ecosystem Health through Restoration: Pre-Restoration Hydologic and Water Quality Conditions. Giacomini Wetland Restoration Project. Point Reyes National Seashore in collaboration with Kamman Hydrology and Engineering. March 2009. Vanni, M. J., W. H. Renwick, et al. (2001). "Dissolved and Particulate Nutrient Flux from Three Adjacent Agricultural Watersheds: A Five-Year Study." Biogeochemistry 54(1): 85-114.
|
Last updated: June 27, 2024
