


DRAFT: Preliminary internal document in review/ Do not cite
This is an internal website intended to capture current approaches and knowledge base from the Natural Sounds & Night Skies Division in order to provide guidance to the field in an easy, user friendly format. It is still under development and this version was made available solely for this internal review. Following review, and prior to formal internal agency vetting, pages will be inactivated in order to incorporate input.
Visit our keyboard shortcuts docs for details
- Duration:
- 6 minutes, 17 seconds
An introduction to data collection
2. Data Collection
Measuring the acoustic environment, the natural ambient sound level, and specific sources of noise in national parks are critical steps in understanding how to manage noise to protect natural sounds in national parks. Sound is a complex resource; it fluctuates rapidly, has different components (amplitude, frequency, and duration), and tonal qualities (e.g. modulation, reverberation), and often occurs outside the range of human hearing. Collecting sound data can be accomplished through three methods: on-site listening, acoustic monitoring and recording, and the use of predictive models. Additional information on methods for measuring sounds can be found here.

2.1 Establishing Baseline Ambient Conditions
NPS has developed and published peer reviewed monitoring protocols [PDF] that use standardized methodologies to produce scientifically defensible data that can be relied on by park managers. As with other natural resources NPS protects, when it comes to acoustic resource stewardship, the first step is understanding the park's overall acoustic environment.
The acoustic environment includes natural and existing sound levels across all hours within a monitoring period and an inventory of audible sound sources. Identifying or creating an inventory of a park's acoustic conditions documents the quality of the acoustic environment at a given time, and establishes a reference point against which changes in exposure can be measured.
In addition to capturing baseline conditions, acoustic monitoring can also be a valuable tool for documenting specific widlife activity, ecological patterns, and administrative/ visitor uses and it is often more reliable, less expensive, and less intrusive than other types of monitoring. Many animals use sounds to vocalize warnings, establish territory, attract mates, announce their presence, and exhibit other various behaviors. Consequently, audio recordings can be used for chronicling changes in wildlife behavior in response to various natural and anthropogenic stimuli. Unattended recording is noninvasive: weeks of data can be obtained with minimal human presence and instrument footprint, and animals do not have to be captured or tagged.
Acoustic monitoring is also an efficient way to record most forms of traffic, such as hikers, ground based vehicles, and even aircraft. Once the baseline condition is established, park managers have the option to continue with intermittent monitoring (or repeated inventories) of the acoustical environment. Long-term monitoring plans can be developed taking into account the primary acoustical resources identified in general planning documents and more detailed Acoustical Resource Management Plans (see Planning, Chapter 4). To track and understand long-term trends in ocean noise, the NPS has launched a network of underwater acoustic monitoring sites. Learn more about this network here.
Acoustic monitoring data can be used to inform scientific study design, park planning, decision making and management actions. Monitoring results can also help park managers track trends in conditions, document improvements, and assess the extent to which management priorities and objectives are being met.

2.2 On-site listening
During on-site listening sessions, attentive listeners can identify audible sounds, noting when sounds begin and end with a watch, notebook, and pencil to create an inventory. To expedite collection, transcription, and the reliability and consistency of the data, the NPS developed sound logging software that runs on handheld devices such as mobile phones. With this application, on-site listeners simply tap buttons on the screen to track sound audibility. With brief training, on-site listening can be done by almost anyone, including NPS staff, interns, and volunteers.
Visit our keyboard shortcuts docs for details
- Duration:
- 1 minute, 58 seconds
Figure 1: Watch this video to learn how on-site listening is done.
The results of listening sessions are immediately displayed on the screen for reference, but the data are also saved as a text file for later analysis and reporting. Although logistic constraints prevent comprehensive sampling by this technique, on-site listening sessions are an excellent screening tool for parks initiating acoustical studies. They produce an extensive inventory of sound sources, require little equipment and minimal training, and provide an excellent venue for educating park staff and volunteers about the importance of acoustic resources. Additionally, NSNSD staff use on-site listening sessions as a supplement to office-based sound source inventories. They are used to ground truth audibility results by documenting what sound sources were heard by a listener at a given site and time.
2.3 Acoustic Monitoring and Recording
While on-site listening can describe the type and duration of sounds at a given site, it cannot be used to quantify how loud a given sound is. NSNSD uses sound level meters (Figure 2, left) and sensitive microphones (Figure 2, right) to continuously record sound levels at park sites. These measurement instruments are paired with digital audio recorders (Figure 2, center) which also record continuously, documenting the various sounds made during the measurement period. Together, these devices form a complete system used to measure how loud the environment is (sound level) and identify the sources of sound in the acoustic environment.

The monitoring equipment collects sound pressure levels in addition to audio recordings. The sound pressure level, or amplitude, is recorded in decibels (dB), and the frequency, or pitch, of a sound is recorded in hertz (Hz). Sound equipment used in the parks records sounds from 20 to 20,000 Hz, which approximates the human hearing range.
The sound level meter measures sound pressure levels over specific frequency bands, typically in one-third octave bands between 12.5 Hz and 20 kHz. These 33 1/3 octave frequency bands closely represent how humans distinguish between frequencies of sound.
Visit our keyboard shortcuts docs for details
- Duration:
- 29 seconds
Figure 3. Watch this video to see how the sound of birdsong is distributed across many different 1/3 octave bands. The light blue bars indicate current sound level in a given band, while dark blue bars show the highest sound level achieved in that band.
The digital audio recorder records an audio track of what is making the sound. Recording the sound level of each one-third octave band combined with the digital audio recordings allows NPS to determine what types of sounds are contributing to the overall sound pressure level of a site.
At sites where the sound pressure levels are exceptionally low, it is ideal to monitor with low-noise, high-sensitivity microphones, whenever possible. For some types of analysis, the decibel levels are A-weighted, to more closely represent the sensitivity of the human ear to different frequency ranges.
Advancements are continuously being made in acoustic data analysis. Therefore, it is crucial to obtain high-quality archival recordings that can be used to compute any conceivable metric for future analysis. Digital recordings provide an archival record of the soundscape of an area and can be used to address future challenges. For detailed equipment specifications and set-up instructions, see NSNSD acoustical training manual [PDF].
2.3.1 Meteorological Data
Previous studies in national parks show a strong correlation between land cover, wind speed, elevation, and ambient sound level. Sounds travel differently in cold or hot temperatures making meteorological data critical to understanding acoustical environments. NPS collects data about wind direction, and wind speed, and in some cases, air temperature, and humidity (Figure 4). Wind speed data is particularly important because a substantial change in noise level can occur as wind speeds increase. Wind speed is recorded continuously at 1-second intervals throughout the monitoring period. High wind speeds (greater than 5 m/s or 11 mph), begin to interfere with the acoustic equipment's ability to record sound and may create artifact sounds, so to ensure the most accurate data, recordings taken during high wind events are excluded from analysis. This approach is set by ANSI standard S12.9-2013.

2.3.2 Site selection
Areas of similar vegetation, land cover, topography, elevation, distance to flowing water, and climate that contain similar sources of natural sounds are used to define sampling areas in a park. Landscape level models of sound levels may also be useful in selecting sampling areas. Once the primary sampling areas have been identified, measurement locations are selected to ensure that all of the primary sampling areas of the park are represented. In other instances, sites may be selected to study a specific noise source (see section 2.5). In all cases, specific measurement locations within sampling areas take into account other factors such as park resources, park management zones, visitor-use, law enforcement and facility management needs, and wildlife habitats. Refer to the Mount Rainier NP example at right to see how sampling areas are distributed throughout a park (Figure 5).
While the principal consideration in selecting measurement locations is to ensure data are collected in all of the primary sampling areas of the park, additional considerations include:
- Park management zones and soundscape management objectives of those zones;
- Specific sound-sensitive areas;
- Specific acoustic data needs;
- Proximity to natural and human-caused sounds;and
- Equipment considerations (security, solar exposure, visibility, etc.).
The final selection of measurement locations is made by screening potential sites and by considering all of the above factors. Other factors such as access, equipment availability/capability, and availability of personnel to deploy and service the equipment play a role in site selection. Historically, purposeful sampling (as opposed to randomized sampling) was used to better leverage limited resources and address specific management objectives.
2.3.3 Measurement Season and Duration
Ideally, acoustic data are collected during each season. However, two seasons, summer and winter, are usually adequate. When assessing specific sound sources, data must be collected during the season(s) in which the activity occurs as well as the season when the activity occurs the least or not at all. For example, air tour operators typically offer tours during the summer months. In many parks, few, if any, tours are conducted in the winter. In this case, measurements are taken during both the summer and winter seasons. For those parks at which regular air tours occur year-round, data should be collected from different seasons to adequately model potential air tour impacts (i.e. capturing seasonal variability not just in air tours, but in wildlife behavior, visitor use, etc).
To determine adequate measurement periods, one should consider the daily and seasonal variability of acoustic conditions in parks. Measurements taken at a particular site need to be of sufficient duration to ensure statistical confidence in the data, but also be reasonable in light of practical and other resource considerations. Scientific literature shows that a minimum 25-day measurement period limits the measurement uncertainty of acoustic data collected in various national parks to less than three decibels .
As shown in Figure 6 from Iyer H, 2005, monitoring periods of 14, 25, and 40 days were tested to determine how long one should measure to obtain a relatively accurate estimate of seasonal sound levels. A 25 day monitoring period was selected because median sound levels (L50) ranged between -3.2 dB and 2.7 dB for summer months and -2.6 and + 3.9 dB for winter months. Thus, we should expect no more than a ± 3 dB difference between the true ambient sound level and the sound level calculated from a 25 day sample period. For some situations or environments, shorter or longer measurement periods may be needed.

2.4 Noise Modeling
In order to determine broad patterns in noise impacts across park landscapes, a geospatial model was developed to estimate acoustic conditions (Mennitt et al, 2013; Mennitt et al, 2014). The model predicts sound levels using more than 100 explanatory variables such as location, climate, landcover, hydrology, wind speed, and proximity to noise sources such as roads, railroads, and airports. The model is calibrated with ground-based sound levels measured at hundreds of national park and urban sites. It enables NPS to estimate three sound level metrics: natural ambient, existing ambient, and impact.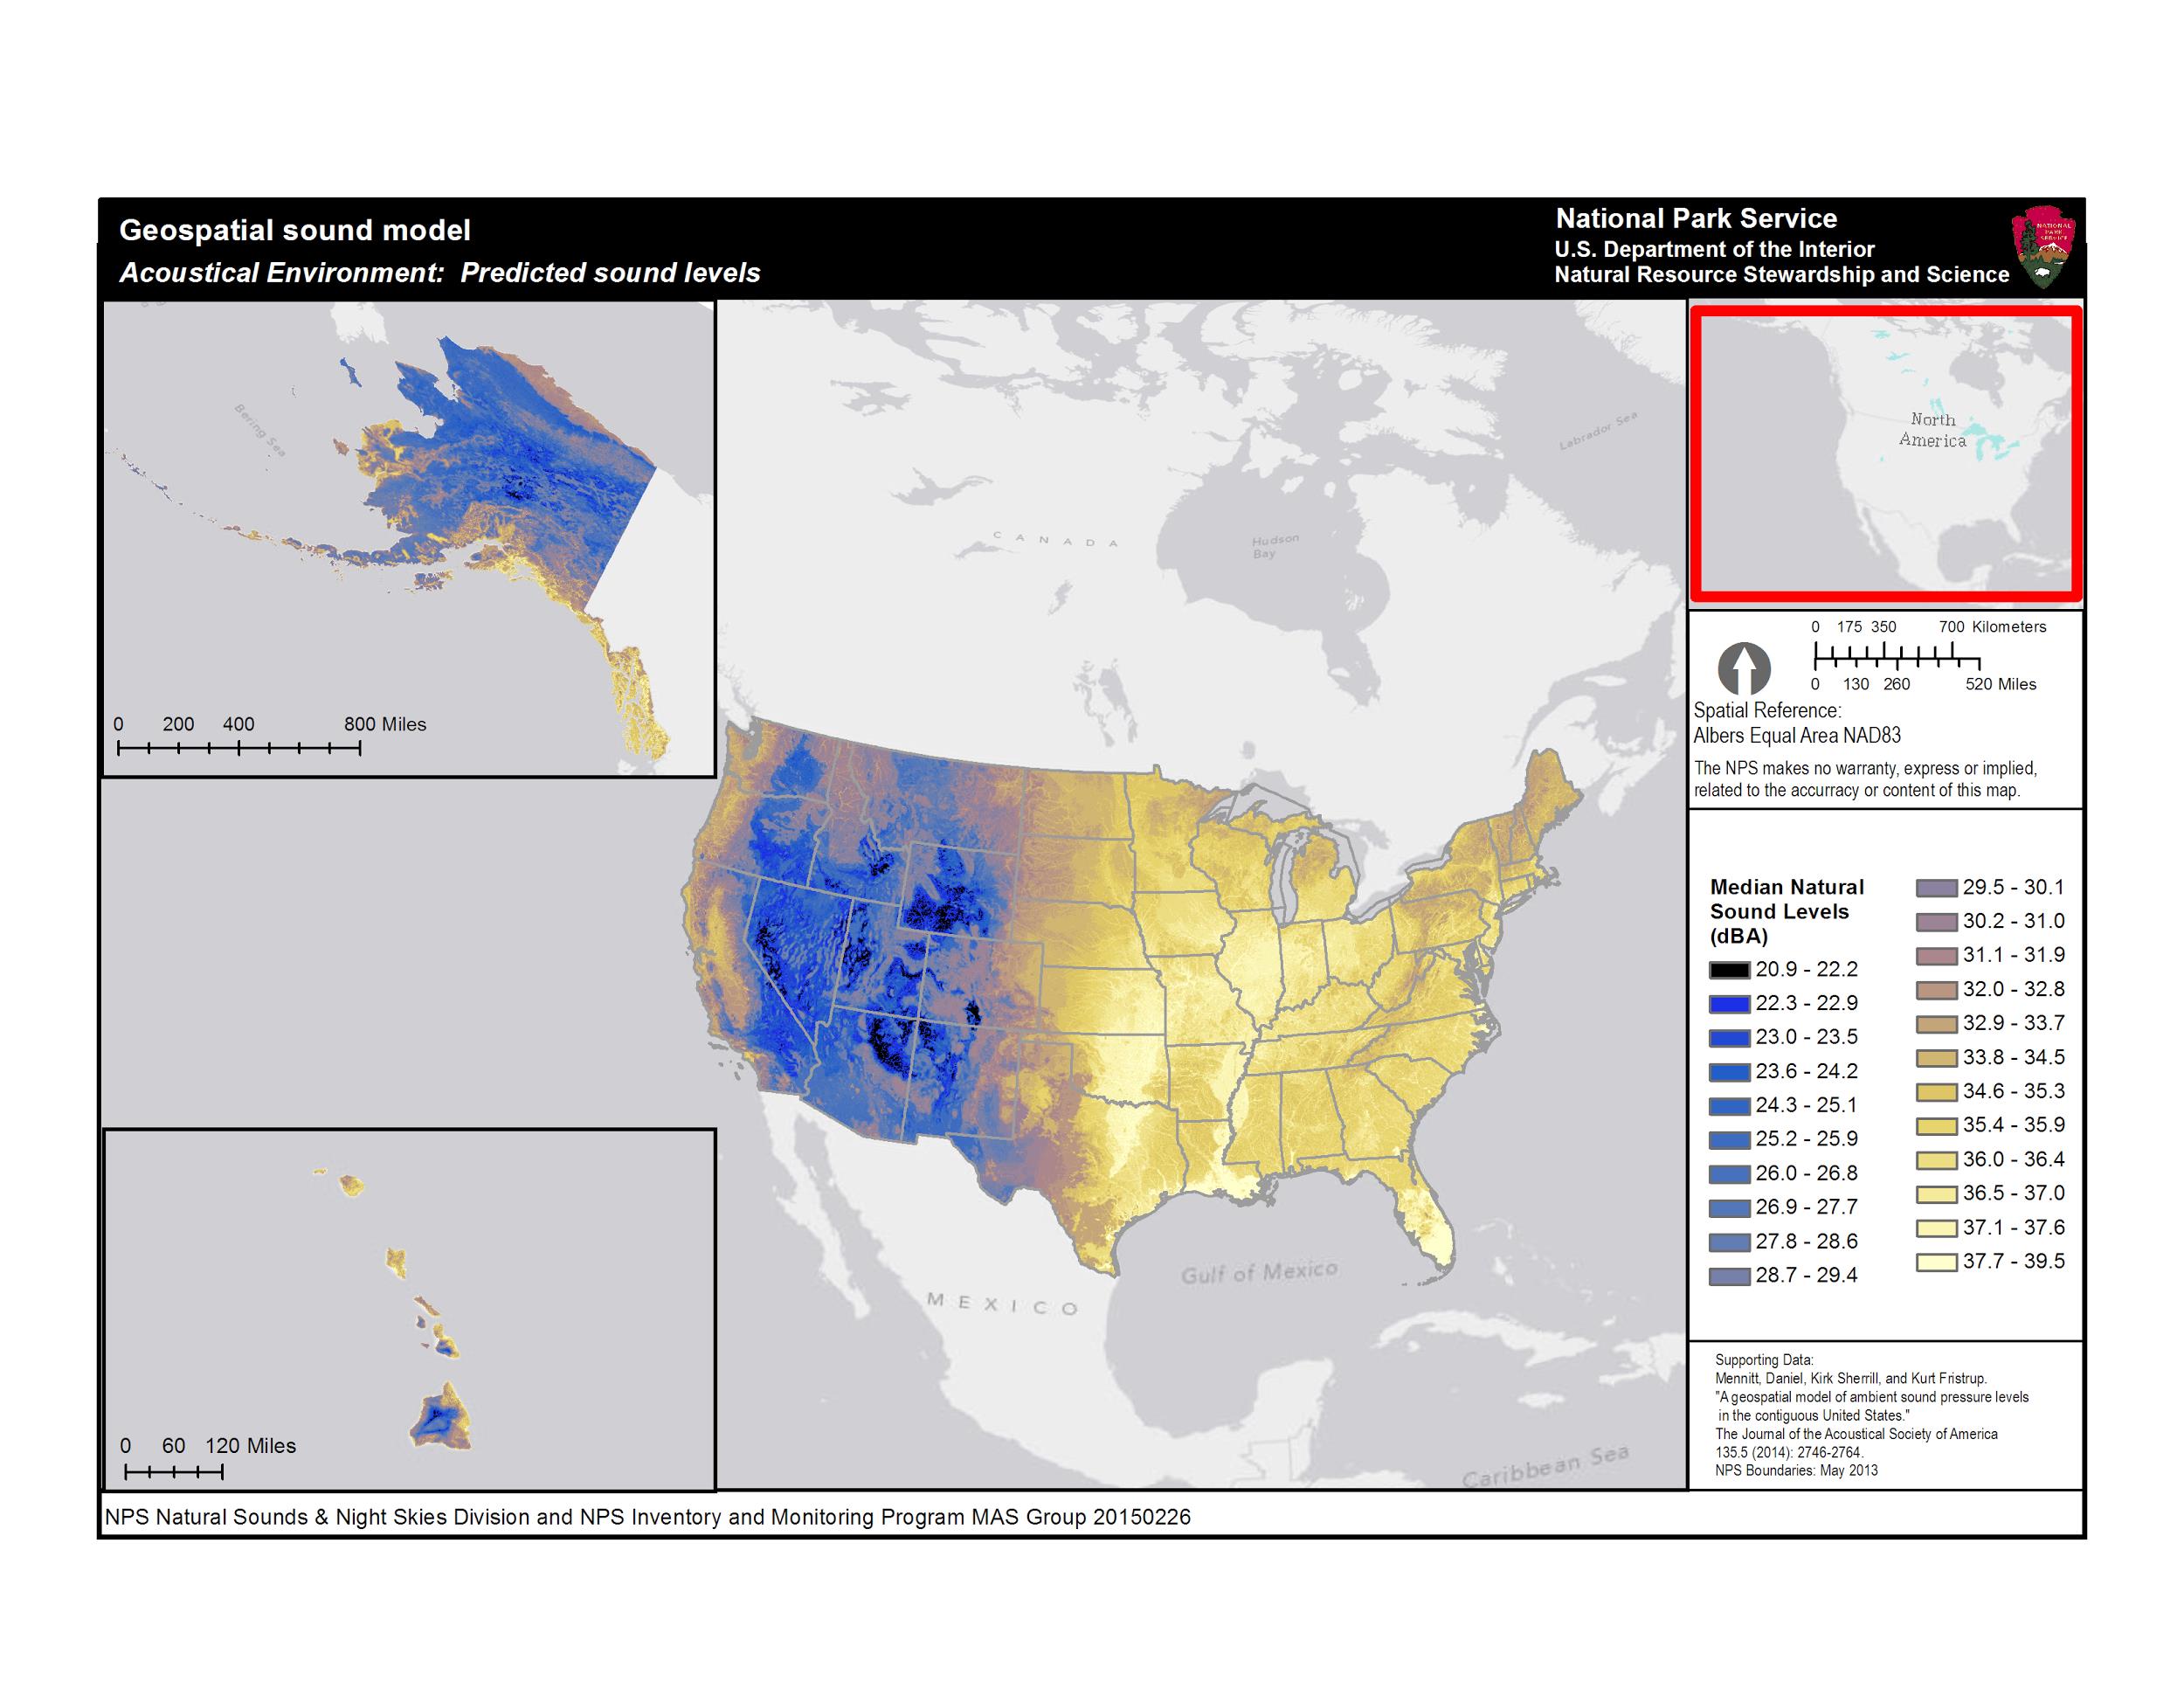
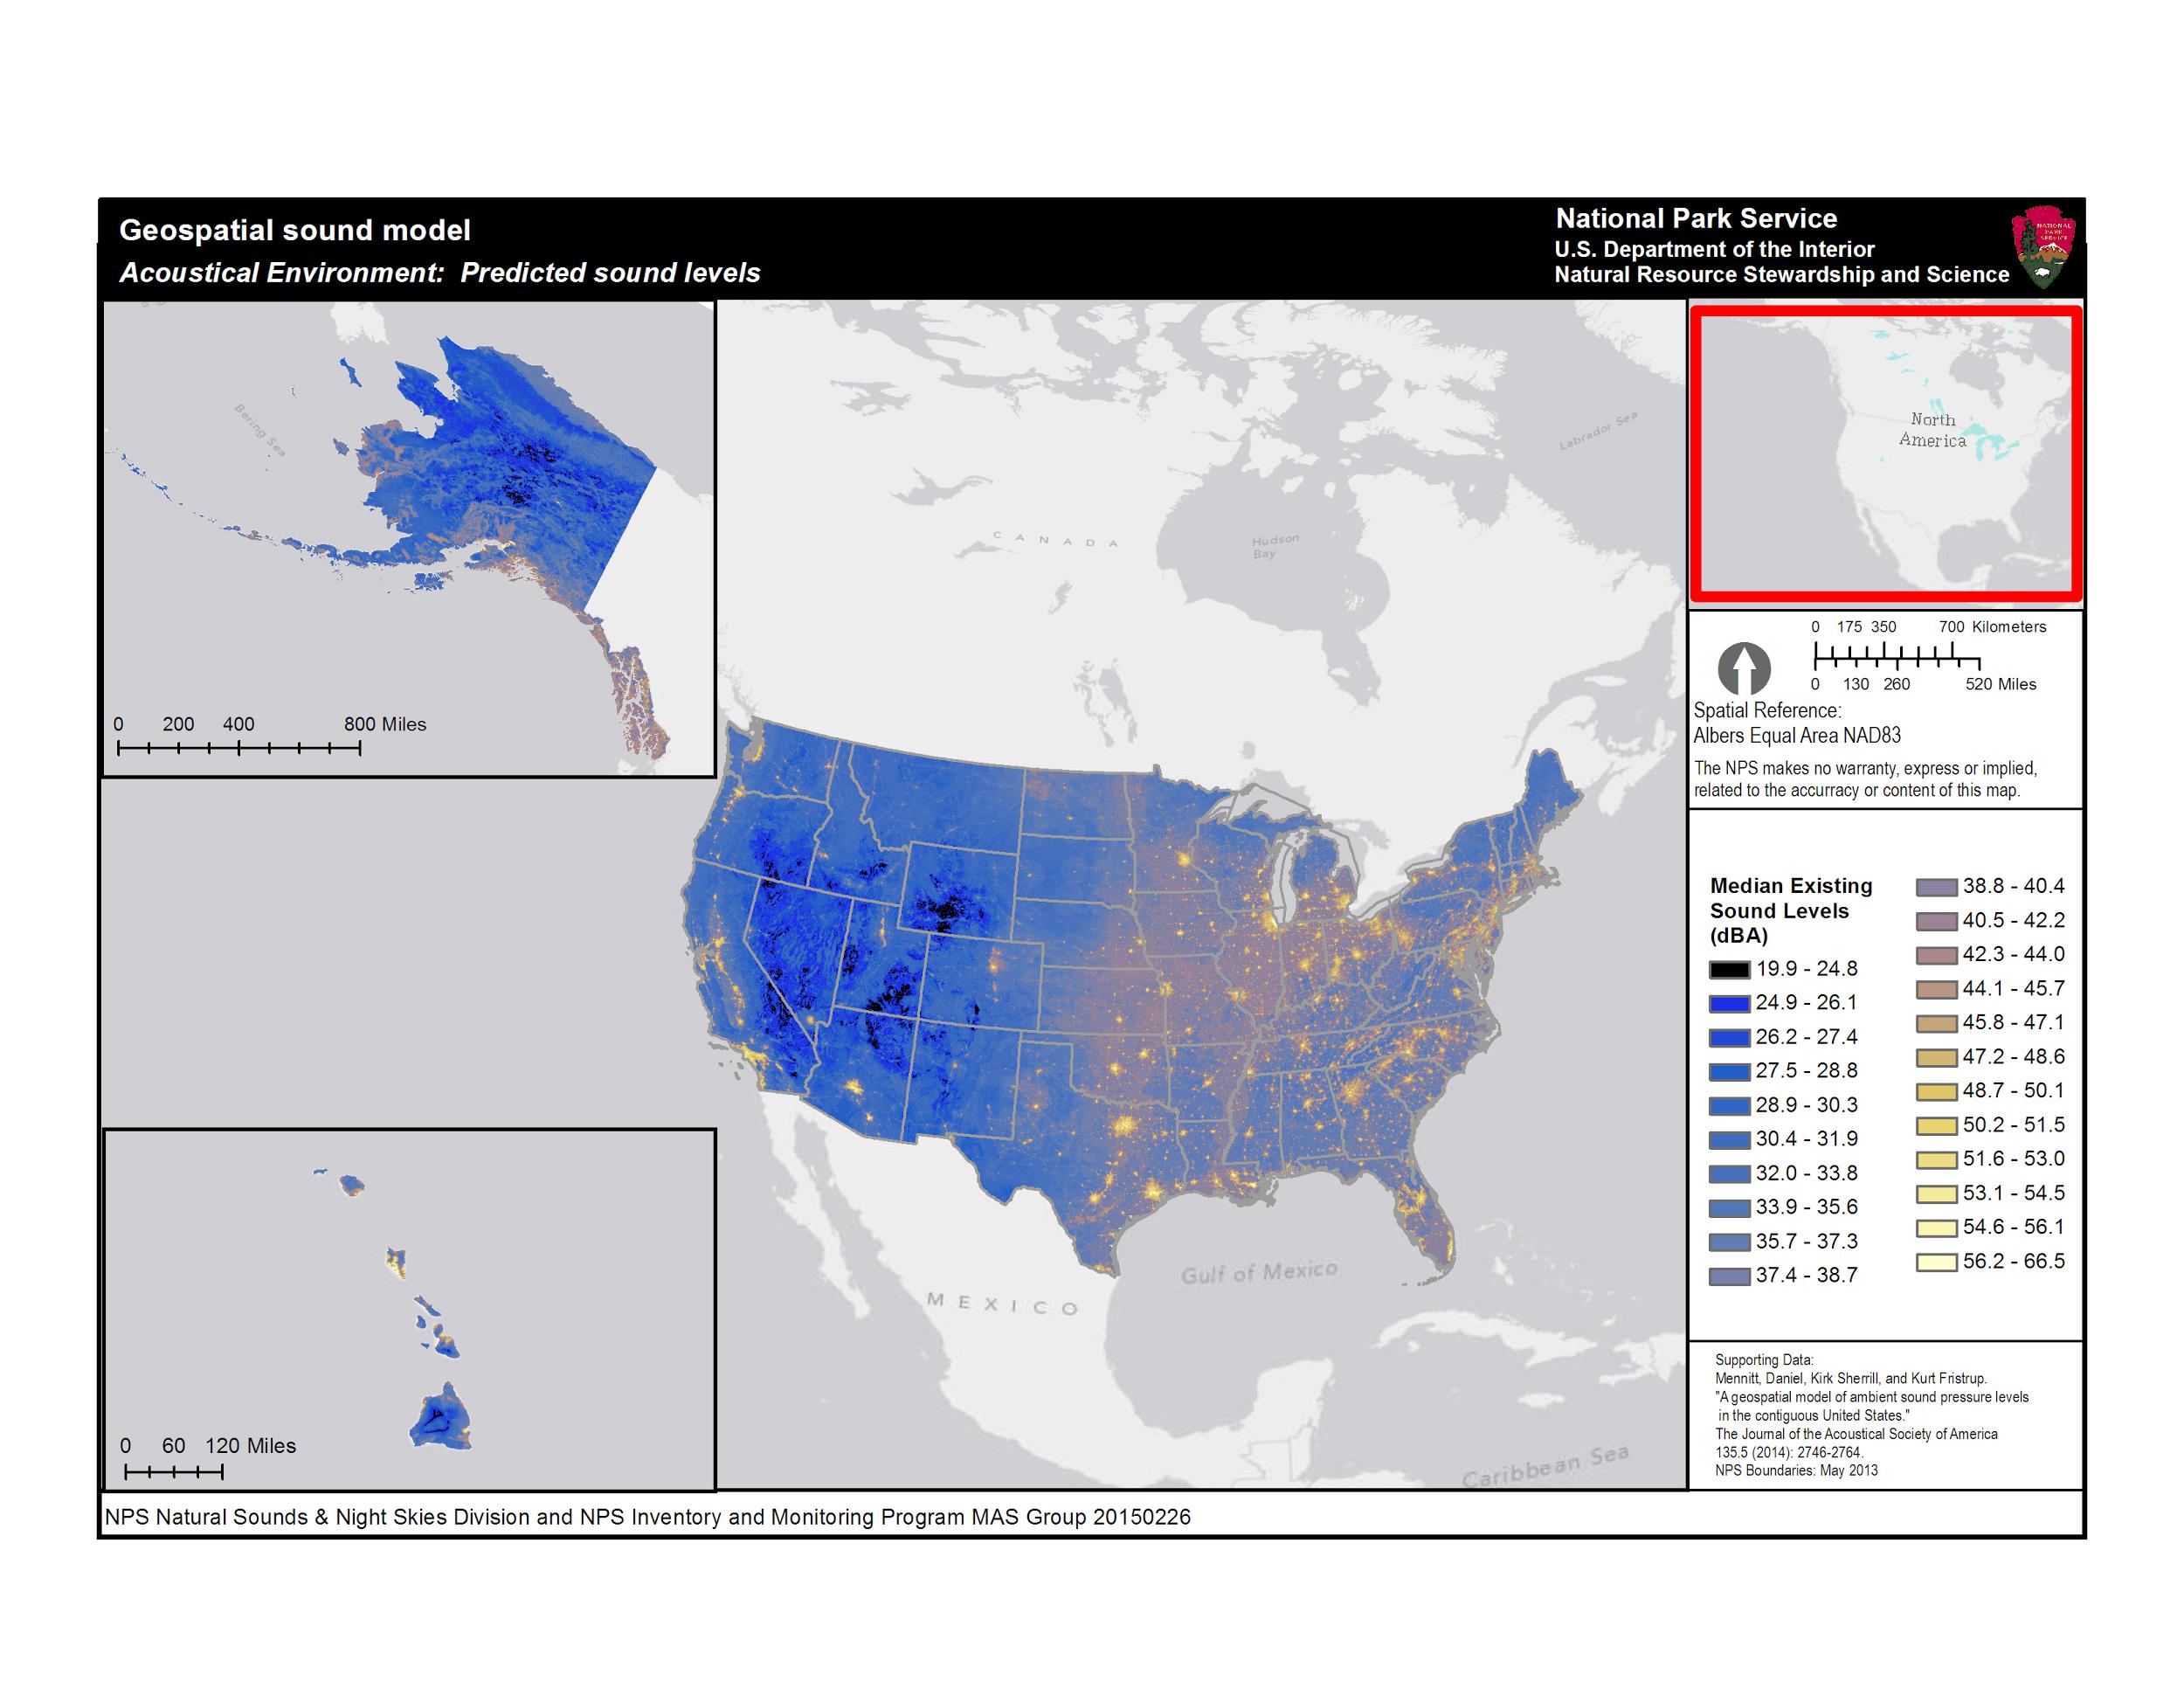
It predicts existing ambient sound level, which is the current condition including both human-caused and natural sounds (see Figure 8).
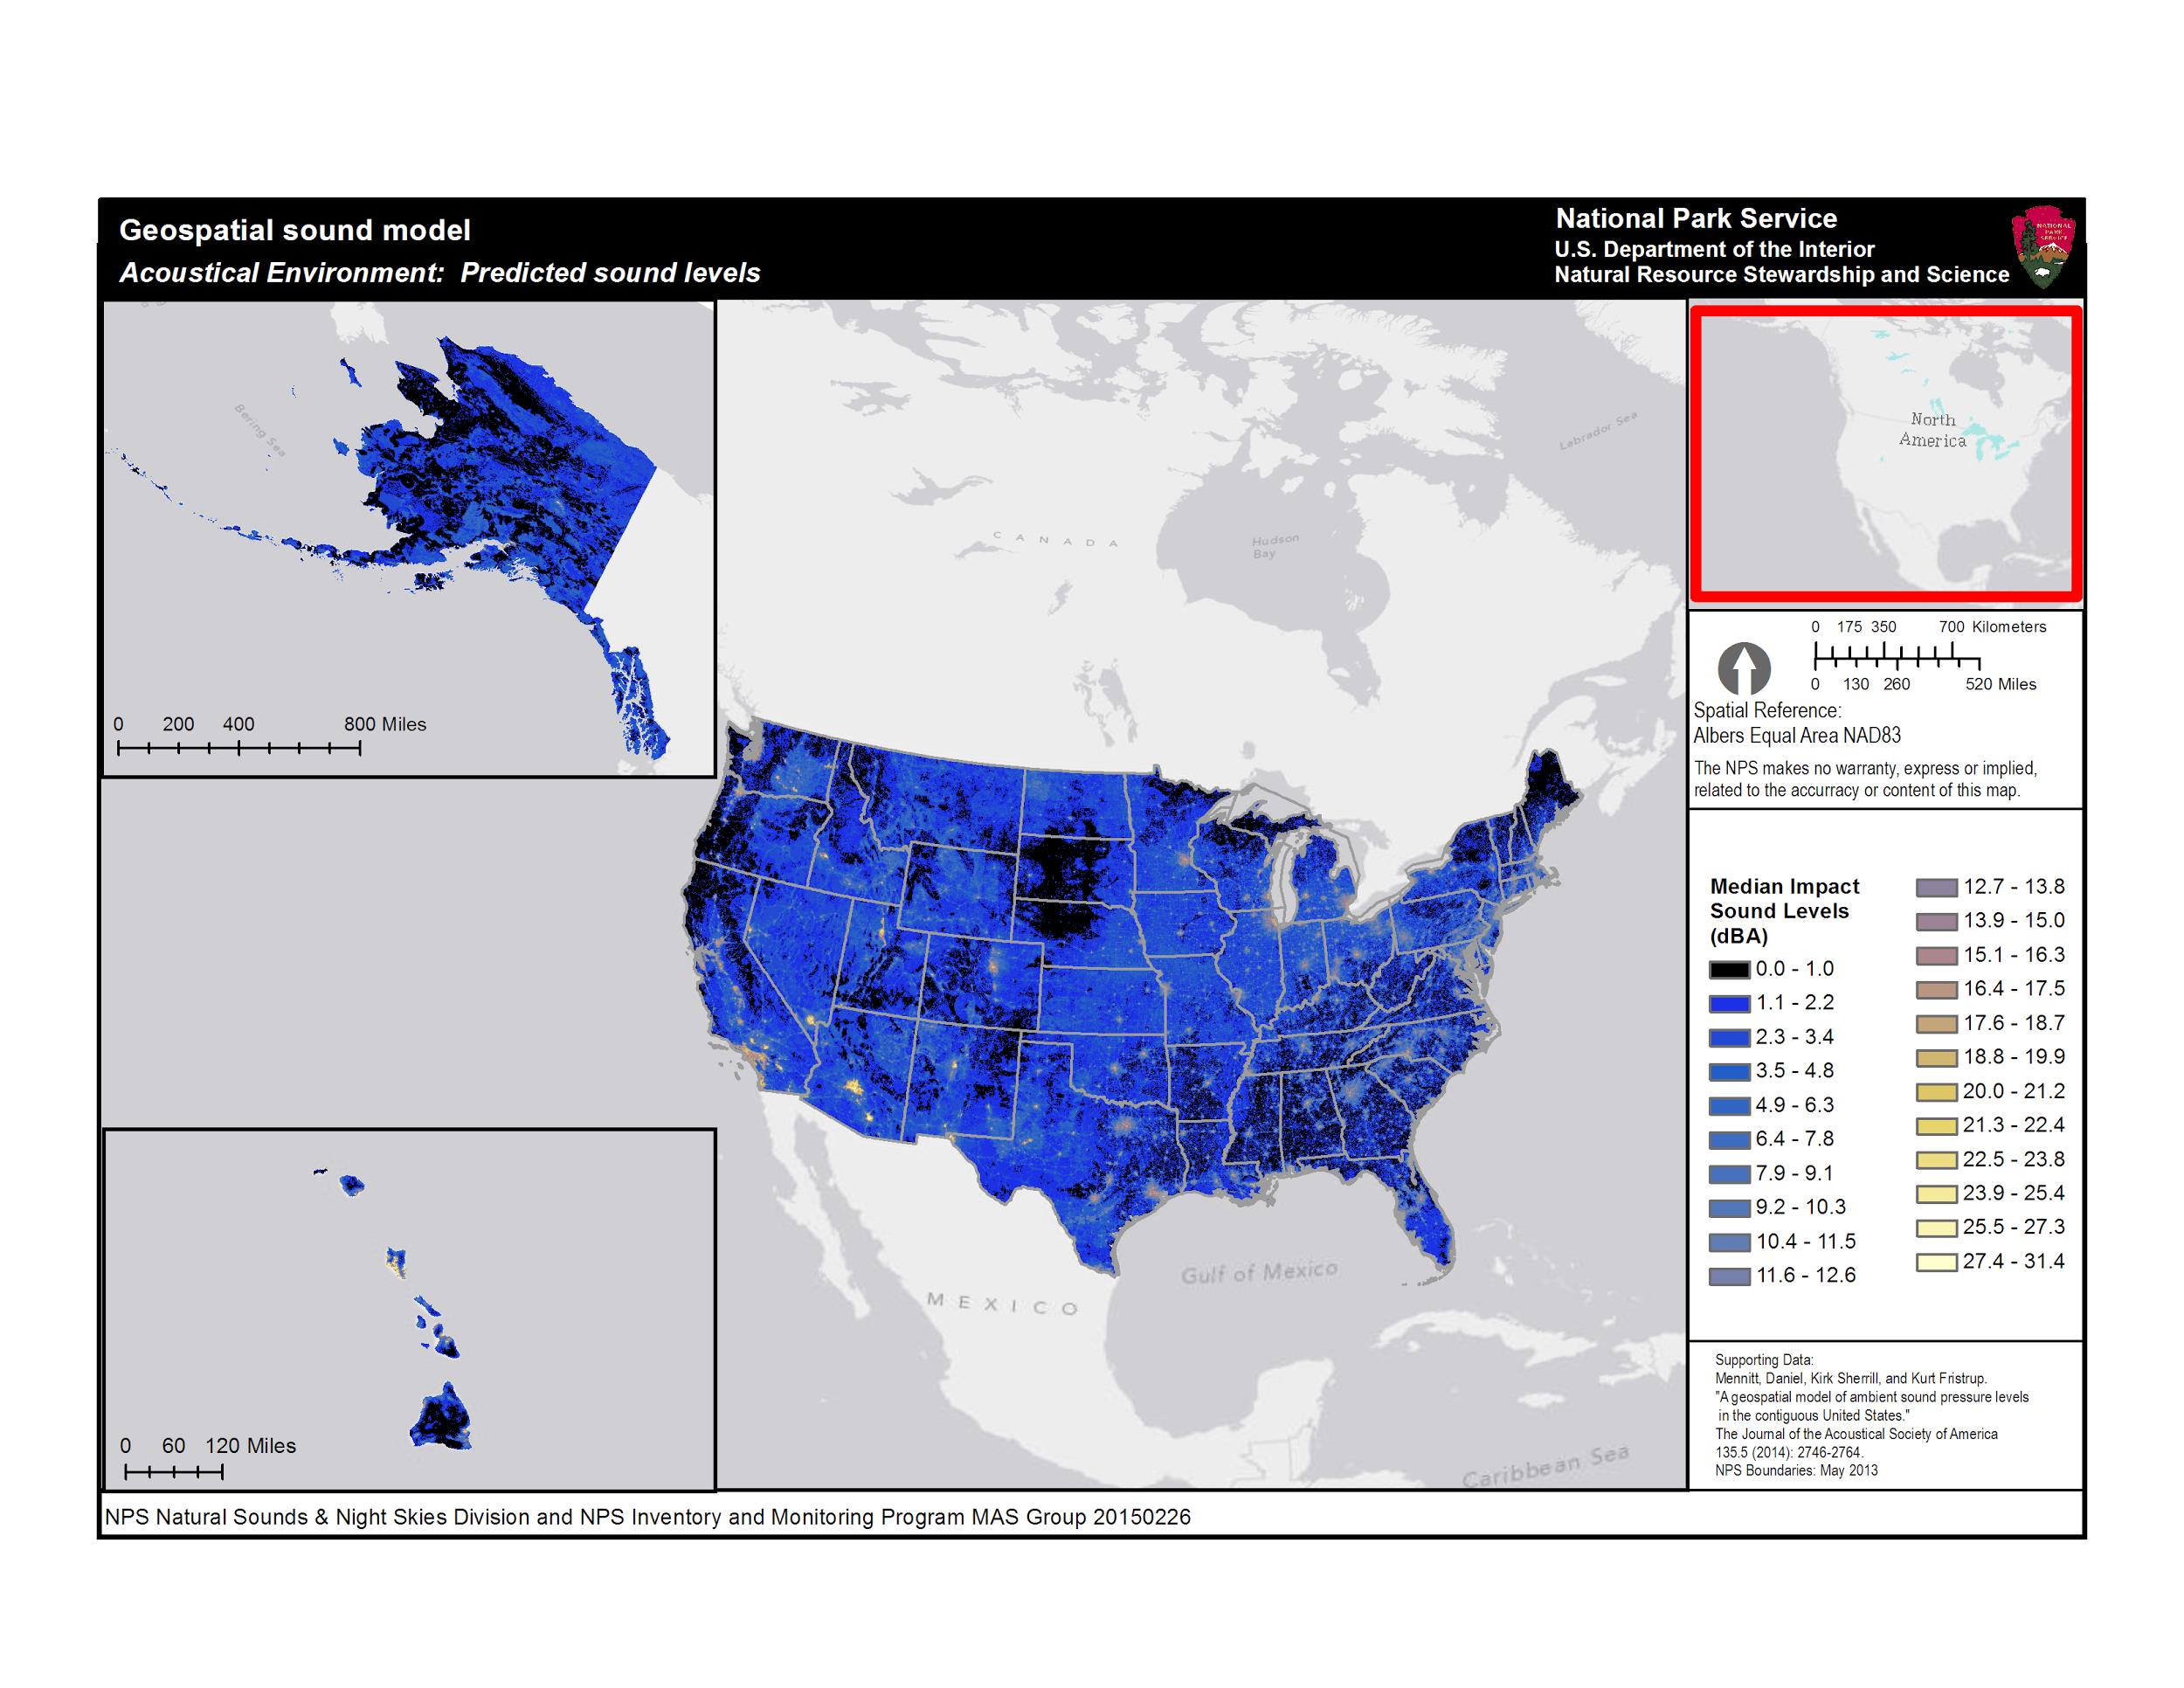
Each pixel on the maps in Figures 7 -10 represents a median sound level (LA50). The median sound level, or LA50, represents the level that is exceeded 50 percent of the time during a summer day at any given location.
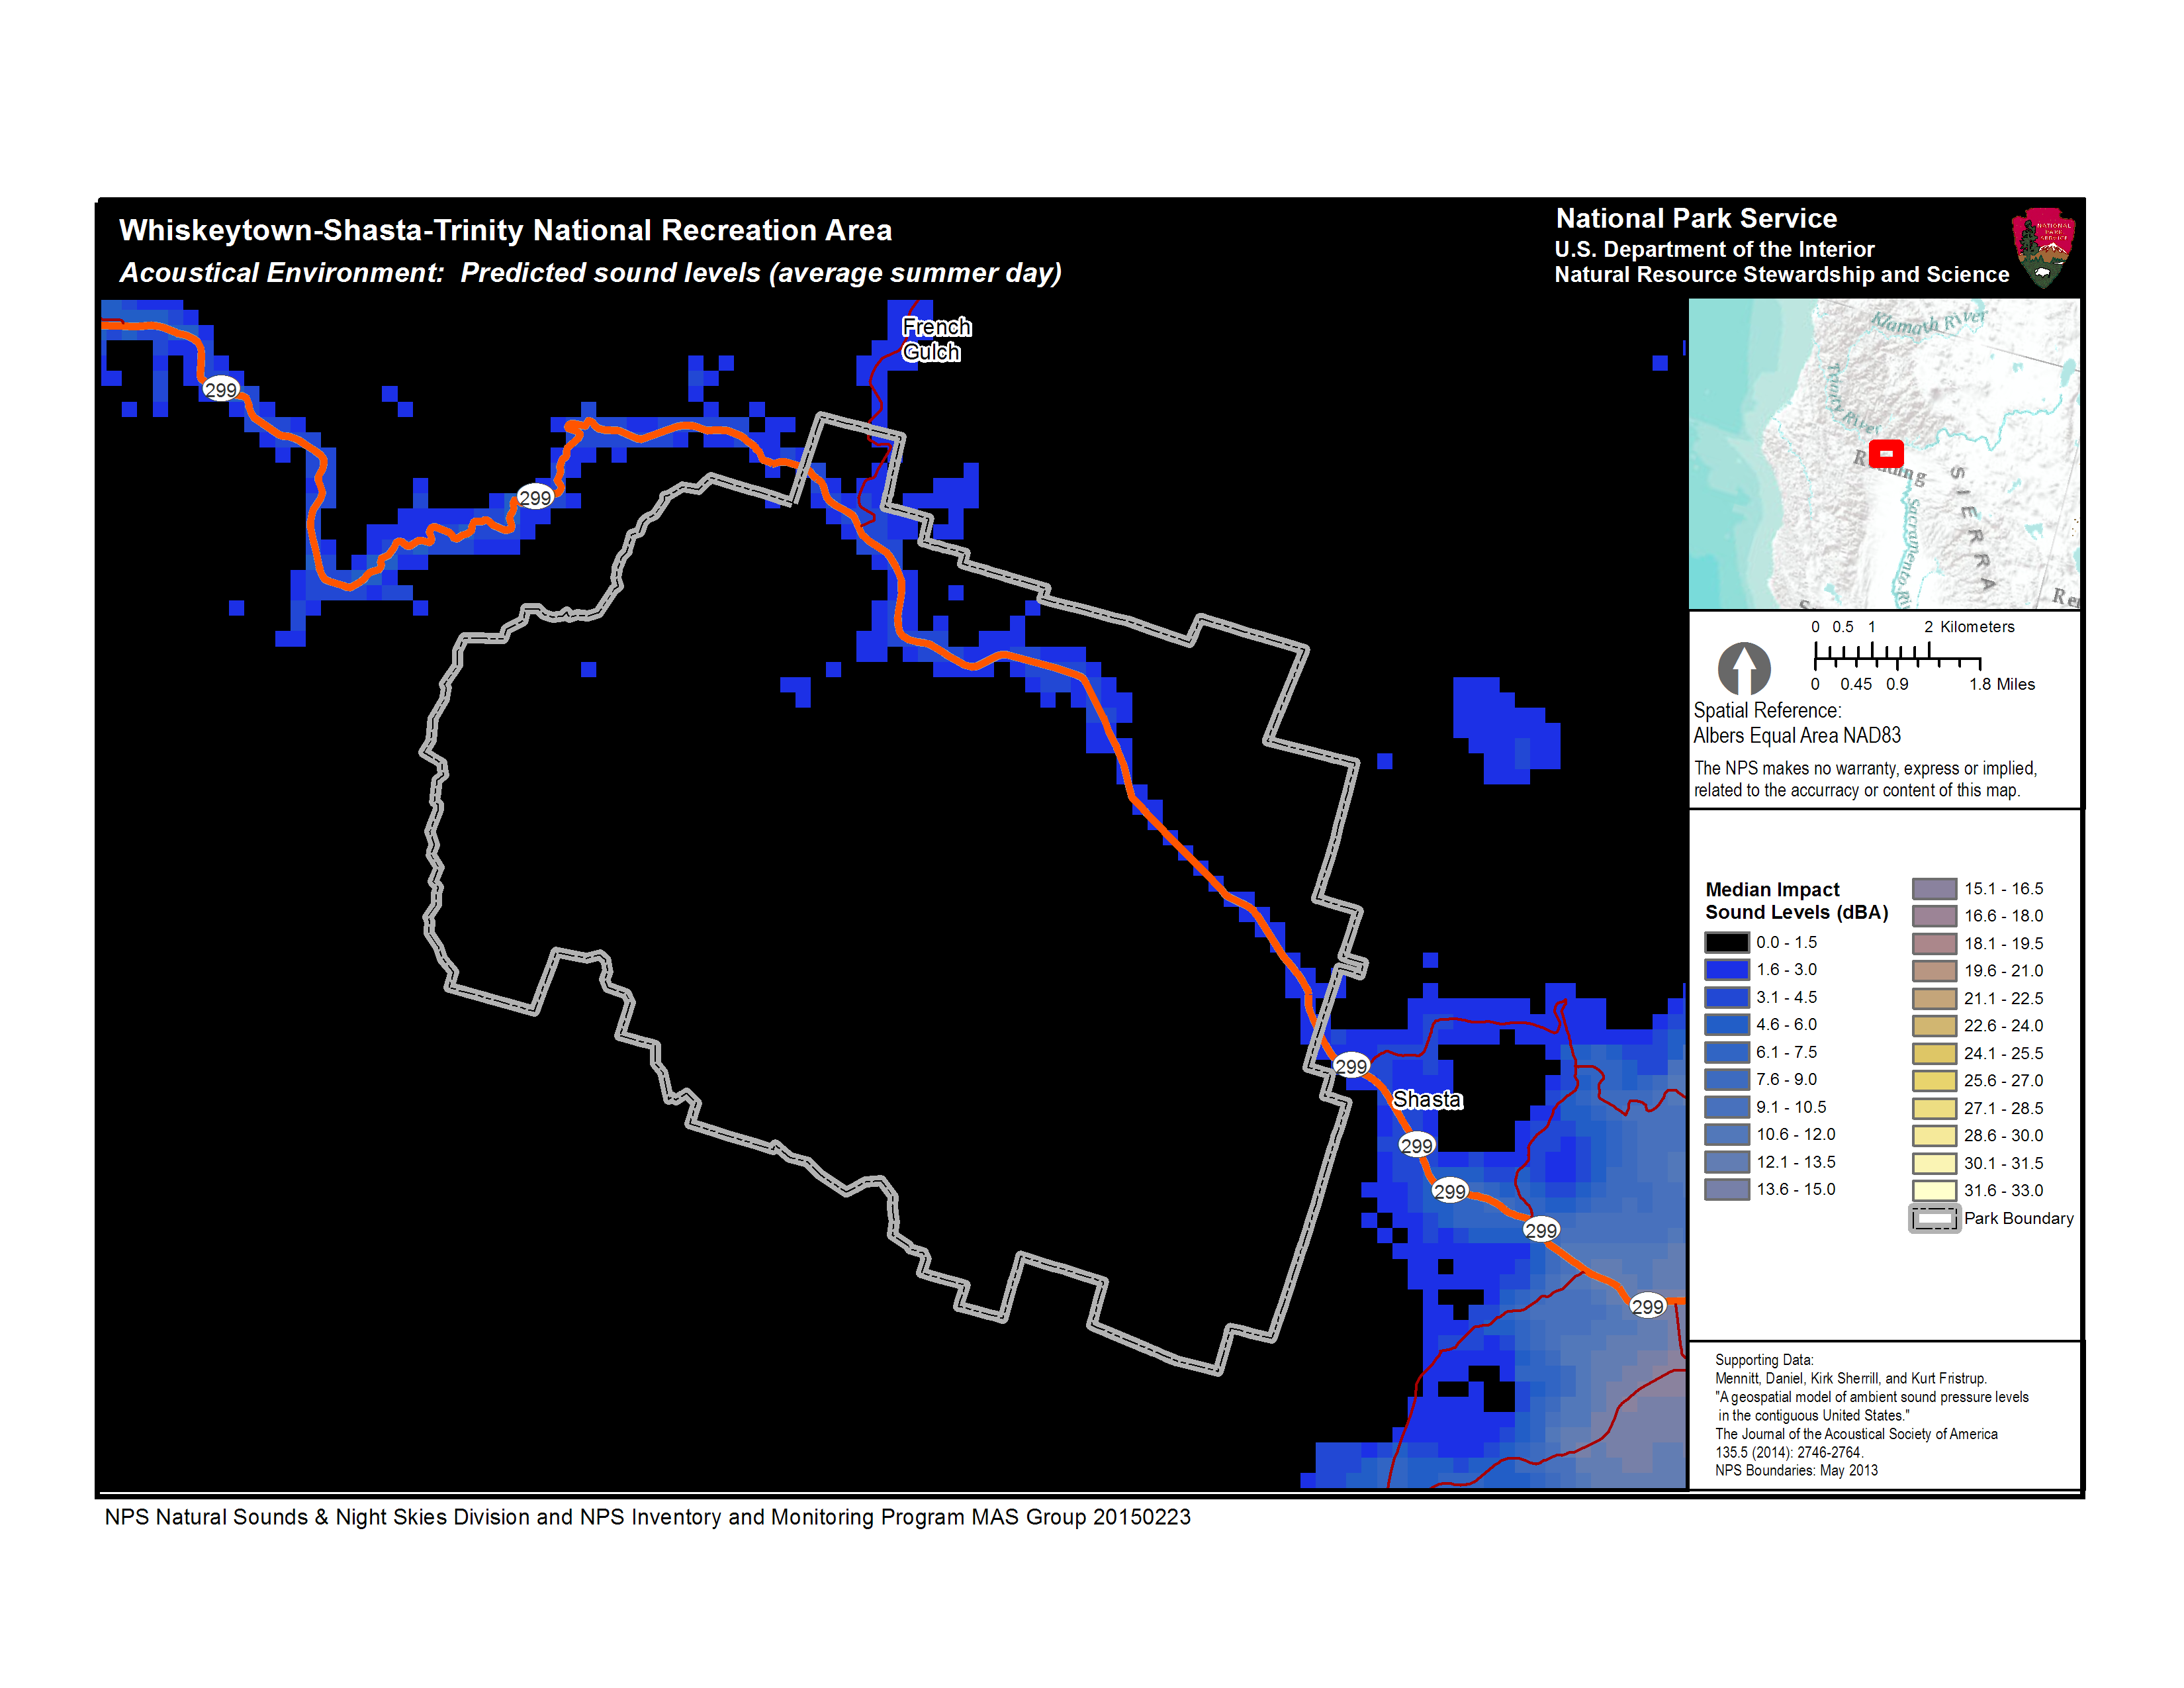
Figure 10 is a map showing how noise impacts (from human-caused sources) vary over the landscape of Whiskeytown-Shasta-Trinity National Recreation Area on an average summer day. The park boundary is outlined in gray. The color ramp indicates how much man-made noise increases the median A-weighted daytime summer sound level in decibels, with 270 meter resolution per pixel. Black or dark blue colors indicate low impacts while yellow or white colors indicate greater impacts. The majority of the park is predicted to have very low impact levels, with the exception of the road corridor, which is predicted to have higher impacts. In other words, human caused sources such as vehicles are predicted to contribute noise to these areas. The noise footprint of Redding, a moderately-sized city, is visible in the southeast corner of the map. Maps such as these offer a general sense of acoustic impact patterns, but the underlying data can also be queried to obtain a numeric measure of impact. This can be useful for monitoring or compliance applications.
Modeled results are currently available for all 50 states. As is the case with all models, the accuracy of predictions of the acoustical condition is dependent on the quality of available geospatial data layers. For example, if a seasonally closed road is missing from the national scale road layer; the acoustic effect of the road will be missing from the prediction.
Ambient sound pressure levels change with time, exhibiting cycles on daily, seasonal, and annual scales. Because a measurement of ambient sound pressure level is both a statistic and a long-term average, it is not necessarily in agreement with an individual's perception of a soundscape at any particular time. The L50 is the sound pressure level exceeded 50% of the hour and is relatively unaffected by transient events like sparse animal vocalizations and isolated military jet operations. Finally, because the expected condition is based on consistent trends, contemporary noise sources (e.g. road construction or a new flight route) that cannot be predicted are not included in the estimate.
NSNSD uses this model to estimate impact, inform other acoustic models, and guide mitigation activities. For better understanding of what this data means to your park, see Impact Assessment, Chapter 5. More information on the noise model can be found here.
2.5 Source Specific Monitoring
Acoustic data, associated metrics, and sound source information can also be used to identify the potential impacts of non-natural sounds, or specific noise sources. These sounds may be generated by proposed developments or actions that affect the acoustical environment. Using this approach, managers determine which sound sources are consistent with park resource objectives, and which are inappropriate in a park setting.
Specific information about a source of noise (e.g. a generator, wind turbine, vehicle, or watercraft) may be required in order to better understand the impacts of the noise, model noise propagation over the landscape, or determine the best mitigation strategies to pursue. Some examples of noise source information include: make, model, specifications, operating schedule, and location. Prior to initiating a noise measurement effort, it is a good idea to consult standards documents for the source in question, as well as local noise codes and applicable agency guidelines. Source-specific measurement standards are written by organizations such as ANSI (American National Standards Institute), ASA (Acoustical Society of America), ISO (International Organization for Standardization), IEC (International Electrotechnical Commission), SAE (Society of Automotive Engineers), ASHRAE (American Society of Heating, Refrigerating and Air Engineers), and ECMA (European Computer Manufacturers Association).
Park managers interested in conducting noise source measurements should contact the NSNSD office. These standards documents often dictate parameters like the distance at which measurements should be made, the desired operating conditions of the machinery in question, what noise metrics should be recorded, and how long measurements should be conducted. For more information on noise source measurement, reference Noise Source Measurement Protocol [PDF].
RM-47 Home
Next Chapter: 3 Characterizing the Acoustic Environment
Appendix A: Glossary
Appendix B: Authorities
Last updated: November 19, 2021