Why is the National Park Service concerned about noise?
Park visitors and wildlife interact with each other and park resources through their senses, including the sense of hearing. So, protection of natural sounds supports both ecosystems and quality visitor experiences. Additionally, there are laws and policies that require the agency to conserve acoustic environments "unimpaired for the enjoyment of future generations."
How does the sound map work?
Scientists made long term measurements of sound in parks as well as urban and rural areas across the country. This information helped predict current sound levels for the entire United States. A model was developed to understand relationships between measured sound levels and variables such as climate, topography, human activity, time of day, and day of year. The resulting geospatial sound model can also estimate how places would sound naturally, without human influence.
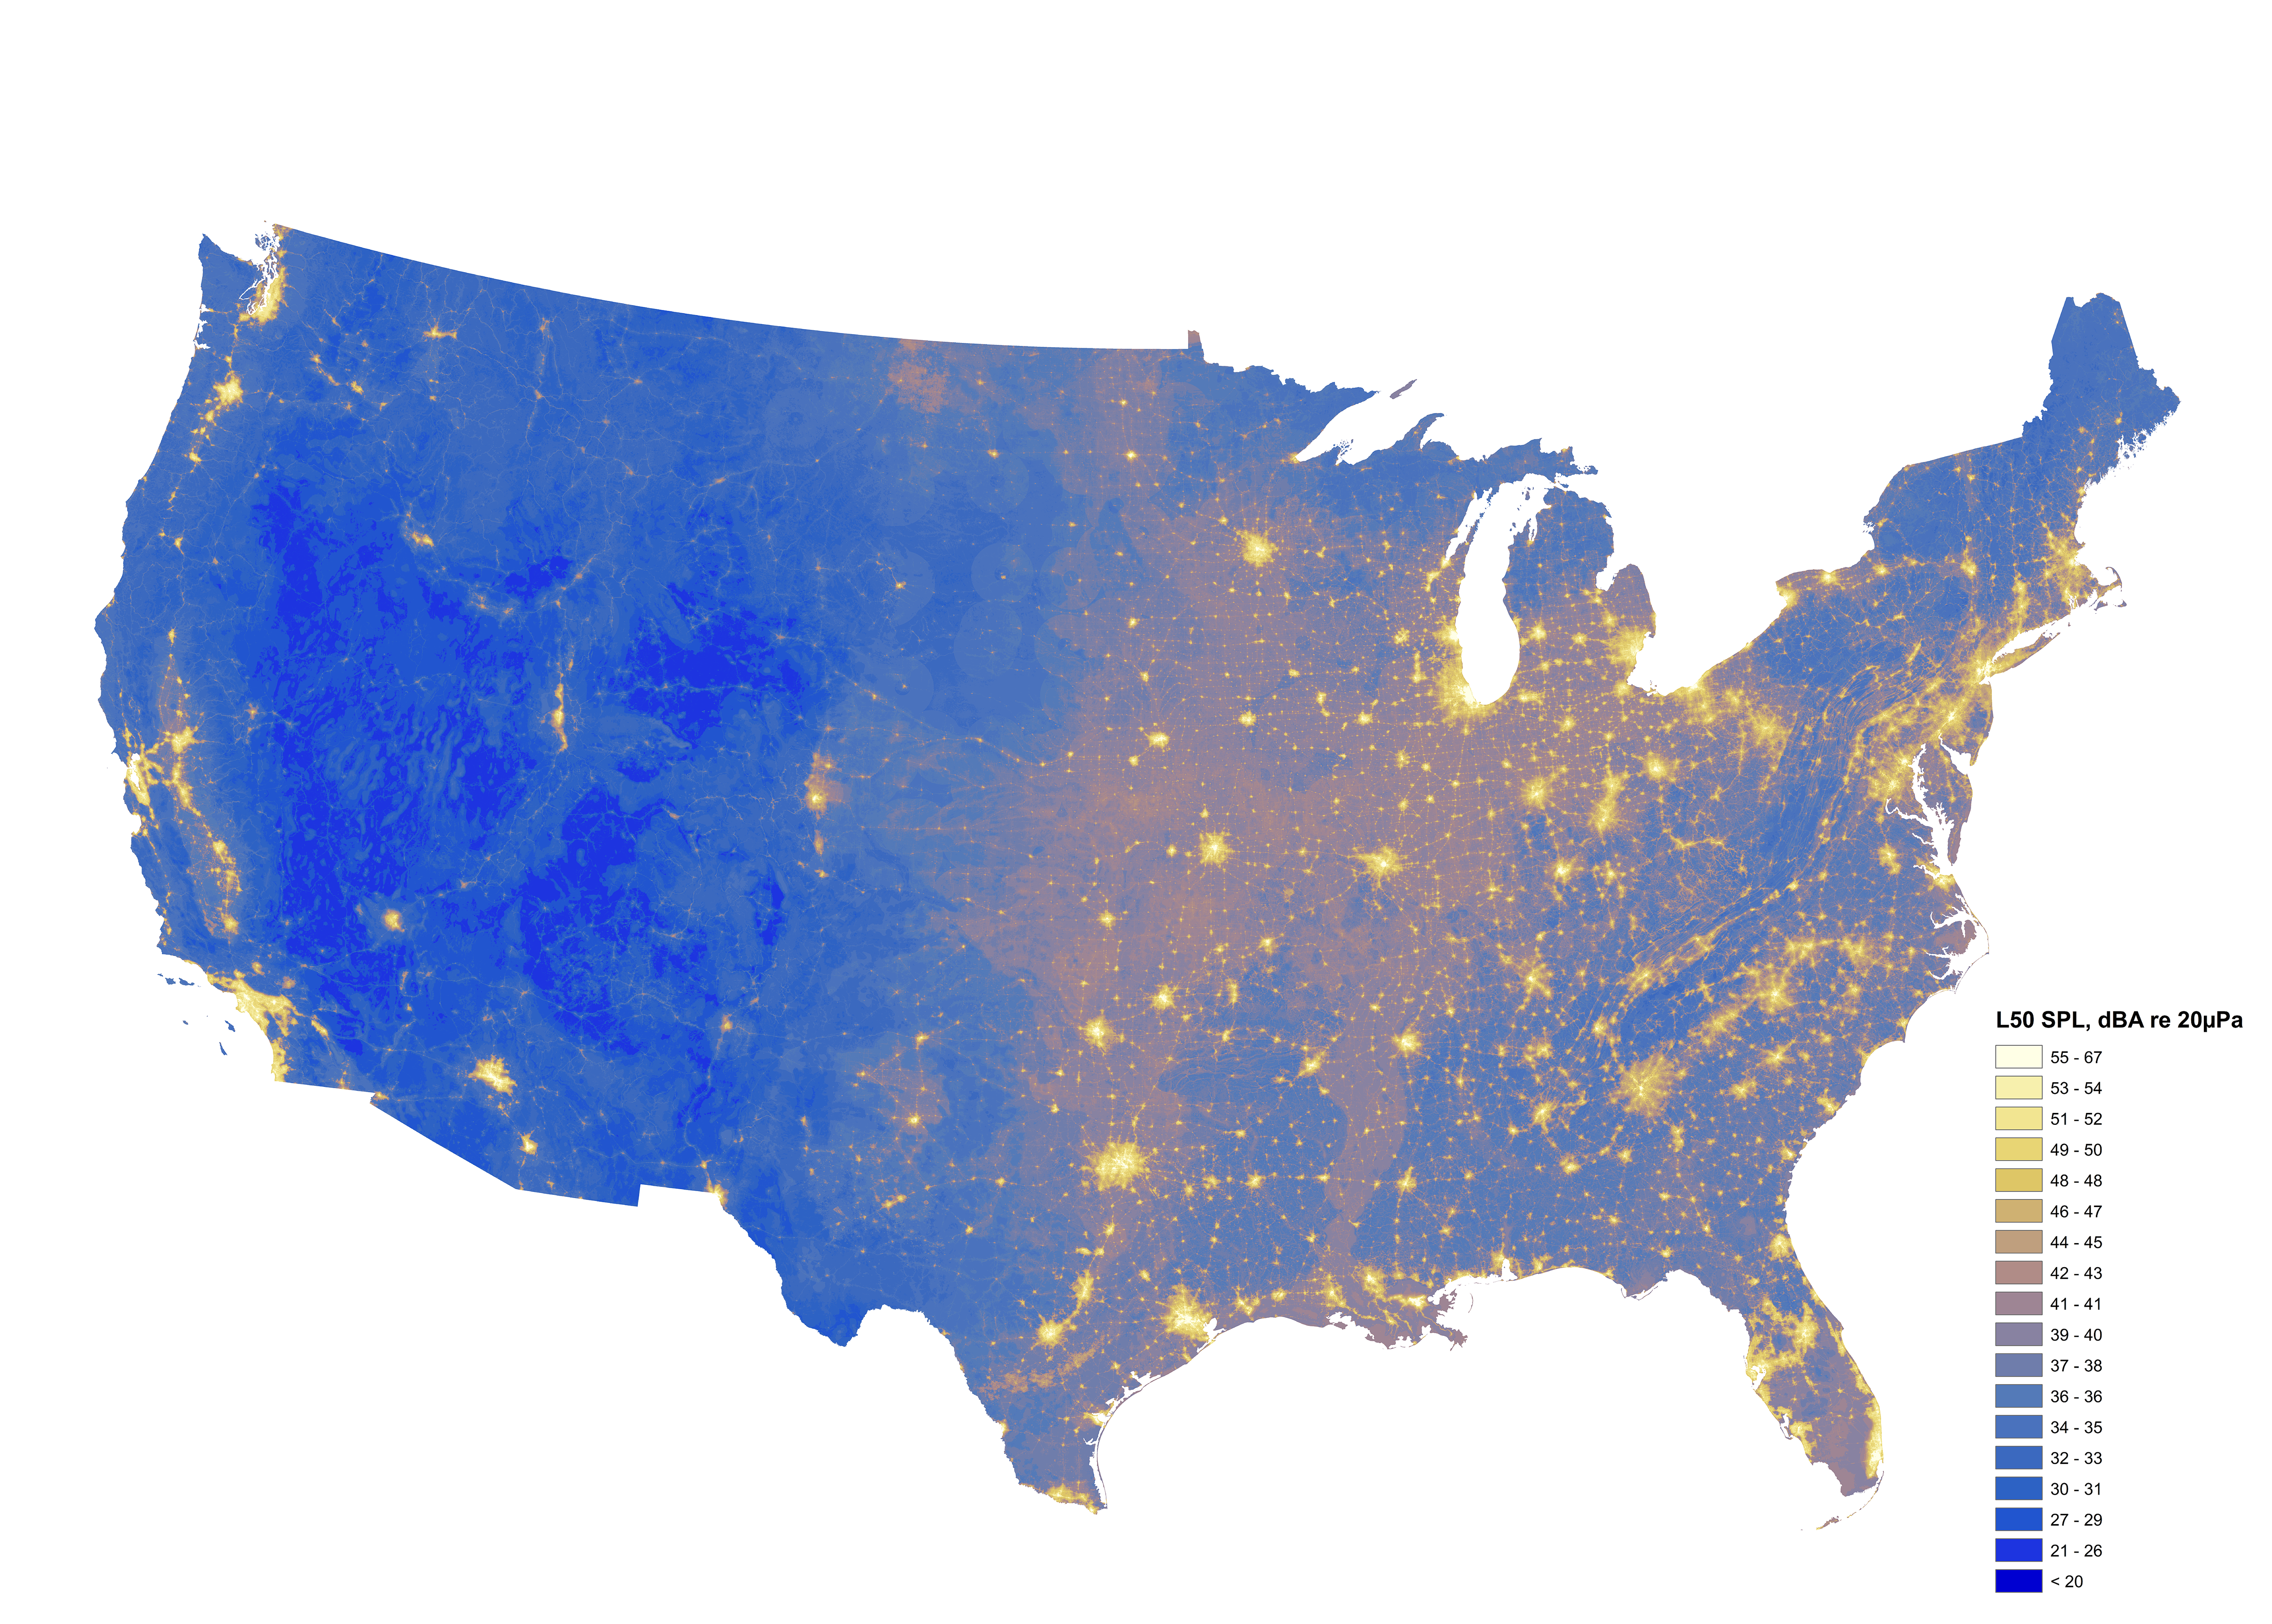
Map of existing conditions:

Download a high resolution version of the existing conditions map (png 12 MB).
The underlying resolution of these maps is a 270 meter grid. Most image software will allow you to zoom in to look at specific regions or cities in greater detail.
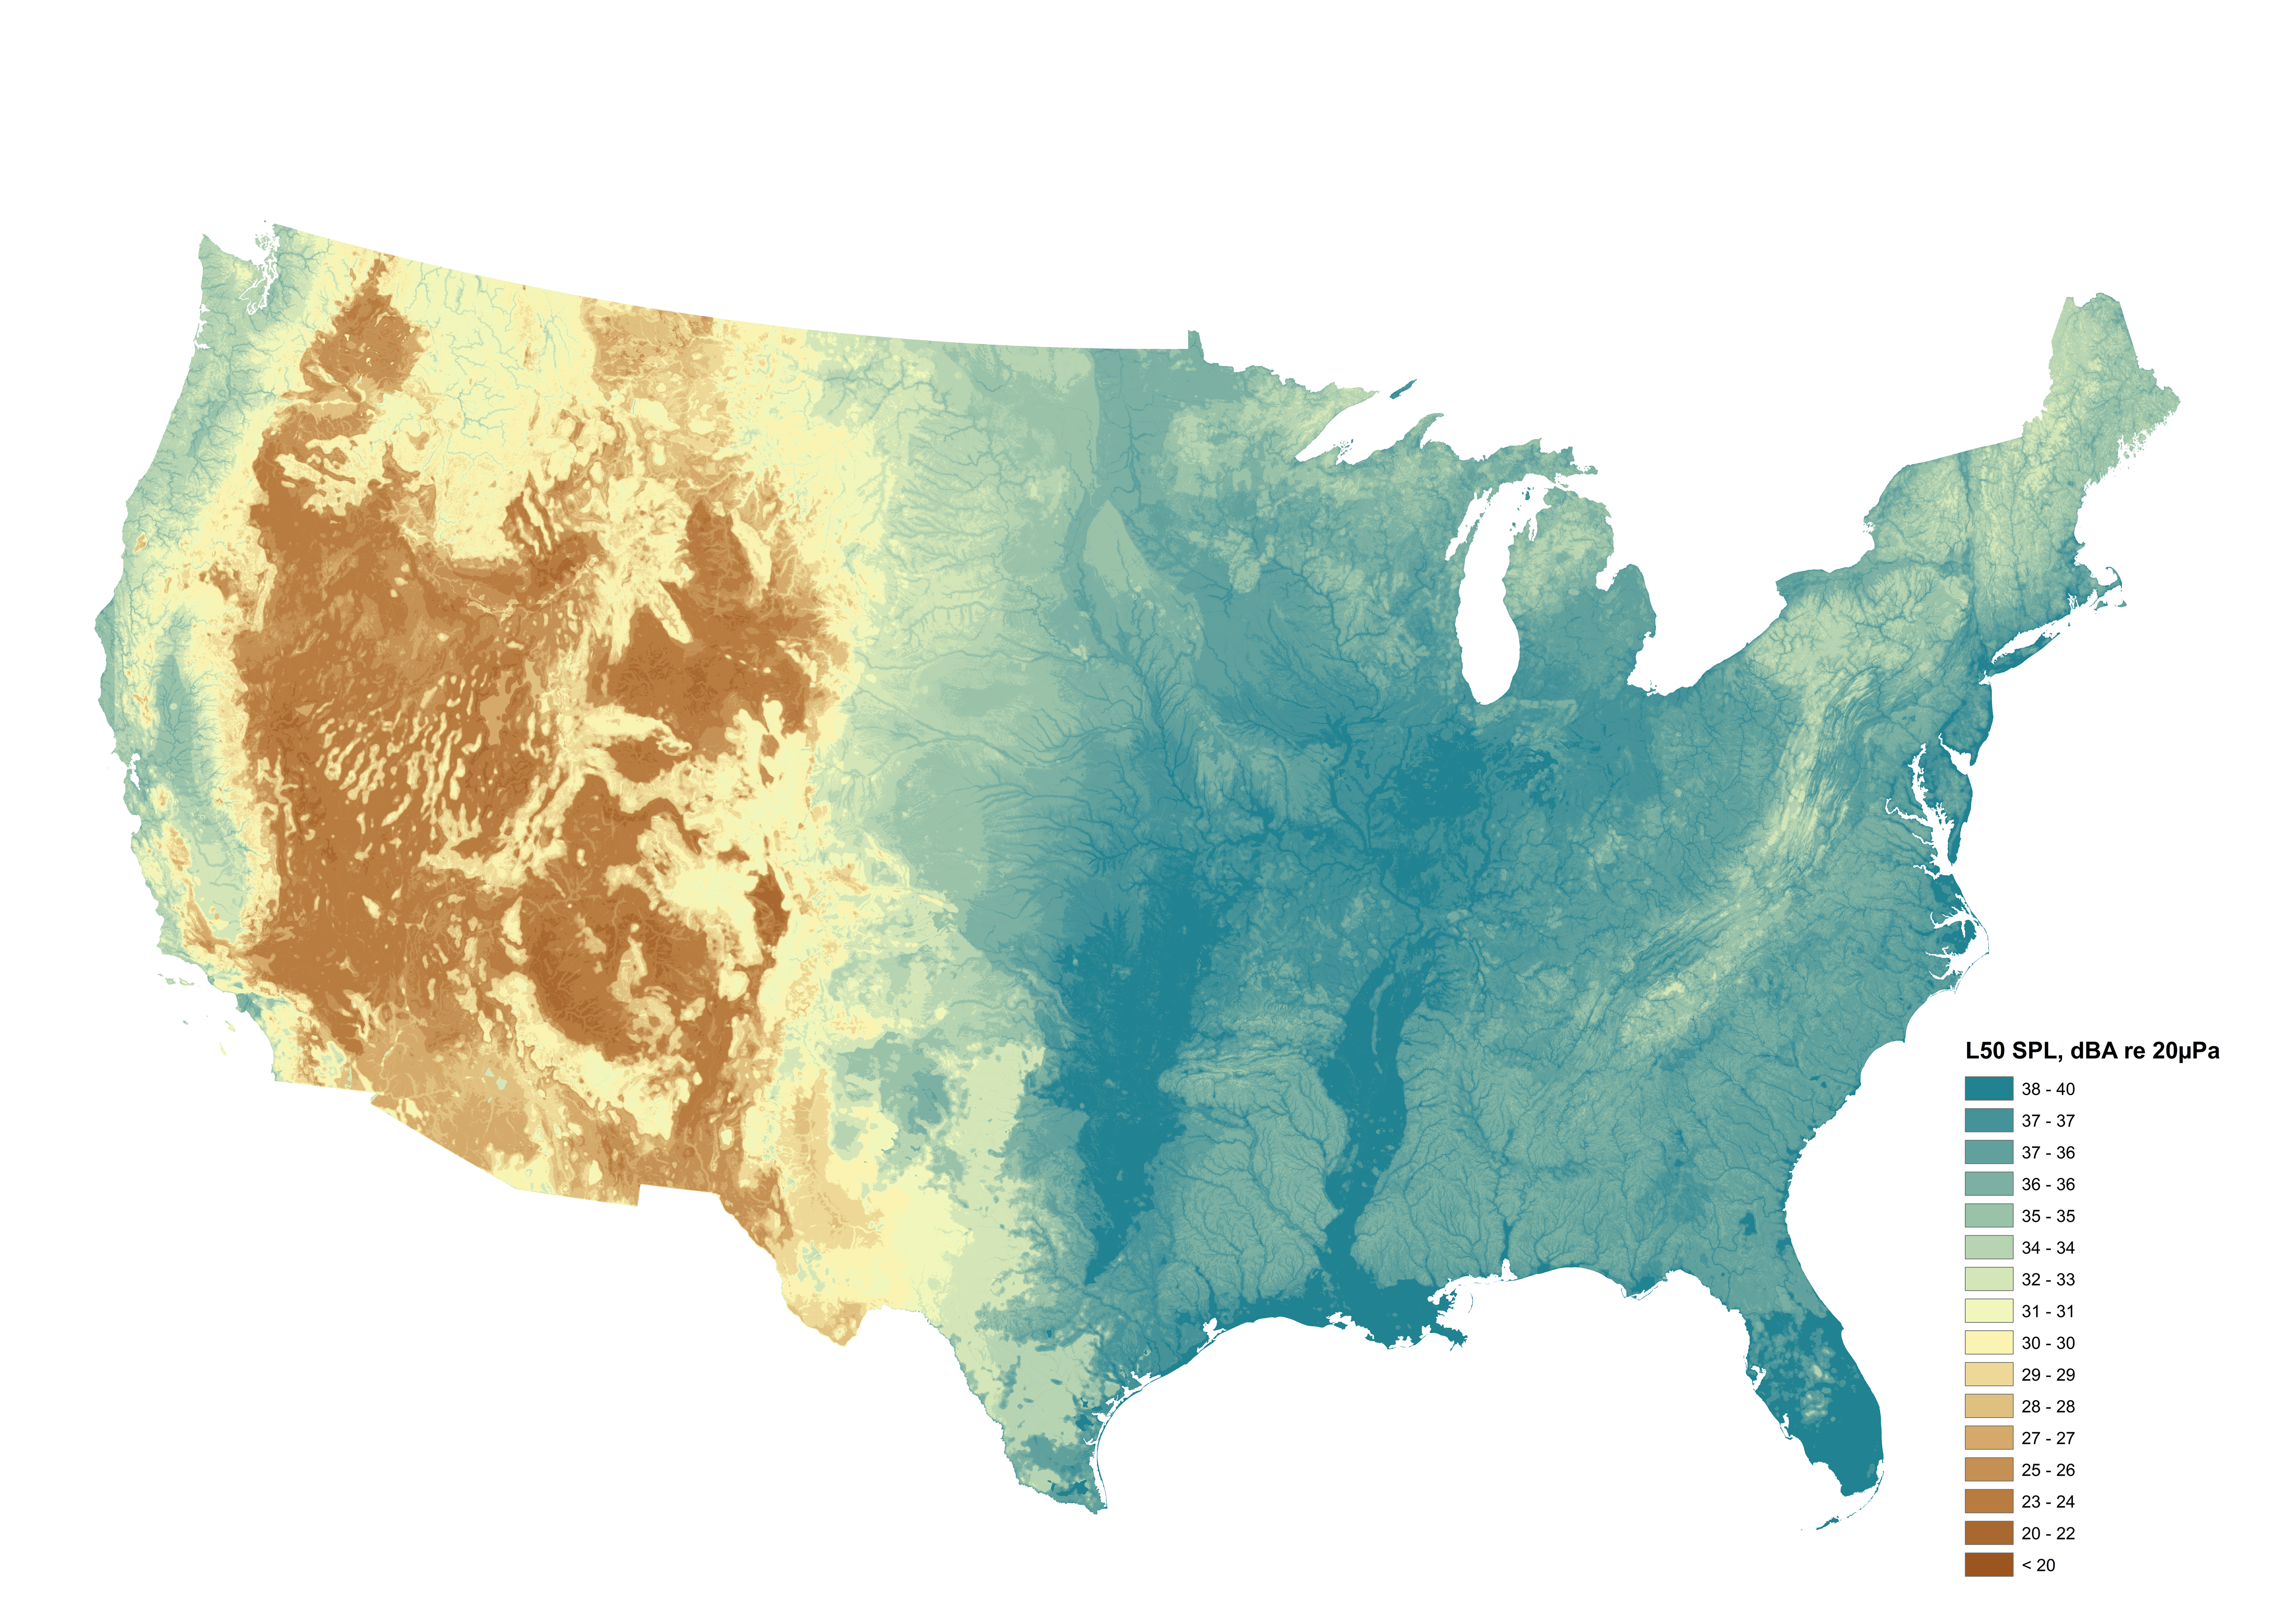
Map of natural conditions:

Download a high resolution version of the natural conditions map (png 13 MB).
Note that the numbers on the legend are different than in the first map, because it is so much quieter. The trend is higher sound levels in wetter areas with more vegetation. This is due to the sounds of wind blowing through vegetation, flowing water, and more animals (especially birds and frogs) vocalizing in more fertile locations.
Visit our keyboard shortcuts docs for details
- Duration:
- 2 minutes, 54 seconds
The Natural Sounds and Night Skies Division (NSNSD) receives numerous requests from parks annually to measure soundscape conditions. The data collected is used to understand resource conditions and make management decisions. However, samples are only representative of the days and places the data was collected. Also, it is not feasible for NSNSD to collect samples at all park sites within a reasonable time. Therefore, NSNSD created a geospatial model that predicts soundscapes in parks across the nation.
More Information
Check out our Frequently Asked Questions to learn more about the sound maps.
Geospatial sound modeling data is freely available. Download it here, and please give appropriate credit.
To learn more about how the National Park Service protects natural sounds and night skies in parks, please visit the Natural Sounds and Night Skies Division home page.
Last updated: March 23, 2021