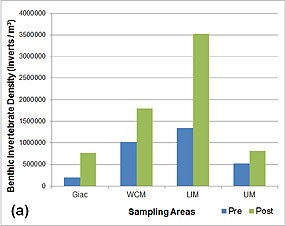
In strong contrast to the zooplankton communities, benthic invertebrates communities showed a much stronger distinction between the unrestored dairy and natural marshes for both total densities of organisms and species assemblages. Prior to the restoration, the drainage ditches and creeks on the dairy ranch had dramatically lower benthic invertebrate density levels than all of the natural marshes (Giac: 197,200 inverts/m3; WCM: 1,020,000 inverts/m3, LIM: 1,342,000 inverts/m3, UM: 527,800 inverts/m3; Figure 4 [25 KB PDF]). In addition, pre-restoration Project Areas strongly separated from those of the Reference Areas or Natural Marshes on the basis of species composition in graphical statistical analyses. 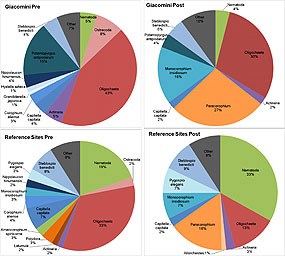
The species assemblage of Giacomini Wetlands pre-restoration was made up primarily of Oligochaeta (43% of all species) and the non-native New Zealand mudsnail, Potamopyrgus antipodarum (Gastropoda; 15% of all species; Figure 5 [144 KB PDF]). P. antipodarum prefers low-salinity environments (Jacobsen and Forbes 1997), so it is not surprising that it thrived in Giacomini Wetlands before the levees were breached. It is also an invasive species of serious concern and has been linked to decreases in native macroinvertebrate densities, leading to a lack of nutritional content in streams for the native insects and fish (Kerans et al 2005, Vinson and Baker 2008). Other statistical analyses indicated that abundance of Chironomids might be a factor that weakly distinguished the unrestored dairy ranch from natural marshes, and Chironomids have been used as a pollution indicator due to the taxa's strong tolerance of acidity, organic pollutants, and sewage inflows (Rae 1989, Armitage et al. 1995). Pre-restoration, the most common taxonomic groups at the Reference Areas were Oligochaeta (33%), Nematoda (19%), Streblospio benedicti (Polychaeta) (8%) and Capitella capitata (Polychaeta; 7%; Figure 5 [144 KB PDF]). Indicator Species Analysis found nine of the 52 taxa to be significant indicators of the Reference Areas, pre-restoration. Of these, the best indicators for the Reference Areas were C. capitata, Grandiderella japonica (Amphipoda), S. benedicti, Monocorophium insidiosum (Amphipoda), Pseudopolydora kempi (Polychaeta), and Gemma gemma (Bivalvia) (all p < 0.001). G. gemma, G. japonica, M. insidiosum, and P. kempi are invasive species on the California coast (GISD), and S. benedicti is native to the East Coast. However, C. capitata, G. japonica, S. benedicti, and P. kempi are all pollution tolerant species (SFEI 1999), so it is somewhat unexpected to see them as indicators of the Reference Areas. S. benedicti and Capitella sp, in particular, are well-known opportunistic invertebrates with high tolerances for organic pollutants (Bridges et al 1994). Ironically, some of the pre-restoration dominants in natural marshes were some of the same species that have often been documented in large numbers immediately after restoration in other tidal marsh systems. These species are opportunistic invaders that take advantage of the "disturbance" of restoration to become the dominant fauna. Included in this group is S. benedicti; C. capitata; and turbellarians (Levin et al. 1996, Alpin and Posey 2000, Zajac and Whitlatch 2001, Havens et al. 2002, Moseman et al. 2004). After four years, dominance by some of these early colonists diminished in many restored marshes (Levin et al. 1996), although, at some South and North Carolina marshes, other species colonized, but did not totally replace these early colonists (Alphin and Posey 2000). Some studies have found the abundance of particular orders of invertebrates such as polychaetes, which includes S. benedicti, C. capitata, and other species, to be higher in restored marshes than in natural marshes, possibly because other orders such as oligochaetes have a limited dispersal stage (Levin et al. 1996). However, in other systems, higher numbers of S. benedicti, C. capitata, and other polychaetes were found in natural marshes than transplanted marshes, although polychaete densities did increase with age of the restored marsh (Minello and Zimmerman 1997). The presence of polychaetes has some importance for food chain support, as polychaetes are more accessible as prey for marsh predators (Minello and Zimmerman 1997), Other orders may have important indicator status, as well. Rather than polychaetes being the differentiating factor between restored and natural marshes, Minello and Zimmerman (1997) found that amphipods were generally much lower in created than natural marshes. 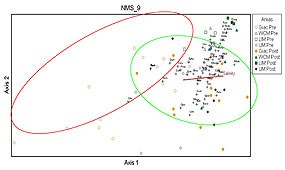
After restoration, the three most common taxonomic groups in the restored dairy ranch were Oligochaeta (30%), non-native Paracorophium (Amphipoda; 27%), and non-native M. insidiosum (Amphipoda; 16%; Figure 5 [144 KB PDF]). In the natural marshes, the most common taxonomic groups were Nematoda (33%) and Paracorophium (16%), with Oligochaeta, S. benedicti (Polychaete), non-native Pygospio elegans (Polychaete), and M. insidiosum representing an additional 36% of the species present (Figure 5 [144 KB PDF]). It is interesting to note that, post-restoration, the three most common taxa in Giacomini were also in the top six most common taxa of the natural marshes. There were also fewer species post-restoration that statistical analyses found that would discriminate between the restored dairy ranch and natural marshes, which suggests convergence between these communities. These results are supported by graphical statistical analyses that show strong overlap between the dairy ranch and natural marsh sites after restoration (Figure 6 [55 KB PDF]). In terms of differences, the native amphipod Eogammarus confervicolus appeared to be present in much higher numbers in post-restoration Giacomini than natural marshes. Conversely, Reference Areas still had higher numbers of G. gemma, S. benedicti, and Allorchestes, than the restored dairy ranch. 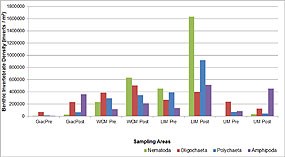
At least in the first two years, the restored wetlands did not support large abundances of the opportunistic polychaetes that have been observed in other restored systems, such as S. benedicti and C. capitata, even though they were present in both Giacomini and the Reference Areas. In general, polychaetes--which, in general, have been associated with newly restored systems--comprised very little of the invertebrate assemblage at Giacomini and the adjacent Undiked Marsh either pre- or post-restoration, with oligochaetes being more predominant both pre-and post-restoration at Giacomini and the Undiked Marsh. Polychaetes accounted for more of the benthic invertebrate community at Limantour Marsh and Walker Creek Marsh both pre- and post-restoration, although, in general, nematodes were numerically dominant (Figure 7 [27 KB PDF]). Some researchers believe that amphipod abundance is a more sensitive indicator of the restoration or recovery status of a marsh, as amphipods are typically pollution intolerant species. The abundance of amphipods jumped dramatically at Giacomini post-restoration (364,000 inverts/m3), as well as in the Undiked Marsh downstream of Giacomini (452,000 inverts/m3), with Amphipoda being the numerically dominant taxonomic order in these systems (Figure 7 [27 KB PDF]). In addition, amphipod abundance also increased at Limantour Marsh (518,000 inverts/m3) and, to a lesser degree, Walker Creek Marsh, although amphipods were not nearly as numerous as other taxonomic orders. In addition to changes in species, densities of invertebrates in the restored wetlands jumped dramatically following restoration. Giacomini Wetlands had the largest percentage increase in invertebrate density of any of the Study Areas post-restoration, with a 389% increase (Figure 4 [25 KB PDF]). However, the restored dairy ranch was not the only Study Area to change with time. Actually, all of the natural marshes also showed striking increases in total invertebrate density between pre- and post-restoration periods. After restoration occurred, benthic invertebrate densities in Giacomini differed from a statistical standpoint only from Limantour Marsh. Invertebrates at Limantour Marsh increased in total density by 262%, giving this marsh the highest density of any natural marsh sampled. Walker Creek Marsh and the Undiked Marsh had lower percentage increases of 176% and 155%, respectively. Invertebrate densities at Limantour Marsh were more than 200% that of any other Study Area. The increases in Giacomini and Limantour may at least partly result from restoration. A restoration project was conducted upstream of Limantour Marsh in 2008. 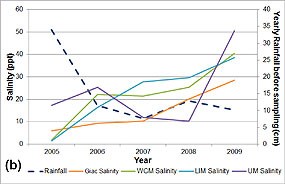
However, the fact that invertebrate densities have climbed annually at all marshes, not just the restored ones, suggests that other factors are influencing results. Changes in sampling methodology, sample integrity, or counting procedures have been ruled out as factors, but climatic ones have not. Starting in 2006, the second year of sampling, the amount of rainfall in the fall prior to sampling dropped appreciably from 10.6 in (26.5 cm) prior to restoration to 6.9 in (17.3 cm) after restoration, with corresponding water salinities in the fall increasing (Figure 8 [36 KB PDF]). More rainfall means more freshwater entering the wetland, which dilutes the salt content and causes erosion of the substrate and fluctuating salinity levels in the sediment. Studies have shown that benthic invertebrate communities can be greatly depressed by the scouring effect of large storm events and dramatic changes in salinity levels (Wolff 1983, Nordby and Zedler 1991). Figures 4 (25 KB PDF) and 8 suggests that there is also a strong relationship in our study between high rainfall, low water salinity levels, and low invertebrate density, particularly in 2005. Ironically, restoration at Limantour Marsh involved removal of a dam that greatly limited freshwater inflow into the downstream marsh, the frequency of flooding events and large freshwater inflow pulses should have actually increased after restoration. 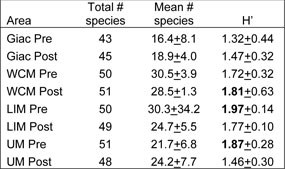
This increase in density does not appear to have been accompanied--or even driven--by an increase in species richness. Species richness or number of species remained relatively consistent between all sites between pre- and post-restoration periods, with Giacomini only gaining two species (43 to 45; Table 1 [66 KB PDF]). Species diversity--which is measured by richness and evenness of species distribution--climbed slightly at Giacomini and Walker Creek Marsh, but actually declined at Limantour Marsh and Undiked Marsh (Table 1). Limantour Marsh pre-restoration had the highest level of biodiversity (H' = 1.97), with Undiked Marsh pre-restoration and Walker Creek Marsh post-restoration falling second and third, respectively (H' = 1.87 and 1.81, respectively; Table 1). Overall, these results suggest that there have been some shifts in species composition and dominance among all the Study Areas between pre-and post-restoration periods, but, in general, increases in invertegrate density have come from higher productivity of the organisms already present in these systems, not from addition of new species. The Giacomini Wetlands appears to be taking a slightly different path in its benthic evolution from many other restoration sites, although the species present may still represent opportunistic invaders--or early successional communities. The rapid convergence in dominant species, however, between the restored dairy ranch and natural marshes suggests that the restored marsh has moved some distance along the evolutionary path, even after only two years. Newly restored areas are often defaunated through the restoration process by placement of dredge spoil; extensive excavation of channels, channel bottoms, or marshplains; or other substrate-disturbing procedures. Recolonization of disturbed areas typically occurs through lateral advection of either adult organisms--often opportunistic invaders--or juveniles, and recolonization dynamics are often governed by the extent of restoration-related ground disturbance and the proximity of source areas or "pools" (Cammen 1976, Alphin and Posey 2000, Zajac and Whitlatch 2001, Ferguson and Rakocinski 2008). The lack of substrate disturbance in the Project Area may have preserved some remnant of the original benthic community in sheltered areas that were not directly exposed to the scour and direct influence of higher salinity tidal waters. In addition, natural marshes directly adjoin the restored wetlands and represent a considerable source of potential colonizing organisms. Rapid recovery or evolution of benthic infauna may also be promoted by the fact that restored marsh soils have retained considerable organic matter, particularly macro organic matter (MOM), which many studies have found to be strongly linked to benthic community development (Cammen 1976, Minello and Zimmerman 1992, Talley and Levin 1999, Havens et al. 2002, Craft and Sacco 2003, Moseman et al. 2004, Bolam et al. 2006, Ferguson and Rakocinski 2008). Untangling the Food Web: Changes in Prey Base Following Restoration |
Last updated: June 27, 2024
