
NPS Photo Great Smoky Mountains National Park is consistently the most visited national park in the country. It lies within a day’s drive of more than half the U.S. population and thus offers the opportunity for tens of millions of people to have a national park experience close to home while also drawing visitors from around the world. Providing a high-quality visitor experience has grown more challenging due to increasing visitation which has resulted in congested roadways, overflowing parking lots, roadside soil erosion, vegetation trampling, and long lines at restroom and visitor center facilities.
NPS graph Visitation Statistics11.5 million visitors came to Great Smoky Mountains National Park in 2025. In 2024, park visitors spent an estimated $2.2 billion in local gateway regions while visiting Great Smoky Mountains National Park. These expenditures supported a total of 33.7 thousand jobs in local gateway economies surrounding the park.Past Work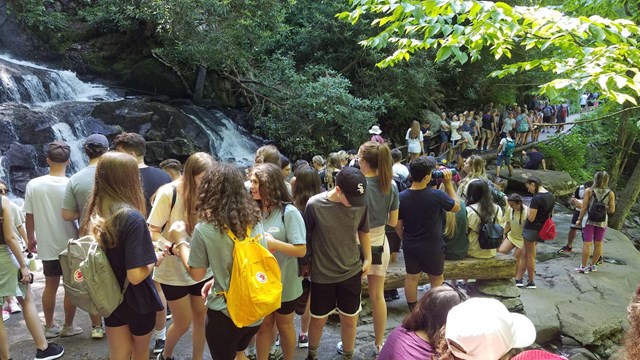
Laurel Falls Congestion Management Pilot
In 2021, park managers piloted various congestion management solutions at Laurel Falls Trail. 
Outreach
In 2020, park managers conducted visitor experience stewardship outreach to learn more about desired experiences across park sites. Visitor Use Studies
In the winter of 2023, Great Smoky Mountains National Park commissioned a survey of visitors in the park. With this survey, we sought to better understand who's coming to the park, how they plan their trips, what they come to see and do, and their perceptions of the park.
Data was collected between January 5 and January 20, 2023; a multi-day storm closure occurred from January 12 - 17. Data collection included both in-person interviews and mail-back surveys of randomly selected people at key park locations. Key Findings:
In the summer of 2022, Great Smoky Mountains National Park commissioned a survey of visitors in the park. With this survey, we sought to better understand who's coming to the park, how they plan their trips, what they come to see and do, and their perceptions of the park.
Data was collected between June 4 - 13 and August 4 - 10, 2022, using both in-person interviews and mail-back surveys of randomly selected people at key park locations. Key Findings:
In the summer of 2018, researchers conducted a visitor survey on behalf of the National Park Service. Surveys were administered June 22-28, 2008. A total of 1,147 questionnaires were distributed to visitor groups. Of those, 748 questionnaires were returned resulting in a 65.2% response rate.
Key Findings:
In the fall of 2018, researchers conducted a visitor survey on behalf of the National Park Service. The survey was administered during October 5-11, 2008. A total of 1,143 questionnaires were distributed to visitor groups. Of those, 781 questionnaires were returned resulting in a 68.3% response rate.
Key Findings:
Download the full report |
Last updated: April 30, 2026