Part of a series of articles titled Park Air Profiles.
Article
Park Air Profiles - Great Smoky Mountains National Park
Air Quality at Great Smoky Mountains National Park
Most visitors expect clean air and clear views in parks. Great Smoky Mountains National Park (NP) in North Carolina and Tennessee, experiences some of the highest measured air pollution of any national park in the U.S. Research and monitoring conducted in the park has shown that airborne pollutants emitted from mostly outside the Smokies are degrading park resources and visitor enjoyment. The burning of fossil fuels—coal, oil, and gas—causes most of the pollution. Wind currents moving toward the southern Appalachians transport pollutants from urban areas, industrial sites, and power plants located both near and far. The height and physical structure of the mountains, combined with predominant weather patterns, tend to trap and concentrate human-made pollutants in and around the national park. Air pollutants carried into the park can harm natural and scenic resources including streams, soils, forests, fish and wildlife, and visibility. The National Park Service works to address air pollution effects at Great Smoky Mountains NP, and in parks across the U.S., through science, policy and planning, and by doing our part.
Nitrogen and Sulfur

Nitrogen (N) and sulfur (S) compounds deposited from the air may have harmful effects on ecosystem processes. Healthy ecosystems can naturally buffer a certain amount of pollution, but once a threshold is passed the ecosystem may respond negatively. This threshold is the critical load, or the amount of pollution above which harmful changes in sensitive ecosystems occur (Porter 2005). N and S deposition change ecosystems through eutrophication (N deposition) and acidification (N + S deposition). Eutrophication increases soil and water nutrients which causes some species to grow more quickly and changes community composition. Ecosystem sensitivity to nutrient N enrichment at Great Smoky Mountains National Park (GRSM) relative to other national parks is very low (Sullivan et al. 2016); for a full list of N sensitive ecosystem components, see: NPS ARD 2019. Acidification leaches important cations from soils, lakes, ponds, and streams which decreases habitat quality. Ecosystem sensitivity to acidification at GRSM relative to other national parks is very high (Sullivan et al. 2016); to search for acid-sensitive plant species, see: NPSpecies.
From 2017-2019 total N deposition in GRSM ranged from 5.7 to 8.1 kg-N ha-1 yr-1 and total S deposition ranged from 1.7 to 2.6 kg-S ha-1 yr-1 based on the TDep model (NADP, 2018). GRSM has been monitoring atmospheric N and S deposition since 1980, see the conditions and trends website for park-specific information.
GRSM receives the highest level of acid deposition of any monitored national park. Although the Acid Rain Program has significantly reduced acid deposition throughout the East, problems remain. High ridge top ecosystems at GRSM, especially soils, are particularly vulnerable to acid deposition from high concentrations of N and S compounds. These systems receive more deposition from rain, fog, and clouds than lower elevation areas. Additionally, low buffering capacity, short growing seasons, and shallow soils make higher elevation areas more sensitive to acid inputs.
Additional N and S research:- Acid rain with an average acidity (pH) as low as 4.6, is 3–8 times more acidic than normal rainfall (NADP 2018)
- Acidic clouds and fog (pH 2.0) that cover high elevation forests at times, contribute to the decline of old growth red spruce forests (MADPro 2007; Cole 1992; Li & Aneja 1992; Lovett et al. 1982)
- Acidification of forest soils, promotes loss of plant nutrients and release of toxic aluminum harmful to vegetation and stream life (Eagar & Adams 1992; Johnson et al. 1991)
- Acidification of high elevation streams contributes to declines in aquatic diversity and native brook trout (SAMI 2002; Herlihy 1996)
- Some high elevation park streams that drain undisturbed watersheds are the highest nitrate levels of any systems in the U.S. Nitrate levels in these streams approach the public health standard for drinking water (Stoddard 1994)
- Several streams in the park have been designated as "impaired" by the State of Tennessee because of acidification
Epiphytic macrolichen community responses
Epiphytic macrolichens grow on tree trunks, branches, and boles. Since these lichens grow above the ground, they obtain all their nutrients directly from precipitation and the air. Many epiphytic lichen species have narrow environmental niches and are extremely sensitive to changes in air pollution. Geiser et al. (2019) used a U.S. Forest Service national survey to develop critical loads of nitrogen (N) and critical loads of sulfur (S) to prevent more than a 20% decline in four lichen community metrics: total species richness, pollution sensitive species richness, forage lichen abundance, and cyanolichen abundance.
McCoy et al. (2021) used forested area from the National Land Cover Database to estimate the impact of air pollution on epiphytic lichen communities. Forested area makes up 2023 km2 (96%) of the land area of Smoky Mountains National Park.
- N deposition exceeded the 3.1 kg-N ha-1 yr-1 critical load to protect N-sensitive lichen species richness in 98.5% of the forested area.
- S deposition exceeded the 2.7 kg-S ha-1 yr-1 critical load to protect S-sensitive lichen species richness in 8.3% of the forested area.
For exceedances of other lichen metrics and the predicted decline of lichen communities see Appendices A and B of McCoy et al. (2021).
Additional modeling was done on 459 lichen species to test the combined effects of air pollution and climate gradients (Geiser et al. 2021). A critical load indicative of initial shifts from pollution-sensitive toward pollution-tolerant species occurred at 1.5 kg-N ha-1 yr-1 and 2.7 kg-S ha-1 yr-1 even under changing climate regimes.
Plant species response
Plants vary in their tolerance of eutrophication and acidification, and some plant species respond to nitrogen (N) or sulfur (S) pollution with declines in growth, survival, or abundance on the landscape. Horn et al. (2018) used the U.S. Forest Service national forest survey to develop critical loads of N and critical loads of S to prevent declines in growth or survival of sensitive tree species. Clark et al. (2019) used a database of plant community surveys to develop critical loads of N and critical loads of S to prevent a decline in abundance of sensitive herbaceous plant species. According to NPSpecies, Smoky Mountains National Park contains:
- 35 N-sensitive tree species and 117 N-sensitive herbaceous species.
- 40 S-sensitive tree species and 90 S-sensitive herbaceous species.
Mycorrhizal fungi community response
Many plants have a symbiotic relationship with mycorrhizal fungi (MF). Through the roots, the plants supply the fungi with carbon from photosynthesis and in exchange the MF enhance nutrient availability within soils, increase drought tolerance, and provide physical resistance to soil erosion (George et al., 1995; Cheng et al., 2021; Burri et al., 2013). Anthropogenic Nitrogen (N) deposition can disrupt this symbiotic relationship resulting in a shift from N sensitive to N tolerant mycorrhizal fungi and plant communities.
With increased N deposition to the soil, MF become less important for nutrient uptake and many plants will cease the exchange of nutrients altogether making them more vulnerable to stressors such as drought (Lilleskov et al., 2019). The CL-N for the shift in mycorrhizal community is 5-6 kg-N ha-1 yr-1 in coniferous forests and 10-20 kg-N ha-1 yr-1 broadleaf forests.
Great Smoky Mountains National Park has 218.4 km2 of coniferous forests, 934.1 km2 of broadleaf forests, and 915.9 km2 of mixed forests. Using the range in critical loads above, the minimum CL is exceeded in 54.7% of forested area and the maximum CL is exceeded in 10.5% of forested area based on 2019-2021 TDep Total N deposition.
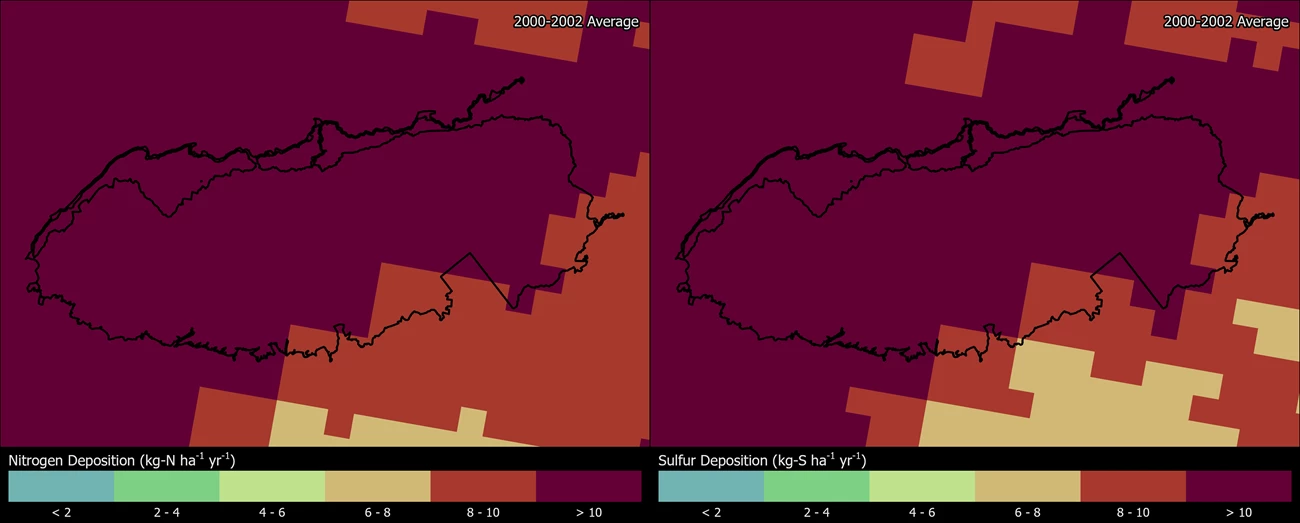
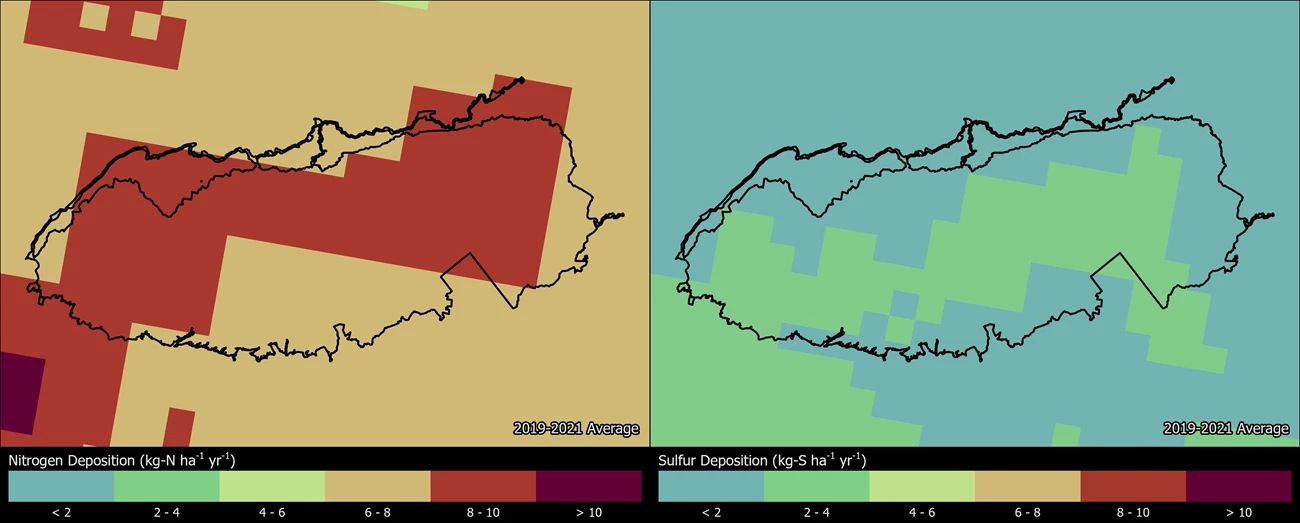
Change in N and S deposition from 2000 to 2021
The maps below show how the spatial distribution of estimated Total N and Total S deposition in GRSM has changed from 2000-2002 to 2019-2021 (TDep MMF version 2022.02). Slide the arrows in the middle of the image up and down to compare N and S deposition between the two years (Yearly Data).
- Minimum N deposition decreased from 8.9 to 6.5 kg-N ha-1 yr-1 and maximum N deposition decreased from 15.3 to 9.7 kg-N ha-1 yr-1.
- Minimum S deposition decreased from 8.5 to 1.7 kg-S ha-1 yr-1 and maximum S deposition decreased from 15.9 to 2.3 kg-S ha-1 yr-1.
Persistent Pollutants
Pollutants like mercury and pesticides are concerning because they are persistent and toxic in the environment. These contaminants can travel in the air thousands of miles away from the source of pollution, even depositing in protected places like national parks. In addition, while some of these harmful pollutants may be banned from use, historically contaminated sites continue to endure negative environmental consequences.
When deposited, airborne mercury and other toxic air contaminants are known to harm wildlife like birds and fish, and cause human health concerns. Many of these substances enter the food chain and accumulate in the tissue of organisms causing reduced reproductive success, impaired growth and development, and decreased survival.
- Mercury concentrations in some fish sampled at Great Smoky Mountains NP exceeded the threshold for human consumption. Preliminary data from 18 sites in the park indicate an average fish mercury concentration of 0.108 ppm ww. Mercury concentrations in 10% of the fish sampled (n=344) exceeded the US EPA threshold established for human consumption (0.3 ppm ww) (Eagles-Smith et al. 2019). However, the data may not reflect the risk at other unsampled locations in the park. Fish consumption advisories may be in effect for mercury and other contaminants (NPS 2022).
- Some dragonfly larvae sampled at Great Smoky Mountains NP had mercury concentrations at moderate or higher impairment levels.Dragonfly larvae have been sampled and analyzed for mercury from 12 sites in the park; 81% of the data fall into the moderate (100-300 ng/g dw) and 5% fall into the high (300-700 ng/g dw) impairment categories for potential mercury risk. An index of moderate impairment or higher suggests some fish may exceed the US EPA benchmark for protection of human health (Eagles-Smith et al. 2018; Eagles-Smith et al. 2020).
- Other studies also found mercury in bird feathers (Keller et al. 2014) and soil, sediment, and macroinvertebrate (Buchwalter 2009) samples from the park.
- Great Smoky Mountains NP has been monitoring litterfall mercury dry deposition since 2007 (NADP 2023). Studying litterfall mercury serves to fill gaps in our knowledge of total deposition inputs of atmospheric mercury to an ecosystem (Risch et al. 2012).
- Microplastics, thought to be deposited by rainfall or wind, were found in 96% of samples collected in Great Smoky Mountains NP(Leffler 2021). The most abundant microplastics were blue and gray strands
The NPS Air Resources Division reports on park conditions and trends for mercury. Visit the webpage to learn more.
Visibility

At Great Smoky Mountains NP, scenic views are often affected by haze that reduces how well and how far people can see. Visibility reducing haze is caused by tiny particles in the air, and these particles can also affect human health. Many of the same pollutants that ultimately fall out as nitrogen and sulfur deposition contribute to this haze. Organic compounds, soot, and dust reduce visibility as well. Pollution-caused haze typically appears as a uniform whitish haze, different from the natural blue mist-like clouds for which the Smokies were named. Significant improvements in park visibility have been documented since the 1990’s. Still, visibility in the park is a long way from the Clean Air Act goal of no human caused impairment.
Visibility effects:
- Reduction of the average natural visual range from about 110 miles (without the effects of pollution) to about 60 miles because of pollution at the park
- Reduction of the visual range in the summer from about 80 miles to below 35 miles on high pollution days
- Severe haze episodes can reduce visibility to 5 miles or less
Visit the NPS air quality conditions and trends website for park-specific visibility information. Great Smoky Mountains NP has been monitoring visibility since 1988. Check out the live air quality webcams at Look Rock, Purchase Knob, and Clingmans Dome; and explore air monitoring »
Ground-Level Ozone

At ground level, ozone is harmful to human health and the environment. Ground-level ozone does not come directly from smokestacks or vehicles, but instead is formed when other pollutants, mainly nitrogen oxides and volatile organic compounds, react in the presence of sunlight.
Over the course of a growing season, ozone can damage plant tissues making it harder for plants to grow and store carbon. Ozone causes leaf injuries like bleaching or dark spots on some sensitive plants, and ozone injury has been observed in the park:
-
Ozone leaf injury was observed on trees including tulip poplar, sassafras, winged sumac, and black cherry which had high injury incidence at multiple park locations (Chappelka et al. 1999)
-
Ozone injury on herb species blackberry, cutleaf coneflower, crown-beard, and milkweed which had high injury incidence at multiple park locations (Chappelka et al 2003).
-
The park has maintained an ozone garden of ozone-sensitive crown-beard as a teaching tool for visiting student groups since 2004 (Luo 2024).
There are 25 plants that may display ozone leaf injury at Great Smoky Mountains National Park. Search ozone-sensitive plant species found at Great Smoky Mountains National Park.
US Environmental Protection Agency and NPS found in ozone exposure experiments that ozone slowed tree seedling growth. Some of these experiments were conducted at Great Smoky Mountains NP using plants collected in the park (Neufeld et al. 1995, Neufeld et al. 2000). NPS uses W126 values from averaged seedling responses in those experiments to describe park condition in terms of Vegetation Health. Ozone affects actively growing plants, so the W126 metric weights a sum of ozone concentrations during daylight hours over three months in the growing season.
A recent re-analysis of the seedling experiments established critical levels of ozone protective of each tree species tested (Lee et al. 2022). The ozone critical levels are W126 values that will prevent 5% or greater deficit in tree seedling biomass. Air Quality Conditions and Trends reports a 5-year average of W126 for each park. In 2018-2022, the average W126 value for Great Smoky Mountains National Park was 5 ppm-h. Based on this ozone level, trees present in the park (NPSpecies) are at risk of the following ozone effects:
-
The tree species tulip poplar (Liriodendron tulipifera), with an ozone critical level of 3.5 ppm-h, is at risk of 7% biomass deficit in seedlings. The tree species black cherry (Prunus serontina), with an ozone critical level of 2.5 ppm-h, is at risk of 10% biomass deficit in seedlings.
-
Tree species Virginia pine (Pinus virginiana), red maple (Acer rubrum), yellow buckeye (Aesculus flava), winged sumac (Rhus copallinum), sugar maple (Acer saccharum), table mountain pine (Pinus pungens), eastern white pine (Pinus strobus), sweetgum (Liquidambar styraciflua), chestnut oak (Quercus montana) and American sycamore (Plantus occidentalis) are at low risk from ozone despite their known sensitivity. Recent ozone levels in the park are below critical levels that protect these trees from 5% biomass deficit.
Ozone critical levels are for tree seedlings, which represent the regenerative capacity and long-term stability of sensitive species within a forest. These tree species are also known to be sensitive to ozone as adults (Bell et al. 2020), but critical values for seedling growth do not predict ozone effects on mature trees. Previous research has shown that ozone slowed the growth of mature trees at Great Smoky Mountains National Park in 1985-1994 and 2001-2003 (Somers et al. 1998; McLaughlin et al. 2007a). Air Resources Division is currently working with collaborators to establish critical levels for mature trees using data from forest monitoring plots. Ozone effects on plants in the park cascade to effects on ecosystem services of climate regulation and water provisioning (Bingham and Porter 2015, McLaughlin et al. 2007b).
Visit the NPS air quality conditions and trends website for park-specific ozone information. Great Smoky Mountains National Park been monitoring ozone levels since 1993. View live ozone and meteorology data.
Particulate Matter
Concentrations of fine particles in the air at Great Smoky Mountains NP sometimes exceed the National Ambient Air Quality Standards set by the U.S. Environmental Protection Agency to protect human health. Fine particles (smaller than 2.5 micrometers) originate from either direct emissions by a source, such as construction sites, power plants, and fires, or reactions with gases and aerosols in the atmosphere emitted from pollution sources upwind.
Because of their small size, fine particles can get deep into the lungs and cause serious health problems. Numerous scientific studies have linked particle pollution exposure to irritation of the airways, coughing, difficulty breathing, aggravated asthma, chronic bronchitis, heart attacks, and premature death in people with heart or lung disease.
Great Smoky Mountains NP has been monitoring particulate matter since 2002. Check out the most recent particulate matter levels on our live data site and explore air monitoring »
Explore Other Park Air Profiles
There are 47 other Park Air Profiles covering parks across the United States and its territories.
References
Bell MD, Felker-Quinn E, Kohut R. 2020. Ozone sensitive plant species on National Park Service lands. Natural Resource Report. NPS/WASO/NRR—2020/2062. National Park Service. Fort Collins, Colorado. https://irma.nps.gov/DataStore/Reference/Profile/2271702
Bingham, A., and E. Porter. 2015. Ozone effects on two ecosystem services at Great Smoky Mountains National Park, USA. Park Science 32(1):71–79. https://www.nps.gov/articles/parkscience_32_1_71-79_bingham_porter_3825.htm
Buchwalter D, Xie L, Arai Y. 2009. Final Report: Assessing Mercury Contamination and Bioavailability in Great Smoky Mountains National Park Aquatic Habitats. Unpublished Report. Available at: https://irma.nps.gov/DataStore/Reference/Profile/2174334
Burri, K., C. Gromke, and F. Graf. "Mycorrhizal fungi protect the soil from wind erosion: a wind tunnel study." Land Degradation & Development 24.4 (2013): 385-392.
Chappelka A, Neufeld HS, Davison A, Somers GL, Renfro JR. 2003. Ozone injury on cutleaf coneflower (Rudbeckia laciniata) and crown-beard (Verbesina occidentalis) in Great Smoky Mountains National Park. Environmental Pollution 125(1): 53-59. https://doi.org/10.1016/S0269-7491(03)00086-1
Chappelka A, Somers G, Renfro J. 1999. Visible Ozone Injury on Forest Trees in Great Smoky Mountains National Park, USA. Water, Air, & Soil Pollution 116, 255–260 (1999). https://doi.org/10.1023/A:1005204305900
Cheng, Shen, et al. "Elucidating the mechanisms underlying enhanced drought tolerance in plants mediated by arbuscular mycorrhizal fungi." Frontiers in Microbiology 12 (2021): 809473.
Clark, C.M., Simkin, S.M., Allen, E.B. et al. Potential vulnerability of 348 herbaceous species to atmospheric deposition of nitrogen and sulfur in the United States. Nat. Plants 5, 697–705 (2019). https://doi.org/10.1038/s41477-019-0442-8
Cole, D.W. 1992. Nitrogen Chemistry, Deposition, and Cycling in Forests. In Atmospheric Deposition and Forest Nutrient Cycling. D.W. Johnson and S.E. Lindberg (Eds.). Springer-Verlag, New York: New York.
Copeland, S.A., Pitchford, M., and Ames, R. 2008. Regional Haze Rule Natural Level Estimates Using the Revised IMPROVE Aerosol Reconstructed Light Extinction Algorithm. Final Paper #48.
Eager, C. and Adams, M.B. 1992. Ecology and decline of red spruce in the eastern United States. Springer-Verlag, New York: New York.
Eagles-Smith, C.A., S.J. Nelson., C.M. Flanagan Pritz, J.J. Willacker Jr., and A. Klemmer. 2018. Total Mercury Concentrations in Dragonfly Larvae from U.S. National Parks (ver. 6.0, June 2021): U.S. Geological Survey data release. https://doi.org/10.5066/P9TK6NPT
Eagles-Smith, CA, JJ Willacker, CM Flanagan Pritz, AC Ellsworth. 2019. Total Mercury Concentrations in Fish from 31 National Parks, USA, 2015-2016. USGS Sensitive Data Release. https://irma.nps.gov/DataStore/Reference/Profile/2260288
Eagles-Smith, C.A., J.J. Willacker, S.J. Nelson, C.M. Flanagan Pritz, D.P. Krabbenhoft, C.Y. Chen, J.T. Ackerman, E.H. Campbell Grant, and D.S. Pilliod. 2020. Dragonflies as biosentinels of mercury availability in aquatic food webs of national parks throughout the United States. Environmental Science and Technology 54(14):8779-8790. https://doi.org/10.1021/acs.est.0c01255
[EPA] U.S. Environmental Protection Agency. 2003. Guidance for Tracking Progress Under the Regional Haze Rule. EPA-454/B-03-004. U.S. EPA Office of Air Quality Planning and Standards, Research Triangle Park, NC.
Geiser, Linda & Nelson, Peter & Jovan, Sarah & Root, Heather & Clark, Christopher. (2019). Assessing Ecological Risks from Atmospheric Deposition of Nitrogen and Sulfur to US Forests Using Epiphytic Macrolichens. Diversity. 11. 87. 10.3390/d11060087.
Geiser, Linda & Root, Heather & Smith, Robert & Jovan, Sarah & Clair, Larry & Dillman, Karen. (2021). Lichen-based critical loads for deposition of nitrogen and sulfur in US forests. Environmental Pollution. 291. 118187. 10.1016/j.envpol.2021.118187.
George, Eckhard, Horst Marschner, and Iver Jakobsen. "Role of arbuscular mycorrhizal fungi in uptake of phosphorus and nitrogen from soil." Critical reviews in biotechnology 15.3-4 (1995): 257-270.
Herlihy, A., Kaufmann, P., Stoddard, J., Eshleman, K., and Bulger, A. 1996. Effects of acid deposition on aquatic resources in the Southern Appalachians with a special focus on Class I Wilderness areas. Report to the Southern Appalachian Mountains Initiative. 92 pp.
Horn KJ, Thomas RQ, Clark CM, Pardo LH, Fenn ME, Lawrence GB, et al. (2018) Growth and survival relationships of 71 tree species with nitrogen and sulfur deposition across the conterminous U.S.. PLoS ONE 13(10): e0205296. https://doi.org/10.1371/journal.pone.0205296
Johnson, D.W., Van Miegroet, J., Lindberg, S.E., Todd, D.E., and Harrison, R.B. 1991. Nutrient cycling in red spruce forests in Great Smoky Mountains. Canadian Journal of Forest Research 21:769–787.
Keller RH, Xie L, Buchwalter DB, Franzreb KE, Simons TR. 2014. Mercury bioaccumulation in Southern Appalachian birds, assessed through feather concentrations. Ecotoxicology. 23(2):304–316. https://irma.nps.gov/DataStore/Reference/Profile/2207362
Kohut R.J. 2007. Ozone Risk Assessment for Vital Signs Monitoring Networks, Appalachian National Scenic Trail, and Natchez Trace National Scenic Trail. NPS/NRPC/ARD/NRTR—2007/001. National Park Service. Fort Collins, Colorado. Available at https://www.nps.gov/articles/ozone-risk-assessment.htm
Lee EH, Anderson CP, Beedlow PA, Tingey DT, Koike S, Dubois J, Kaylor SD, Novak K, Rice RB, Neufeld HS, Herrick JD. 2022. Ozone Exposure-Response Relationships Parametrized for Sixteen Tree Species with Varying Sensitivity in the United States. Atmospheric Environment. 284:1-16. https://irma.nps.gov/DataStore/Reference/Profile/2294221
Leffler, KM. 2021. Investigation of Microplastic Deposition in Areas of the Great Smoky Mountains National Park. University of Tennessee. Knoxville, TN. Available at https://irma.nps.gov/DataStore/Reference/Profile/2284022
Li, Z., and Aneja, V.P. 1992. Regional analysis of cloud chemistry at high elevations in the eastern United States. Atmospheric Environment 26A(11): 2001–2017.
Lilleskov, Erik A., et al. "Atmospheric nitrogen deposition impacts on the structure and function of forest mycorrhizal communities: a review." Environmental Pollution 246 (2019): 148-162.
Lovett, G.M., Reiners, W.A., and Olson, R.K. 1982. Cloud droplet deposition in subalpine balsam fir forest: Hydrological and chemical inputs. Science 218: 1303–1304.
Luo, A. 2024. Ozone Biomonitoring at Purchase Knob: Great Smoky Mountains National Park. https://luo-ecology.shinyapps.io/explore_grsm_ozone_biomonitoring_data/
[MADPro] Mountain Acid Deposition Program. 2007. Cloud deposition monitoring, Clingmans Dome, TN, Great Smoky Mountains National Park. U.S. Environmental Protection Agency, Clean Air Markets Division, Office of Air and Radiation, Washington, D.C.
McCoy K., M. D. Bell, and E. Felker-Quinn. 2021. Risk to epiphytic lichen communities in NPS units from atmospheric nitrogen and sulfur pollution: Changes in critical load exceedances from 2001‒2016. Natural Resource Report NPS/NRSS/ARD/NRR—2021/2299. National Park Service, Fort Collins, Colorado. https://doi.org/10.36967/nrr-2287254.
McLaughlin, S.B., Nosal, M., Wullschleger, S.D., and Sun, G. 2007a. Interactive effects of ozone and climate on tree growth and water use in a southern Appalachian forest in the USA. New Phytologist 174: 109–124. https://doi.org/10.1111/j.1469-8137.2007.02018.x
McLaughlin, S.B., Wullschleger, S.D., Sun, G., and Nosal, M. 2007b. Interactive effects of ozone and climate on water use, soil moisture content and streamflow in a southern Appalachian forest in the USA. New Phytologist 174:125–136. https://doi.org/10.1111/j.1469-8137.2007.01970.x
[NADP] National Atmospheric Deposition Program. Site MLN TN11. 2023. https://nadp.slh.wisc.edu/sites/mln-TN11/ Last accessed February 23, 2023.
Neufeld HS, Lee HE, Renfro JR, Hacker WD, YU B. 1995. Sensitivity of seedlings of black cherry (Prunus serotina Ehrh.) to ozone in Great Smoky Mountains National Park. Biological Conservation 130(3):447-459. https://doi.org/10.1111/j.1469-8137.1995.tb01839.x
Neufeld HS, Lee EH, Renfro JR, Hacker WD. 2000. Seedling sensitivity to ozone for three conifer species native to Great Smoky Mountains National Park. Environmental Pollution 108(2):141-51. https://doi.org/10.1016/S0269-7491(99)00247-X
[NPCA] National Parks Conservation Association. 2006. Recommendations for a Smokies Mercury Study. Letter to the State of Tennessee Department of Environment and Conservation.
[NADP] National Atmospheric Deposition Program. 2018. NTN Data. Accessed January 20, 2022. Available at http://nadp.slh.wisc.edu/NADP/
[NPS] National Park Service. 2022. Fish Consumption Advisories. https://www.nps.gov/subjects/fishing/fish-consumption-advisories.htm
Pardo, L. and Duarte, N. 2007. Assessment of Effects of Acidic Deposition on Forested Ecosystems in Great Smoky Mountains National Park using Critical Loads for Sulfur and Nitrogen. NPS Final Report. Available at https://irma.nps.gov/DataStore/Reference/Profile/2166643
Porter, E., Blett, T., Potter, D.U., Huber, C. 2005. Protecting resources on federal lands: Implications of critical loads for atmospheric deposition of nitrogen and sulfur. BioScience 55(7): 603–612. https://doi.org/10.1641/0006-3568(2005)055[0603:PROFLI]2.0.CO;2
Risch, Martin R., John F. DeWild, David P. Krabbenhoft, Randall K. Kolka, Leiming Zhang. 2012. Litterfall mercury dry deposition in the eastern USA. Environmental Pollution 161 284-290. https://doi.org/10.1016/j.envpol.2011.06.005
[SAMI] Southern Appalachians Mountains Initiative. 2002. Final Report. 145 pp. Available at https://irma.nps.gov/DataStore/Reference/Profile/596269
Shaver, C.L., Tonnessen, K.A., and Maniero, T.G. 1994. Clearing the air at Great Smoky Mountains National Park. Ecological Applications 4: 690–701.
Somers, G.L., Chappelka, A.H., Rosseau, P., and Renfro, J.R. 1998. Empirical evidence of growth decline related to visible ozone injury. Forest Ecology and Management 104:129–137. https://doi.org/10.1016/S0378-1127(97)00252-1
Stoddard, J. 1994. Long-term changes in watershed retention of nitrogen: its causes and aquatic consequences. Pgs 223–284 in Environmental chemistry of lakes and reservoirs. L. A. Baker (ed). American Chemical Society, Washington, D.C.: USA.
Sullivan, T. J. 2016. Air quality related values (AQRVs) in national parks: Effects from ozone; visibility reducing particles; and atmospheric deposition of acids, nutrients and toxics. Natural Resource Report NPS/NRSS/ARD/NRR—2016/1196. National Park Service, Fort Collins, CO.
Valente, R.J., Shea, C., Humes, K.L. and Tanner, R.L. 2007. Atmospheric mercury in the Great Smoky Mountains compared to regional and global levels. Atmospheric Environment 41:1861–1873
Last updated: September 23, 2024