
|
Geological Survey Professional Paper 1547
Sedimentology, Behavior, and Hazards of Debris Flows at Mount Rainier Washington |
TABLE OF CONTENTS
Acknowledgments
Types of flows at Mount Rainier
General statement
Cohesive debris flows (more than 3 to 5 percent clay)
Noncohesive debris flows (less than 3 to 5 percent clay)
Hyperconcentrated flows
Methods of study
Flows of high magnitude and low frequency (500 to 1,000 years)
Greenwater Lahar and Osceola MudflowFlows of intermediate magnitude and frequency (100 to 500 years)
Paradise Lahar
Round Pass Mudflow (branch on Tahoma Creek)
Round Pass Mudflow (branch on Puyallup River)
Unnamed pre-Electron deposits, Puyallup River System
1,000—year—old lahar
Electron Mudflow
Other lahars and possible lahars
Synthesis of the record of large, low—frequency lahars
White River SystemFlows of low magnitude and high frequency (less than 100 years)
Cowlitz River System
Nisqually River System
Puyallup River System
Carbon River System
Recurrence interval of small debris flowsDebris avalanches and the Tahoma Lahar
Seasonal distribution
Flow texture and formative transformations
Flow dynamics and transformations
Historical floods compared with debris flows
Summary of flow origins and transformations
Flow frequency and risk at Mount Rainier
Debris flows and summit-cone volcanism
Design or planning cases and hazard zonation
Definition of cases
Measurements and estimates of flow dynamics
Maximum lahar
Design or planning case I
Design or planning case II
Design or planning case III
Hazard zonation
Zone ILateral erosion associated with hazard zone III
Zone II
Zone III
Probability of precursor volcanic activity
Travel times of lahars and potential reservoir effects
Travel times of lahars
Reservoir effects
White River
Cowlitz River
Nisqually River
ILLUSTRATIONS
PLATE
1. Cross sections of selected flows at Mount Rainier. (omitted from on-line edtion)
FIGURES
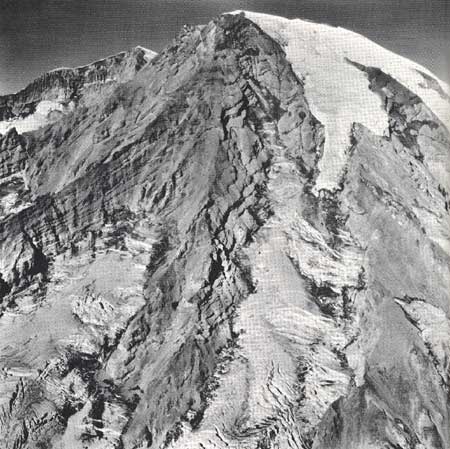
Frontispiece. View of south side of Mount Rainier near the end of the 1987 draought.
1a. 1b. Maps showing location of Mount Rainier, localities of lahar cross sections, and other features of interest in southwestern Washington
2. Graph showing cumulative curves of particle sizes in a typical cohesive lahar (Electron Mudflow) and noncohesive lahar (National Lahar)
3. Graph showing relation of sorting and mean grain size for selected cohesive and noncohesive debris flows
4. Photograph showing northeast side of Mount Rainier and Little Tahoma Peak
5. Graph showing relation of flow volume and clay content in several postglacial mudflows at Mount Rainier
6. Diagrammatic composite sequence of valley-fill deposits in the White River valley
7. Photographs showing mound-studded surface of the Osceola Mudflow
8. Graph showing lahar-bulking factors for four lahars at Mount Rainier, and composition changes in the Osceola Mudflow
9. Composite columnar sections of lahars and associated deposits in the upper Nisqually River drainage
10. Diagrammatic composite sequences of valley-fill deposits in the Puyallup River valley
11. Diagrammatic composite sequences of valley-fill deposits in the Nisqually River valley
12. Photograph showing dish structure in deposits of National Lahar at the type locality
13. Graph showing discharge versus distance for debris flows resulting from glacial outburst or collapse
14. Graph showing seasonal distribution of debris flows, hyperconcentrated flows, and floods in glacier-fed tributaries of the Nisqually River from 1925 to 1990
15—17. Photographs showing:
15. Active front of the South Tahoma Glacier 5 days before and 1 day after the clear-weather glacial-outburst flood and debris flow of June 29, 1987
16. Area of stagnant, moraine-covered lower part of South Tahoma Glacier 5 days before and 1 day after the flow of June 29, 1987
17. Ice clast, more than 1 meter in maximum dimension, included with andesite clasts of similar size in lobate boulder front of flow of October 26, 1986
18. Graph showing cumulative curves of particle sizes within successive boulder fronts and hyperconcentrated- flow deposits formed during transformation of the Tahoma Creek debris flow of October 26, 1986
19. Photographs showing debris flow levees and underlying sole layers from flows of 1986 and 1987 along Tahoma Creek
20. Graph showing cumulative curves of particle sizes of debris flows derived by dewatering
21. Photograph showing debris avalanche on the surface of the Tahoma Glacier at the head of the South Puyallup River
22. Photograph showing megaclast at surface of the 1963 debris avalanche below the Emmons Glacier in the main fork of the White River
TABLES
1. Tephra units and other indications of volcanic activity
2. Mainly cohesive debris flows of sector-collapse or avalanche origin
3. Mainly noncohesive debris flows and their runout phases
4. Radiocarbon dates from hyperconcentrated-flow and normal streamflow deposits
5. Summary of origins and transformations of debris flows
6. Ranking of debris flows described in table 5 by magnitude, frequency, and risk
7. Characteristics of design- or planning-case lahars
8. Celerities and travel times of the maximum lahar, Case I lahar, and Case II lahar from Mount Rainier to the nearest downstream reservoir or the Puget Sound lowland
CONVERSION FACTORS
| Multiply | By | To obtain |
| millimeters (mm) | 0.03937 | inches |
| centimeters (cm) | 0.3937 | inches |
| meters (m) | 3.281 | feet |
| kilometers (km) | 0.6214 | miles |
| square kilometers (km2) | 0.3861 | square miles |
| meters per second (m/s) | 3.281 | feet per second |
| cubic meters per second (m3/s) | 35.31 | cubic feet per second |
|
| Frontispiece. View of south side of Mount Rainier near the end of the 1987 drought; showing upper Kautz Glacier, right of center, and tributary of Success Glacier, at lower left, separated by Kautz Glacier. Sunset Amphitheater, far upper left, is above heads of Puyallup and Tahoma Glaciers. Note the volanic edifice composed of steeply outward-dipping lava and pyroclastic flow units. Hydrothermal alteration has been intense along many of the stratigrahic contacts, converting them to potential planes of failure. Photograph by R. M. Krimmel, October 5, 1987. |
| <<< Previous | <<< Contents >>> | Next >>> |
pp/1547/contents.htm
Last Updated: 01-Mar-2005