
|
Geological Survey Professional Paper 1547
Sedimentology, Behavior, and Hazards of Debris Flows at Mount Rainier Washington |
TRAVEL TIMES OF LAHARS AND POTENTIAL RESERVOIR EFFECTS
The Puyallup and Carbon River systems presently (1994) have no reservoirs. The White and Nisqually River systems each have one reservoir, and the Cowlitz has two of greatly differing capacities. All but one of the reservoirs are far enough from the volcano that they are not at direct risk of a debris avalanche, except for secondary or transformation phases. All are at some risk from a Case I lahar; the travel time of such a flow from the volcano to the upstream end of each reservoir would be no more than several hours. Other possible reservoir impacts include the beneficial, hazard-reducing effects of impounding or attenuating volcanic flows.
The importance of a warning of dam failure is dramatically illustrated by the much greater numbers of survivors where warning was received (Costa, 1985). The importance of a warning system is equally applicable to Case I and Case II lahars whether or not a reservoir is involved. So rapid and localized are Case III flows that only advance planning and minimizing exposure will be effective.
TRAVEL TIMES OF LAHARS
The time it takes a debris flow wave to travel from point to point involves uncertainties, but a range of values can be estimated. A major source of uncertainty is the difference between mean flow velocity (table 7) and the flow-wave velocity (celerities in table 8). The first of these is the observed (or estimated) forward speed of mud and water in the flow; the latter is the rate at which the form of the flow wave progresses down the channel (celerity). A pronounced difference is apparent from a comparison of the velocity data of Fairchild (1985) and the celerity data of Cummans (1981) for the same 1980 lahars at Mount St Helens. In general, the velocity of the material in the flow at the time of peak stage was faster than the speed with which the flow wave moved. For example, the average peak flow velocity of the 1980 North Fork lahar was about 9 m/s (Fairchild, 1985, fig. 4.4) over a channel interval where celerity of the maximum stage was only 2.1 m/s (Cummans, 1981, p. 485). The factors causing this difference are summarized below.
|
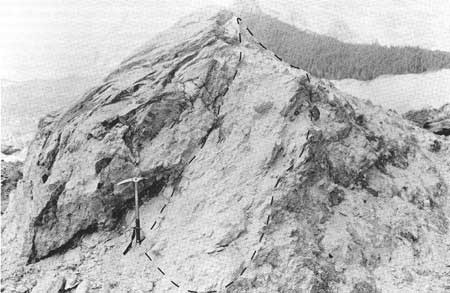
| Figure 22. Megaclast at surface of the 1963 debris avalanche below the Emmons Glacier in the main fork of the White River. Note the lighter colored zone of hydrothermal alteration (outlined) developed along a flow contact or fracture zone in volcanic breccia. The zone is about 1 m thick and is typical of flow contacts (frontispiece), fractures, and fault zones at Mount Rainier. |
The 1980 North Fork lahar was texturally similar in behavior to the Case I lahar, and each was derived from a debris avalanche. The 1980 lahar originated by slumping of the surface of the 1980 avalanche, whereas the Case I example was mobilized directly from such a flow.
The behavior of the two cohesive lahars was probably similar with the exception that the 1980 flow probably was more broadly peaked at the point of origin. Thus, the celerity of the Case I lahar was likewise less than the actual flow velocity. Although a flood wave of water commonly travels faster than its constituent water and sediment particles, this is not possible in a debris flow. The highest possible celerity of a lahar is the peak flow velocity. The minimum celerity may be estimated by the relation of celerity to peak flow velocity for the 1980 North Fork lahar. That ratio is 0.23. By such reasoning, the celerity of the Case I lahar varies from a minimum of 5 m/s to a maximum of about 22 m/s. This range of possible values is used to estimate travel times of the Case I lahar to the reservoirs (or the Puget Sound lowland) in river systems draining the volcano (table 8). Because the actual behavior of comparable flows is utilized, values intermediate within this range but tending nearer the longer travel times (Power celerities) can be considered for planning emergency response. Using an intermediate value, rather than the longest travel time, will adjust for the more rapid arrival of the leading edge of the flow. For example, though the possible travel times for the Case I lahar down the Puyallup or Carbon Rivers to the lowland range from 0.5 to 2.1 hours (table 8), a probable range for planning purposes would be 1.0 to 1.5 hours. The remaining uncertainties, however, require that these figures be treated as approximations.
| Property | Maximum lahar |
Case I lahar |
Case II lahar |
| Lahar type | Cohesive | Cohesive | Noncohesive |
| Celerity of peak stage1(m/s): | |||
| Approximate maximum2 | 25 | 22 | 8 |
| Approximate minimum | 6 | 5 | 3 |
| Range of possible travel times3(hours): | |||
| White R.. to Mud Mtn. R.es. (56 km) | 0.6-2.6 | 0.7-3.1 | 1.9-5.2 |
| Cowlitz R.. to Riffe Lake (77 km) | 0.9-3.6 | 1.0-4.3 | 2.7-7.1 |
| Nisqually R.. to Alder Res. (45 km) | 0.5-2.1 | 0.6-2.5 | 1.6-4.2 |
| Puyallup R.. to lowland (38 km) | 0.4-1.8 | 0.5-2.1 | 1.3-3.5 |
| Carbon R. to lowland (38 km) | 0.4-1.8 | 0.5-2.1 | 1.3-3.5 |
1Probably equivalent to peak discharge.
2Equal to estimated mean peak velocity between the volcano and either the first reservoir or the Puget Sound lowland.
3Values in parentheses show distance along valley axis from volcano to head of reservoir or to boundary of Puget Sound lowland.
By similar reasoning, the behavior of the noncohesive South Fork lahar at Mount St Helens was probably similar to that of the noncohesive Case II flow. The ratio of celerity to peak flow velocity over a 40-km interval for the 1980 lahar was about 0.35 (Cummans, 1981; Fairchild, 1985). Consequently, the possible values of Case II celerity could range from a minimum of about 3 m/s to a maximum of about 8 m/s. These values are used to compute possible travel times (table 8).
Several factors contribute to this apparent discrepancy between the peak flow velocity and the wave celerity of debris flows: (1) the velocity measurements use relations unverified for debris flows and may be too high (Costa, 1984); (2) material may be continuously recycled through the peak to a point of temporary storage lateral to or beneath the flow, and that material then may re-enter the flow by draining back after passage of the peak, again to move forward into the peak (the caterpillar-track-path analogy; Johnson, 1984, p. 287); (3) velocity-measurement sites may be concentrated in narrow reaches where flow is faster than the average rate over many reaches; and (4) the flow waves commonly broaden during movement (Fairchild, 1985; Pierson and others, 1990), increasing the distance between the leading edge and the peak stage of the flow, and thereby reducing peak stage celerity.
RESERVOIR EFFECTS
WHITE RIVER
The Mud Mountain Dam (fig. 1), near the boundary of the Cascade Range and the Puget Sound lowland, is entirely a flood-control structure and is normally drawn down to negligible storage. The maximum-impoundment level extends to within 56 km downvalley from the summit of Mount Rainier. Capacity above dead storage is 131 million m3, about 57 percent of the Case I volume (table 7). The actual proportion of the Case I volume retained would be greater because the depositional surface of the debris flow deposits would approach the slope of the stream channel, whereas the calculated reservoir capacity assumes a horizontal water surface. In addition, the backwater effects of the debris flow deposits could trigger an additional, unknown volume of upstream deposition.
The dam is a rock-and-earthfill structure with a rolled impervious core and probably could safely contain at least its capacity, so that any flow but the maximum lahar would be significantly attenuated. No wave of translation is likely to be generated by a lahar entering the reservoir, and any volcanically induced flow across the spillway would be debris flow. A concern is spillway abrasion by intralahar impact forces, described by Scott (1989). Runouts of Case II and III flows would be contained by the reservoir. Probable routing of any uncontained flow, as interpreted by Crandell (1971), would be within the White River valley unless (1) valley walls near Buckley were overtopped, sending part of the flow into the Carbon River drainage, or (2) flow extended to Auburn and crossed into the Green River drainage.
COWLITZ RIVER
The large, concrete-arch Mossyrock Dam (Riffe Lake, fig. 1) is a multipurpose impoundment. The upstream end of the reservoir at capacity is 77 km downvalley from the summit of Mount Rainier. Usable storage capacity is 1,600 million m3, a value 7 times the volume of the Case I example but only half that of the maximum lahar (table 7). Not all of this capacity is available because levels and releases are subject to flood-control and power-generation agreements. The normal operational goal is for annual refill by July 31. Gradual releases are normally maintained through the rest of the summer, increasing after late October in preparation for maximum flood-control drawdown between December 1 and March 1. Refill then begins with snowmelt runoff. The Case I example would be contained during the winter drawdown period and much of the remaining period. Runouts of Case II and III flows are not of concern at any time.
The risk of dam failure resulting from a wave generated by a volcanically induced inflow is greatly reduced by the improbability of a large debris avalanche extending to the reservoir. A lahar inflow would be far more gradual than either a landslide inflow, as at Vaiont, Italy (Kiersch, 1964), or a hypothetical debris avalanche like the one that could possibly enter Swift Reservoir near Mount St. Helens (Major and Scott, 1988). Given the large attenuation that would occur in the lahar flood wave through deposition on the Cowlitz River flood plain upstream, it is unlikely that a lahar-generated wave by the Case I example could cause failure. The prehistoric Case I inundation area is, in fact, similar to the flood-plain area upstream of Riffe Lake.
Riffe Lake could be drawn down in response to an emergency if precursor volcanic activity has occurred and the risk of a lahar is high. Once a lahar has been initiated, though, time would be too short for any significant draw down. The maximum drawdown rate, without presently causing inundation downstream at Castle Rock, is in the approximate range of 1,100 to 1,400 m3/s, or about 0.3 percent of usable storage in 1 hour with zero inflow (data from Department of Public Utilities, City of Tacoma). Probable travel times of both the maximum lahar and the Case I lahar are less than approximately 4 hours (table 8).
NISQUALLY RIVER
Alder Dam (fig. 1) is a small version of Mossyrock Dam, likewise of concrete-arch design and with similar operational modes. Usable capacity, corrected for the most recent sediment survey, is about 198 million m3. This value is a negligible portion of the Maximum lahar but is approximately 86 percent of the Case I example (table 7). However, sedimentation rate and trap efficiency are high, and several additional percent of capacity have probably been lost. As at Riffe Lake, this capacity is never entirely available.
The dam could clearly be destroyed by the maximum lahar. It is also the most vulnerable to a Case I flow of the three reservoirs potentially affected by volcanic debris flow. It is the reservoir most vulnerable to failure caused by a wave of translation, because the relatively confined valley upstream is capable of conveying a large lahar without great volume loss. Consequently, a high priority needs to be given to drawing down this reservoir in the event of probable volcanic activity.
Inflowing lahars will generate long-period waves that will translate through the reservoir to affect the dam. In a model of the behavior of Swift Reservoir in response to rapid inflow (Pacific Power and Light, 1980), peak wave action in the reservoir occurred before significant water level rise. That reservoir is closer to Mount St Helens (13 km by the most direct route) than Alder Reservoir is to Mount Rainier (45 km). Thus, the time to peak of a lahar wave is probably greater at Alder Reservoir, resulting in a more gradual rise. However, given the variety of attenuation rates and wave shapes possible for different flows at Mount Rainier, this is not certain. What is certain, however, is that the riskiest potential lahar reaching Alder Reservoir from Mount Rainier is far larger than that reaching Swift Reservoir from Mount St Helens and that volumetric impacts probably will dominate as hazards at Alder Reservoir. Crandell (1988, fig. 18) shows Alder Reservoir to be within range of a debris avalanche that has not transformed to a lahar.
Loss of capacity in Alder Reservoir, because of the high "background" sedimentation rate, will probably make the structure uneconomic in a fraction of the recurrence interval of the Case I flow. When the reservoir is filled with sediment, decisions either to modify the structure and increase capacity or to abandon it need to consider the possibility of a Case I lahar. The same aspects of emergency response that apply to Riffe Lake also apply to Alder Reservoir. Total streamflow at the highway bridge near Yelm cannot exceed 227 m3/s without causing flooding of habitation there (data from Department of Public Utilities, City of Tacoma). If a release of 150 m3/s from the reservoir is possible (depending on downstream tributary inflows), drawdown with zero inflow is at a rate of 0.3 percent of total capacity per hour. The travel time of a Case I flow from the volcano is less than about two hours (table 8).
| <<< Previous | <<< Contents >>> | Next >>> |
pp/1547/sec6.htm
Last Updated: 01-Mar-2005