.gif)
GRTE-N-1
|
Research Report GRTE-N-1
The Elk of Grand Teton and Southern Yellowstone National Parks |

|
POPULATION DYNAMICS
This section is concerned with reproduction, sex and age structures, annual increase and mortality rates, and general population trends. The data relate primarily to animals that use or migrate over park lands, unless otherwise noted. Elk ages were determined by examining lower jaw teeth (Quimby and Gaab, 1957).
Female Reproduction
Breeding Ages
Examinations of reproductive organs from 751 elk killed on or adjacent to Grand Teton Park between October 1 and November 30 from 1962 through 1966 show most female elk become sexually mature at 2-1/2 years of age (Table 5). An average of about 15 percent of the yearling females were indicated to be sexually mature.
Pregnancy Rates
Table 5 also shows that about 78 percent of the females older than calves and 89 percent of the females older than yearlings were pregnant or had ovarian structures associated with fertility. These figures may approximate final pregnancy rates, despite some samples being from females killed before the end of the breeding season. The ages of 298 embryos (Morrison et al., 1959) showed conception occurred from September 2 through November 29 from 1963 through 1966. About 16, 62, and 22 percent of these conceptions occurred between September 2 through 20, September 21 through October 10, and October 11 through November 13 periods, respectively.
| Ages | Sample | No. Pregnant1 |
No. Active2 |
Pregnant or Active | |
| No. | Pct. | ||||
| 1/2 | 23 | 0 | 0 | 0 | 0 |
| 1 | 108 | 4 | 12 | 16 | 15 |
| 2 | 106 | 73 | 21 | 94 | 89 |
| 3 | 123 | 72 | 40 | 112 | 91 |
| 4-7 | 259 | 155 | 85 | 230 | 89 |
| 8+ | 132 | 76 | 43 | 119 | 90 |
| Totals | 751 | 380 | 201 | 571 | |
1Embryo, embryonic tissue in uteri and/or corpora lutea 10 mm. or larger. 2Graffian follicles and/or partially lutenized follicles as well as corpora lutea with a diameter less than 10 mm. indicated ovarian activity associated with fertility. | |||||
Murie (1951) examined 334 females older than yearlings killed on the refuge during December and January of 1935-36 and found 89 percent to be pregnant. Kittams (1953) and Greer (1966a) reported rates of 85 and 89 percent, respectively, for large samples of northern Yellowstone elk older than yearlings. The general agreement among figures suggests most estrous females become pregnant and animals older than yearlings have a fairly consistent high rate of pregnancy. The incidence of pregnant or "fertile" yearling females in this study varied, ranging from 0 to 27 percent in small yearly samples of 14 to 34 animals between 1963 and 1966. The above authors report yearling pregnancy rates that varied from 0 to 30 percent.
Relative Reproductive Success
Hunter reports for each of 907 female elk as "wet" or "dry" between 1963 and 1966 show about 47 percent of the females older than yearlings were lactating. About 10 percent of the 2-year-olds (bred as yearlings), 50 percent of the 3-year-olds, 58 percent of the 4-to-7-year-olds, and 49 percent of the 8-year-and-older animals in this sample were indicated to be nursing a calf. No yearlings were reported to be lactating.
Sex and Age Structures
Results from classifying elk on the refuge since the winter of 1927 are shown in Table 6. The average 1955-67 composition of 62 percent females, 19 percent calves, 6 percent yearling males and 13 percent adult males compares with averages of 64 percent females, 19 percent calves, 5 percent yearling males, and 12 percent adult males obtained over a 29-year period between 1927 and 1954. Some environmental regulation of population sex and age structures is suggested. Marked composition changes, such as occurred after the severe winter of 1961-62, were apparently caused by a proportionately greater late winter and spring mortality of adult male and calf elk and a subsequent reduction in the production of new calves. Records for this winter show that 34, 18, and 48 percent of 182 winter-killed animals examined were in the adult-yearling male, female, and calf classes, respectively.
Mortality and Increases
Newborn Mortality
Field observations indicated the peak of calving was between the last week of May and the first week of June. The difference between the 31 calves per 100 females in refuge winter herds since 1955 (Table 6) and the possible 78 percent pregnancy rate for females older than calves (Table 5) suggests that postnatal mortality averaged about 60 percent. The remaining 40 percent represented the realized calf production which averaged 19 percent of herd numbers by fall. Studies on elk by Greer (1966b), white-tailed deer (Odocoileus virginianus) by Verme (1962, 1963) and Murphy and Coates (1966) indicate that substantial mortality of young animals occurs at or shortly after birth. Young are born dead, too weak to nurse, or starve because of insufficient milk when females are in poor condition. Predation, accidents, and disease induced by adverse weather probably also remove proportionately greater numbers of young shortly after they are born.
| Winter period |
No. elk classified |
Percent |
Ratio/100 | ||||
| Females | Calves | Males |
Females | ||||
| Yearling | Adult | Calves | Males | ||||
| 1927-54 | Average | 64 | 19 | 5 | 12 | 30 | 26 |
| 1955-56 | 11,017 | 67 | 16 | 4 | 13 | 23 | 25 |
| 1958-59 | 5,595 | 56 | 22 | 4 | 18 | 39 | 40 |
| 1959-60 | 5,746 | 59 | 18 | 5 | 17 | 38 | 39 |
| 1960-61 | 6,701 | 59 | 20 | 7 | 14 | 34 | 35 |
| 1961-62 | 7,666 | 55 | 24 | 7 | 14 | 45 | 38 |
| 1962-63 | 5,827 | 70 | 13 | 6 | 11 | 18 | 24 |
| 1963-64 | 7,916 | 62 | 22 | 4 | 12 | 36 | 28 |
| 1964-65 | 7,946 | 62 | 19 | 7 | 12 | 31 | 31 |
| 1965-66 | 6,556 | 63 | 19 | 6 | 12 | 30 | 29 |
| 1966-67 | 7,369 | 63 | 21 | 5 | 11 | 33 | 17 |
| 1955-67 | Average | 62 | 19 | 6 | 13 | 31 | 31 |
1 From National Elk Refuge records obtained by cooperative State and Federal agency classifications. | |||||||
Annual Increases and Other Mortality
The recent 10-year and earlier average of 19 percent calves in refuge winter herds show that yearly increases from winter to fall numbers could have averaged 23 percent (.19/.81 = .23). The more recent 4-year average of 20 percent calves since 1963-64 show a potential for 25 percent (.20/.80 = .25) increases. It was assumed that population numbers would remain relatively stable if hunting and other mortality removed numbers equal to calf production. Hunting mortality was considered to amount to the checked or calculated legal kill plus 10 percent (of the legal kill) for crippling losses and illegal removals. An 8 percent crippling, accidental death, and illegal kill loss was actually accounted for during the 1965 Grand Teton hunt (Cole, 1966).
Hunting mortality figures for the refuge winter herd could not be separated from those for the Gros Ventre herd before 1963-64. Combined figures were used to calculate yearly herd numbers which gave the "best fit" with periodic censuses. A "best fit" was obtained over a 1955-63 period by using a 16 percent (.14/.86 = .16) increase rate (Table 7). The difference between expected and realized calf proportions (.19 - .14 = .05) suggested that late winter or spring mortality averaged about 5 percent of winter herds and approximately 4 percent of their subsequent fall numbers. Hunting mortality on fall herds removed an additional 16 percent. This total 20 percent mortality apparently removed numbers greater than those being added by calf production. Numbers in the two herds appear to have declined from about 14,700 to 12,600 animals over the period. The difference amounted to about 260 animals per year or roughly 2 percent of winter numbers. Similar declines occurred over the next 4 years with hunting removals that averaged about 21 percent.
Hunting mortality on the refuge winter herd probably averaged about 19 percent of fall herd numbers since 1963-64 (Table 8). The differences between censuses and calculated 1966-67 herd sizes and the 20 percent potential could represent sampling errors or indications that additional mortality from causes other than hunting continued. The latter was probably the case. Differences between potential and observed ratios of yearling male elk in July classifications (N = 3,717) from mountain areas indicated that overwinter and spring mortality on calf elk was about 19 percent or equal to 3 percent of winter herd numbers after the deep snow winter of 1964-65; not detectable following the mild or average 1962-63, 1963-64 and 1965-66 winters. Recorded mortality of all sex and age classes on refuge feed grounds was 1 percent or less of winter numbers during these years (Yorgason, 1968 writ, comm.). Comparable calculations indicated calf mortality during and after the severe 1961-62 winter was about 75 percent or equal to 18 percent of winter herd numbers. Only a 2 percent mortality of all sex and ages was accounted for on feed grounds. Ratio calculations used calf per 100 female values in winter herds as recruitment potentials and adjusted observed yearling per 100 female values (Y) as 2Y/100-Y. Equal calf sex ratios with proportionate mortality and either proportionate or relatively low adult female mortality was assumed.
| Years | Winter herd size2 |
Calculated fall herd |
Hunter kill | |
| Number | Percent | |||
| 1955-63 | 12,800 Avg. | 15,200 Avg. | 2,400 Avg. | 16 |
| 1963-64 | 11,500 | 14,600 | 3,100 | 21 |
| 1964-65 | 11,300 | 14,400 | 3,100 | 21 |
| 1965-66 | 10,500 | 13,800 | 3,300 | 24 |
| 1966-67 | 10,600 | 13,100 | 2,500 | 19 |
1The 1955-56 population figure of 14,685 and hunter kill records from Wyoming Game and Fish Commission reports. 2Calculated using 16 percent annual increase up to 1963-64 and 25 percent thereafter. The 1966-67 calculated population was approximately 100 animals above a subsequent census. | ||||
| Years | Winter herd size1 |
Calculated fall herd |
Hunter kills2 | |
| Number | Percent | |||
| 1963-64 | 7,900 (7,916) | 9,400 | 1,500 | 16 |
| 1964-65 | 8,000 (8,096) | 9,900 | 1,900 | 19 |
| 1965-66 | 7,600 (6,556) | 10,000 | 2,400 | 24 |
| 1966-67 | 7,900 (7,663) | 9,500 | 1,600 | 17 |
1Calculated using 25 percent increase rates with censused numbers in ( ). 2 Proportion calculations using elk checked at park and state check stations. | ||||
The calf mortality figures could be slightly inflated because of a tendency for proportionately greater numbers of yearlings to remain in valley areas (Martinka, 1965). However, it seems probable that a 2 to 3 percent mortality of both calf and adult elk could be expected during most winters and at least 15 percent for severe winters. Mortality that averaged at least 5 percent over mild, average, and severe winters may have been partially density-independent with herd sizes in the 6,000 to 8,000 range.
Population Trends
General trends for the refuge winter herd and the Jackson Hole herd as a whole are shown with available hunter harvest data on Figure 8. Population trend figures were from highest censuses (N = 11) obtained within 5-year periods since 1911. These were usually obtained during more severe winters. Census and/or harvest records were from Preble (1911), Sheldon (1927), Anderson (1958), and Yorgason (1968 writ. comm.).
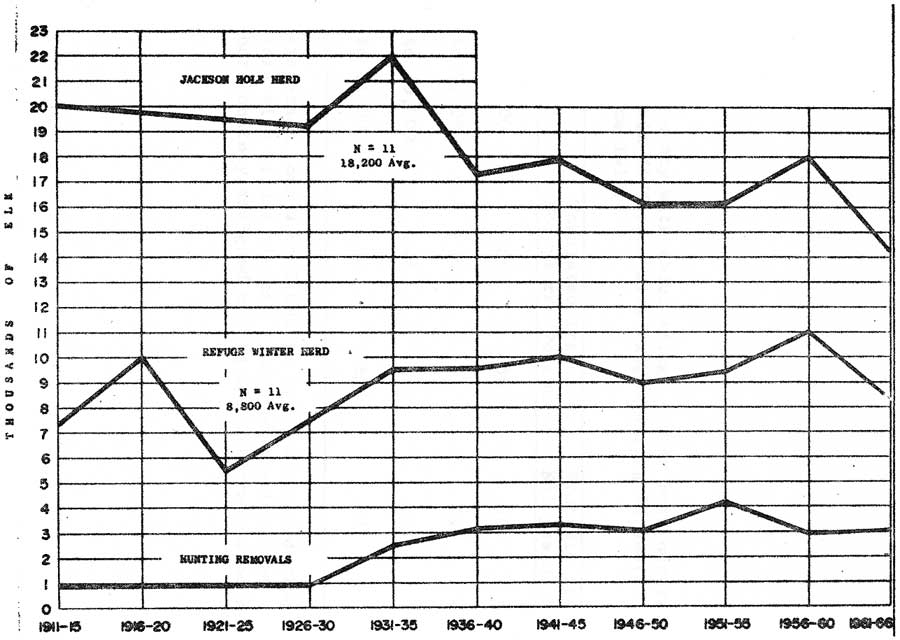 |
| Fig. 8. Population trends of the Jackson Hole herd and refuge winter segment, as indicated by maximum counts and/or estimates within periods since 1911 and corresponding average hunting removals. (click on image for an enlargement in a new window) |
Population trends for the refuge herd appear to have been relatively "stable" for the past 57 years. Winter herd numbers have apparently fluctuated within a 6,000 to 8,000 range about 65 percent of this time, a 5,000 to 9,000 range 78 percent of the time, and a 5,000 to 10,000 range with a 98 percent frequency (Table 9). Trends and fluctuations showed no obvious relationship to hunting removals until after 1950 (Figure 8).
After 1950, higher hunting removals (from a smaller total population) may have partially reduced the extreme low fluctuations in herd numbers. Periodic upward fluctuations continued through the 1950's. Acquisitions of additional portions of the elk winter range by and after 1950 could have also contributed to these, as well as to the reduced downward fluctuations.
Figure 8 shows population trends for the Jackson Hole herd as a whole have been downward since 1911. The general declines and fluctuations up to about 1941 were undoubtedly caused by some thing(s) other than the relatively low hunting removals. Reports by Preble (1911), Barnes (1912), Graves and Nelson (1919), Sheldon (1927), and Anderson (1958) suggest that livestock grazing and agricultural developments may have progressively reduced winter food for elk within this period.
| Winter herd size | Tabulated No. years |
Frequency Percent |
Probable frequency1 | |
| No. years | Percent | |||
| 6,000 to 8,000 | 30 | 56 | 35 | 65 |
| 5,000 to 9,000 | 36 | 61 | 42 | 78 |
| 5,000 to 10,000 | 44 | 81 | 53 | 98 |
| 5,000 to 11,000 | 45 | 83 | 54 | 100 |
1Interspersed counts of 3,000 to 4,500 animals 9 years with milder winters and/or population proportionately assigned within the different during lows size ranges. | ||||
Enactment of a State game damage law in 1939 undoubtedly gave impetus to securing increased hunting removals from herd segments conflicting with agriculture. These animals, elk in scattered wintering areas off established feed grounds and groups that migrated through areas where they were particularly vulnerable, appear to have been herd segments mainly reduced by the sustained high average hunting removals during the late 1940's and the 1950's (see Fall Migrations). Censuses of elk in scattered groups off established feed grounds ceased in 1959, but it is probably safe to assume that between 13,000 and 15,000 elk have occurred in the Jackson Hole herd through the 1960's.
While hunting removals could be considered the cause for the general population declines in the Jackson Hole elk herd, the actual agents were human settlement and agricultural developments on the animals' historical winter range. The refuge herd, which had essential portions of its original winter range restored, appears to have maintained its numbers while other segments declined. Winter herds in the southern portions of the Jackson Hole valley were artificially fed on small areas to hold the animals off extensive bottomlands that have become hayfields and livestock pastures. Such feeding may have substituted for the loss of bottomland foraging areas, but not without consequences on herd numbers (see Ecology).
The overall decline in the Jackson Hole elk herd probably approximates 30 percent of their 1910-11 numbers. This coincides with the animals being restricted from using about one-third of their original winter ranges within the main Jackson Hole valley and substituting domestic stock for elk grazing on other wintering areas. Other human influences additionally restricted the animals' winter distributions and use of food sources with adverse population consequences. As will be discussed in later sections, the availability of a complex of interspersed bottomland, swale, and slope sites may be as important in maintaining elk numbers as some total acreage of winter range.
 Top
Top
Last Modified: Tues, Jan 20 2004 10:00:00 pm PDT
http://www.cr.nps.gov/history/online_books/fauna8/fauna3.htm
![]()