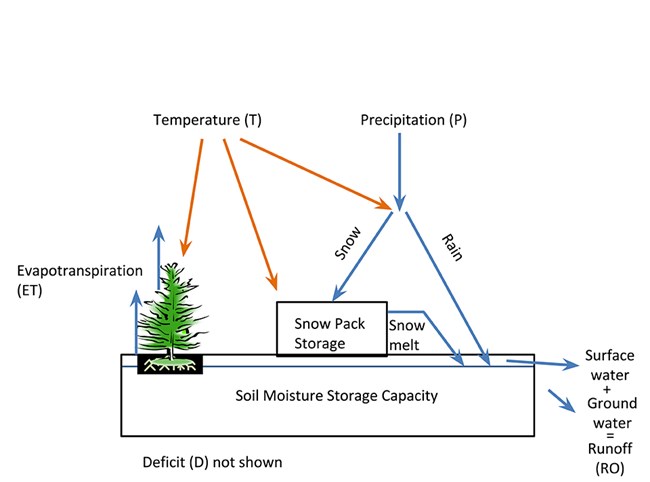
Adapted from Gray and McCabe 2010: A combined water balance and tree ring approach to understanding the potential hydrologic effects of climate change in the central Rocky Mountain region. Water Resources Research 46(5), online
Plants and animals are adapted to both the short-term variability of weather and long-term climate conditions. However, if extreme weather or changes in climate exceed their ability to cope, they will move, suffer, or perish. Both weather and climate shape ecological processes and the distribution of plants and animals across the landscape. For example, extreme weather in the form of droughts or floods affects wildfires, the timing and volume of streamflow, and plant growth. Climate, such as cold and wet conditions on a mountainside, affects which plants and animals live there and how quickly they grow and reproduce. Because climate, weather, and natural resource vital signs are all intricately linked, we study them simultaneously. Understanding how park vital signs responded in the past provides clues to how they may respond in the future.
We track climate using weather station data from network parks. We also calculate water balance from temperature and precipitation using a model that is like a bank account for water. It tracks precipitation input, storage in the soil, and outflow via runoff and evapotranspiration. Water can be stored temporarily as snow that then melts to supply wetlands, streams, and soil moisture for plants during dry spells. Real-time weather and water balance conditions, along with historical summaries, are reported through an interactive website, www.climateanalyzer.us. By tracking the spatial and seasonal patterns in water availability, water use, and water need during drought, we explore relationships between weather, climate, and the natural resource vital signs. For example, we analyze how runoff from snowmelt influences the availability of water in wetlands for amphibians. Similarly, we analyze how drought and mountain pine beetle (Dendroctonus ponderosae) affect whitebark pine (Pinus albicaulis).
We ask:
-
What is the relationship between weather and climate and park vital signs?
-
Which climate-related factors have the most effect on park vital signs?
-
How does water availability change over time across park landscapes in response to climate?
We track:
-
the location, timing, and total amount of precipitation (rain and snow) at park weather stations
-
daily air temperature throughout the year at park weather stations
- changes in water availability—known as the water balance—over time across park landscapes
Two documents guide our climate monitoring:
Climate Change
- Duration:
- 8 minutes, 58 seconds
Learn how scientists are studying the effects of climate change on national parks and what some parks are doing to lower their carbon footprint.

NPS Photo/Jim Peaco
Climate change is both natural and human caused, and it is happening right now. Changes in climate over the next 100 years will bring changes to the Greater Yellowstone Ecosystem and the Bighorn Basin. These areas will likely get warmer and drier and consequently have lower annual snowpacks. Climate change will affect the distribution of plants and animals in parks, which will change how ecosystems work. All of the natural resource vital signs in our parks are affected by climate change.
To help park managers prepare for these changes, the Greater Yellowstone, Rocky Mountain, and Upper Columbia Basin networks devised a strategy in 2010 for monitoring the effects of climate change. This strategy recommended careful study of climate, snowpack, and the timing of seasonal vegetation changes (land surface phenology). The strategy also called for monitoring climate-threatened species and communities. In our region, these include pika (Ochotona princeps), alpine vegetation, and five-needle pines.
We also work with US Geological Survey scientists to study how changes in climate may impact streams and wetlands throughout the Greater Yellowstone Ecosystem. To understand the consequences of climate change at even larger scales, we participate in the Great Northern Landscape Conservation Cooperative.
Learn more about regional and national climate change through this link:
National Climate Change Response Program
Publications
Source: NPS DataStore Collection 8023. To search for additional information, visit the NPS DataStore.
Source: NPS DataStore Collection 4109. To search for additional information, visit the NPS DataStore.
Source: NPS DataStore Collection 4071. To search for additional information, visit the NPS DataStore.
Source: NPS DataStore Collection 9175. To search for additional information, visit the NPS DataStore.
Data Visualizers
Climate Analyzer: Make your own climate graphs and tables based on precipitation and air temperature data from weather stations in and around national parks.
USGS National Climate Change Viewer: This tool allows users to visualize projected changes in climate and the water balance based on modeling.
Articles
Last updated: June 12, 2025
