Part of a series of articles titled Park Air Profiles.
Article
Park Air Profiles - Mesa Verde National Park
Air Quality at Mesa Verde National Park
Most visitors expect clean air and clear views in parks. Mesa Verde National Park (NP), Colorado, is well known for the archeological heritage of the Ancestral Pueblo people that it preserves. The park is also affected by air pollution from coal-fired power plants in the Four Corners region, nearby mining, and urban and industrial pollutants from the Southwestern US, California, and Mexico. Air pollutants blown into the park can harm natural and scenic resources such as soils, surface waters, plants, wildlife, and visibility. The National Park Service works to address air pollution effects at Mesa Verde NP, and in parks across the U.S., through science, policy and planning, and by doing our part.
Nitrogen and Sulfur

Nitrogen (N) and sulfur (S) compounds deposited from the air may have harmful effects on ecosystem processes. Healthy ecosystems can naturally buffer a certain amount of pollution, but once a threshold is passed the ecosystem may respond negatively. This threshold is the critical load, or the amount of pollution above which harmful changes in sensitive ecosystems occur (Porter 2005). N and S deposition change ecosystems through eutrophication (N deposition) and acidification (N + S deposition). Eutrophication increases soil and water nutrients which causes some species to grow more quickly and changes community composition. Ecosystem sensitivity to nutrient N enrichment at Mesa Verde National Park (MEVE) relative to other national parks is high (Sullivan et al. 2016); for a full list of N sensitive ecosystem components, see: NPS ARD 2019. Acidification leaches important cations from soils, lakes, ponds, and streams which decreases habitat quality. Ecosystem sensitivity to acidification at MEVE relative to other national parks is high (Sullivan et al. 2016); to search for acid-sensitive plant species, see: NPSpecies.
From 2017-2019 total N deposition in MEVE ranged from 2.9 to 3.2 kg-N ha-1 yr-1 and total S deposition of 0.6 kg-S ha-1 yr-1 based on the TDep model (NADP, 2018). MEVE has been monitoring atmospheric N and S deposition since 1981, see the conditions and trends website for park-specific information.
Non-native grasses have been shown to thrive in arid areas with high N deposition, displacing native vegetation adapted to low N conditions and increasing fire risk due to increased biomass (Fenn et al. 2003). Weed density at MEVE has been measured to increase in post-fire environments that tend to support higher soil N levels (Floyd-Hanna et al. 2004), but a direct response to N fertilization in MEVE has not shown a consistent increase in non-native grass species (Reed et al. 2013).
Soils and streams in MEVE are generally well-buffered and unlikely to be acidified by atmospheric deposition (Binkley et al. 1997).
Epiphytic macrolichen community responses
Epiphytic macrolichens grow on tree trunks, branches, and boles. Since these lichens grow above the ground, they obtain all their nutrients directly from precipitation and the air. Many epiphytic lichen species have narrow environmental niches and are extremely sensitive to changes in air pollution. Geiser et al. (2019) used a U.S. Forest Service national survey to develop critical loads of nitrogen (N) and critical loads of sulfur (S) to prevent more than a 20% decline in four lichen community metrics: total species richness, pollution sensitive species richness, forage lichen abundance, and cyanolichen abundance.
McCoy et al. (2021) used forested area from the National Land Cover Database to estimate the impact of air pollution on epiphytic lichen communities. Forested area makes up 64 km2 (29.7%) of the land area of Mesa Verde National Park.
- N deposition exceeded the 3.1 kg-N ha-1 yr-1 critical load to protect N-sensitive lichen species richness in 98.5% of the forested area.
- S deposition was below the 2.7 kg-S ha-1 yr-1 critical load to protect S-sensitive lichen species richness in every part of the forested area.
For exceedances of other lichen metrics and the predicted decline of lichen communities see Appendices A and B of McCoy et al. (2021).
Additional modeling was done on 459 lichen species to test the combined effects of air pollution and climate gradients (Geiser et al. 2021). A critical load indicative of initial shifts from pollution-sensitive toward pollution-tolerant species occurred at 1.5 kg-N ha-1 yr-1 and 2.7 kg-S ha-1 yr-1 even under changing climate regimes.
Plant species response
Plants vary in their tolerance of eutrophication and acidification, and some plant species respond to nitrogen (N) or sulfur (S) pollution with declines in growth, survival, or abundance on the landscape. Horn et al. (2018) used the U.S. Forest Service national forest survey to develop critical loads of N and critical loads of S to prevent declines in growth or survival of sensitive tree species. Clark et al. (2019) used a database of plant community surveys to develop critical loads of N and critical loads of S to prevent a decline in abundance of sensitive herbaceous plant species. According to NPSpecies, Mesa Verde National Park contains:
- 3 N-sensitive tree species and 23 N-sensitive herbaceous species.
- 6 S-sensitive tree species and 20 S-sensitive herbaceous species.
Mycorrhizal fungi community response
Many plants have a symbiotic relationship with mycorrhizal fungi (MF). Through the roots, the plants supply the fungi with carbon from photosynthesis and in exchange the MF enhance nutrient availability within soils, increase drought tolerance, and provide physical resistance to soil erosion (George et al., 1995; Cheng et al., 2021; Burri et al., 2013). Anthropogenic Nitrogen (N) deposition can disrupt this symbiotic relationship resulting in a shift from N sensitive to N tolerant mycorrhizal fungi and plant communities.
With increased N deposition to the soil, MF become less important for nutrient uptake and many plants will cease the exchange of nutrients altogether making them more vulnerable to stressors such as drought (Lilleskov et al., 2019). The CL-N for the shift in mycorrhizal community is 5-6 kg-N ha-1 yr-1 in coniferous forests and 10-20 kg-N ha-1 yr-1 broadleaf forests.
Mesa Verde National Park has 81.2 km2 of coniferous forests, 17 km2 of broadleaf forests, and 0.2 km2 of mixed forests. Using the range in critical loads above, the minimum CL is exceeded in 0% of forested area and the maximum CL is exceeded in 0% of forested area based on 2019-2021 TDep Total N deposition.
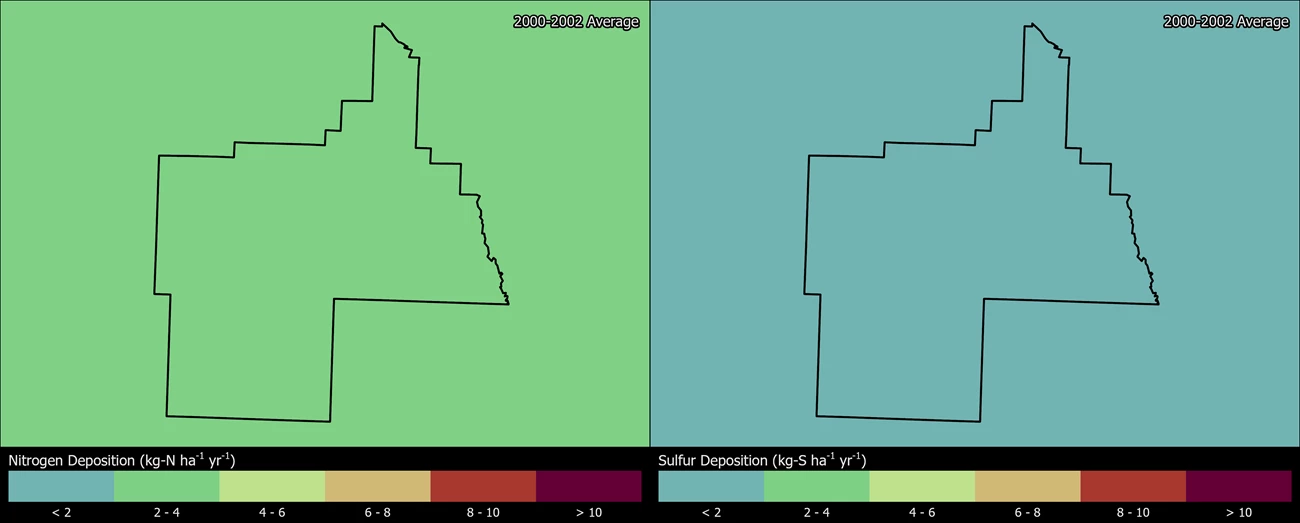
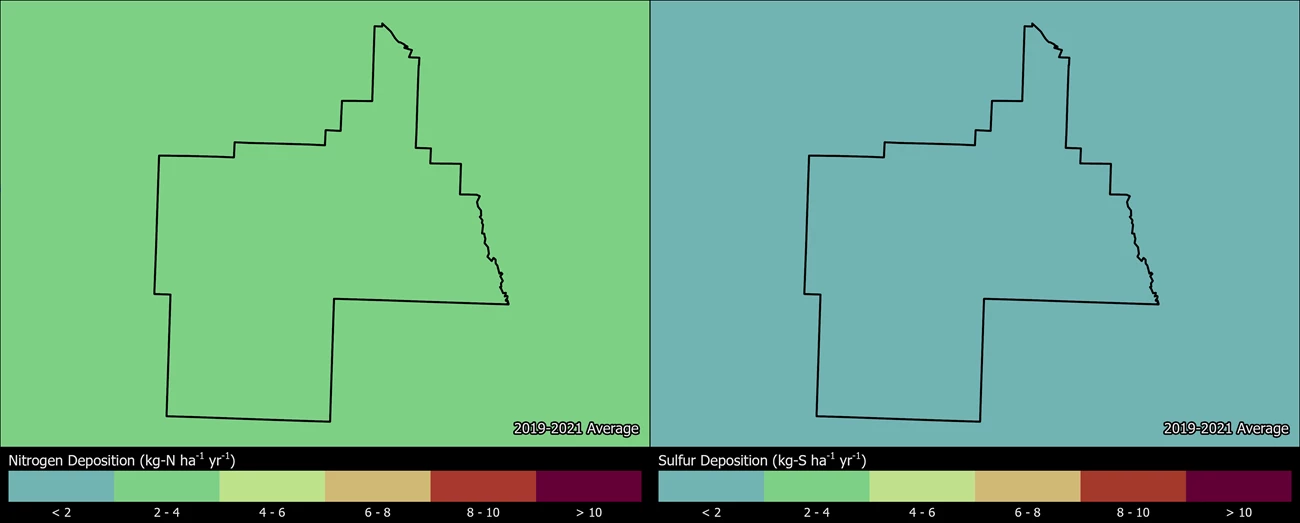
Change in N and S deposition from 2000 to 2021
The maps below show how the spatial distribution of estimated Total N and Total S deposition in MEVE has changed from 2000-2002 to 2019-2021 (TDep MMF version 2022.02). Slide the arrows in the middle of the image up and down to compare N and S deposition between the two years (Yearly Data).
- Minimum N deposition decreased from 2.7 to 2.2 kg-N ha-1 yr-1 and maximum N deposition decreased from 3.7 to 2.8 kg-N ha-1 yr-1.
- Minimum S deposition decreased from 1.2 to 0.4 kg-S ha-1 yr-1 and maximum S deposition decreased from 1.6 to 0.5 kg-S ha-1 yr-1.
Persistent Pollutants
Pollutants like mercury and pesticides are concerning because they are persistent and toxic in the environment. These contaminants can travel in the air thousands of miles away from the source of pollution, even depositing in protected places like national parks. In addition, while some of these harmful pollutants may be banned from use, historically contaminated sites continue to endure negative environmental consequences.
When deposited, airborne mercury and other toxic air contaminants are known to harm wildlife like birds and fish, and cause human health concerns. Many of these substances enter the food chain and accumulate in the tissues of organisms causing reduced reproductive success, impaired growth and development, and decreased survival.
- Mesa Verde experiences high levels of mercury dry deposition, despite the national MATS rule limiting emissions. A study at Mesa Verde showed a statistically significant increase in mercury dry deposition between 2009-2011 (pre-MATS) and 2017-2019 (post-MATS). Evidence suggests that local mercury emissions from nearby cities and oil/gas production areas, as well as large regional wildfires, notably contribute to dry deposition of mercury at Mesa Verde NP (Sather et al. 2021).
- Mercury concentrations in fish sampled at Mesa Verde did not exceed any thresholds for fish toxicity, bird toxicity, or US EPA’s human consumption guidance. Speckled dace (prey fish) were sampled and analyzed for mercury from one site at the park and compared to data across 21 western parks. The average fish mercury concentration (74.9 ng/g ww) was slightly lower than the study-wide mean (77.7 ng/g ww). However, the data may not reflect the risk at other unsampled locations in the park (Eagles-Smith et al. 2014).
- Related studies found mercury in fish exceeding wildlife and human health consumption thresholds (CDPHE 2009; Peterson et al. 2007) and elevated levels of mercury in lake sediments and zooplankton (Nydick 2010). However, a pilot study of mercury in park biota did not find elevated mercury levels in songbirds, invertebrates, stream fish, or crayfish (Nydick and Williams 2010). Fish consumption advisories may be in effect for mercury and other contaminants (NPS 2022).
The NPS Air Resources Division reports on park conditions and trends for mercury. Visit the webpage to learn more.
Visibility

Visitors come to Mesa Verde NP to enjoy a spectacular look into the lives of the park’s early inhabitants, the Ancestral Puebloans who made it their home from the years 600 to 1300. Unimpaired visibility has special importance at Mesa Verde NP from a historical context. The Ancestral Puebloans were highly dependent on visual contact for long-distance communication. Preserving clear views is critical for understanding of this culture and sharing the experience of distant viewing with current and future generations.
Unfortunately, park vistas are sometimes obscured by haze, reducing how well and how far people can see. Visibility reducing haze is caused by tiny particles in the air, and these particles can also affect human health. Many of the same pollutants that ultimately fall out as nitrogen and sulfur deposition contribute to this haze. Organic compounds, soot, and dust reduce visibility as well. Mesa Verde NP participates in a multi-agency dust monitoring network spread across the Colorado plateau. A special sampler collects airborne particles, while a live webcam records dust storms in the area. Large dust deposition events that reduce visibility and cause restrictions in air traffic have occurred. Dust deposited on snow can also cause the early onset of snowmelt reducing spring runoff.
Significant improvements in park visibility on the clearest days have been documented since the 1990’s. Overall, visibility in the park still needs improvement to reach the Clean Air Act goal of no human caused impairment.Visibility effects:
- Reduced visibility sometimes due to human-caused haze and fine particles of air pollution, including dust;
- Reduction of the average natural visual range from about 175 miles (without the effects of pollution) to about 130 miles because of pollution at the park;
- Reduction of the visual range to below 90 miles on high pollution days.
Visit the NPS air quality conditions and trends website for park-specific visibility information. Mesa Verde NP has been monitoring visibility since 1989. View live webcams and explore air monitoring »
Ground-Level Ozone

At ground level, ozone is harmful to human health and the environment. Ground-level ozone does not come directly from smokestacks or vehicles, but instead is formed when other pollutants, mainly nitrogen oxides and volatile organic compounds, react in the presence of sunlight.
Over the course of a growing season, ozone can damage plant tissues making it harder for plants to produce and store food. It also weakens plants making them less resistant to disease and insect infestations. The risk of injury to plants is generally low in the park (Kohut 2004) partly because in arid areas plants close leaf stomata to limit moisture loss, which also limits ozone uptake. No signs of ozone damage to plant leaves have been reported in or near to the park (Binkley et al. 1997; Nydick 2009). Some plants are more sensitive to ozone than others. Ozone-sensitive plant species in Mesa Verde NP include Populus tremuloides (quaking aspen), Apocynum androsaemifolium (spreading dogbane), and Rhus trilobata (skunkbush). Search for more ozone-sensitive plant species found at Mesa Verde NP.
Visit the NPS air quality conditions and trends website for park-specific ozone information. Mesa Verde NP has been monitoring ozone since 1993. View live ozone and meteorology data, and explore air monitoring »
Explore Other Park Air Profiles
There are 47 other Park Air Profiles covering parks across the United States and its territories.
References
Binkley, D., Giardina, C., Dockersmith, I., Morse, D., Scruggs, M., Tonnessen, K. 1997. Status of Air Quality and Related Values in Class I National Parks and Monuments of the Colorado Plateau. National Park Service, Air Resources Division, Denver, Colorado. Chapter 11: Mesa Verde National Park. Available at https://irma.nps.gov/DataStore/Reference/Profile/167034.
Burri, K., C. Gromke, and F. Graf. "Mycorrhizal fungi protect the soil from wind erosion: a wind tunnel study." Land Degradation & Development 24.4 (2013): 385-392.
[CDPHE] Colorado Department of Public Health and Environment. 2009. Colorado Fish Tissue Study. Available at https://www.colorado.gov/cdphe/wq-fish-consumption.
Cheng, Shen, et al. "Elucidating the mechanisms underlying enhanced drought tolerance in plants mediated by arbuscular mycorrhizal fungi." Frontiers in Microbiology 12 (2021): 809473.
Clark, C.M., Simkin, S.M., Allen, E.B. et al. Potential vulnerability of 348 herbaceous species to atmospheric deposition of nitrogen and sulfur in the United States. Nat. Plants 5, 697–705 (2019). https://doi.org/10.1038/s41477-019-0442-8
Eagles-Smith, C.A., J.J. Willacker, and C.M.Flanagan Pritz. 2014. Mercury in fishes from 21 national parks in the Western United States—Inter and intra-park variation in concentrations and ecological risk: U.S. Geological Survey Open-File Report 2014-1051, 54 p. Available at: http://dx.doi.org/10.3133/ofr20141051
Fenn, M. E., Baron, J. S., Allen, E. B., Rueth, H. M., Nydick, K. R., Geiser, L., Bowman, W. D., Sickman, J. O., Meixner, T., Johnson, D. W., & Neitlich, P. (2003). Ecological effects of nitrogen deposition in the western United States. BioScience, 53(4), 404-420. https://doi.org/10.1641/0006-3568(2003)053[0404:EEONDI]2.0.CO;2
Fenn, M. E., Haeuber, R., Tonnesen, G. S., Baron, J. S., Grossman-Clarke, S., Hope, D., Jaffe, D. A., Copeland, S., Geiser, L., Rueth, H. M., and Sickman, J. O. 2003. Nitrogen emissions, deposition and monitoring in the western United States. Bioscience 53: 391–403.
Floyd-Hanna, L., Hanna, D., Romme, W. H., Crews, T. 2004. Non-native invasions following fire in Southwestern Colorado: Long-term effectiveness of mitigation treatments and future predictions. Joint Fire Science Program, product number 1496–BLM2–454.
Four Corners Air Quality Task Force. 2007. Four Corners Air Quality Task Force Report of Mitigation Options. Available at https://www.env.nm.gov/air-quality/fcaqg/.
Geiser, Linda & Nelson, Peter & Jovan, Sarah & Root, Heather & Clark, Christopher. (2019). Assessing Ecological Risks from Atmospheric Deposition of Nitrogen and Sulfur to US Forests Using Epiphytic Macrolichens. Diversity. 11. 87. 10.3390/d11060087.
Geiser, Linda & Root, Heather & Smith, Robert & Jovan, Sarah & Clair, Larry & Dillman, Karen. (2021). Lichen-based critical loads for deposition of nitrogen and sulfur in US forests. Environmental Pollution. 291. 118187. 10.1016/j.envpol.2021.118187.
George, Eckhard, Horst Marschner, and Iver Jakobsen. "Role of arbuscular mycorrhizal fungi in uptake of phosphorus and nitrogen from soil." Critical reviews in biotechnology 15.3-4 (1995): 257-270.
Horn KJ, Thomas RQ, Clark CM, Pardo LH, Fenn ME, Lawrence GB, et al. (2018) Growth and survival relationships of 71 tree species with nitrogen and sulfur deposition across the conterminous U.S.. PLoS ONE 13(10): e0205296. https://doi.org/10.1371/journal.pone.0205296
Kohut, R. 2004. Assessing the Risk of Foliar Injury from Ozone on Vegetation in Parks in the Southern Colorado Plateau Network. Available at https://irma.nps.gov/DataStore/Reference/Profile/2181544
Lilleskov, Erik A., et al. "Atmospheric nitrogen deposition impacts on the structure and function of forest mycorrhizal communities: a review." Environmental Pollution 246 (2019): 148-162.
McCoy K., M. D. Bell, and E. Felker-Quinn. 2021. Risk to epiphytic lichen communities in NPS units from atmospheric nitrogen and sulfur pollution: Changes in critical load exceedances from 2001‒2016. Natural Resource Report NPS/NRSS/ARD/NRR—2021/2299. National Park Service, Fort Collins, Colorado. https://doi.org/10.36967/nrr-2287254.
[NADP] National Atmospheric Deposition Program. 2018. NTN Data. Accessed January 20, 2022. Available at http://nadp.slh.wisc.edu/NADP/
[NPS] National Park Service. 2022. Fish Consumption Advisories. https://www.nps.gov/subjects/fishing/fish-consumption-advisories.htm
Nydick, K. 2009. Assessment of Foliar Ozone Injury: Pilot Project. A Report to the San Juan Public Lands Center (USFS/BLM). Mountain Studies Institute, San Juan Mountains, Colorado.
Nydick, K. 2010. Mercury in Precipitation and Lakes of Southwestern Colorado. Mountain Studies Institute Report 2010-02.
Nydick, K. and Williams, K. 2010. Final Report: Pilot Study of the Ecological Effects of Mercury Deposition in Mesa Verde National Park, Colorado. Mountain Studies Institute Report 2010-01. https://irma.nps.gov/DataStore/Reference/Profile/2293398
Peterson, S. A., Van Sickle, J., Herlihy, A. T., and Hughes, R. M. 2007. Mercury Concentration in Fish from Streams and Rivers throughout the Western United States. Environ. Sci. Technol. 41: 58–65. https://irma.nps.gov/DataStore/Reference/Profile/2171923
Porter, E., Blett, T., Potter, D.U., Huber, C. 2005. Protecting resources on federal lands: Implications of critical loads for atmospheric deposition of nitrogen and sulfur. BioScience 55(7): 603–612. https://doi.org/10.1641/0006-3568(2005)055[0603:PROFLI]2.0.CO;2
Reed, S. C., J. Belnap, L. Floyd-Hanna, T. Crews, J. Herring, D. Hanna, M. E. Miller, M. C. Duniway, and C. M. Roybal. 2013. Assessing the risk of nitrogen deposition to natural resources in the Four Corners area. Report.
Sather, Mark E., Shaibal Mukerjee, Luther Smith, Johnson Mathew, Clarence Jackson, Michael Flournoy. 2021. Gaseous Oxidized mercury dry deposition measurements in the Four Corners area, U.S.A., after large power plant mercury emission reductions. Atmospheric Pollution Research 12(1): 148-158. https://doi.org/10.1016/j.apr.2020.08.030
Sullivan, T. J. 2016. Air quality related values (AQRVs) in national parks: Effects from ozone; visibility reducing particles; and atmospheric deposition of acids, nutrients and toxics. Natural Resource Report NPS/NRSS/ARD/NRR—2016/1196. National Park Service, Fort Collins, CO.
Last updated: August 6, 2024