Part of a series of articles titled Park Air Profiles.
Article
Park Air Profiles - Mammoth Cave National Park
Air Quality at Mammoth Cave National Park
Most visitors expect clean air and clear views in parks. However, Mammoth Cave National Park (NP), Kentucky, home to the world’s longest recorded cave system and scenic river valleys, experiences relatively poor air quality. The park is downwind of many sources of air pollution, including power plants, urban areas, and industry in Kentucky and Tennessee. Pollutants emitted from these sources can harm the park’s natural and scenic resources such as upland surface waters, plants, fish, bats, and visibility. The National Park Service works to address air pollution effects at Mammoth Cave NP, and in parks across the U.S., through science, policy and planning, and by doing our part.
Nitrogen and Sulfur

Nitrogen (N) and sulfur (S) compounds deposited from the air may have harmful effects on ecosystem processes. Healthy ecosystems can naturally buffer a certain amount of pollution, but once a threshold is passed the ecosystem may respond negatively. This threshold is the critical load, or the amount of pollution above which harmful changes in sensitive ecosystems occur (Porter 2005). N and S deposition change ecosystems through eutrophication (N deposition) and acidification (N + S deposition). Eutrophication increases soil and water nutrients which causes some species to grow more quickly and changes community composition. Ecosystem sensitivity to nutrient N enrichment at Mammoth Cave National Park (MACA) relative to other national parks is very low (Sullivan et al. 2016); for a full list of N sensitive ecosystem components, see: NPS ARD 2019. Acidification leaches important cations from soils, lakes, ponds, and streams which decreases habitat quality. Ecosystem sensitivity to acidification at MACA relative to other national parks is high (Sullivan et al. 2016); to search for acid-sensitive plant species, see: NPSpecies.
From 2017-2019 total N deposition in MACA ranged from 9.5 to 10.3 kg-N ha-1 yr-1 and total S deposition ranged from 2.8 to 3.1 kg-S ha-1 yr-1 based on the TDep model (NADP, 2018). MACA has been monitoring atmospheric N and S deposition since 2002, see the conditions and trends website for park-specific information.
Seeps and surface waters that flow from limestone bedrock in MACA are well-buffered from acidification effects. Some soils, sandstone ridges, and dry upland areas may be more sensitive to acid deposition. There is a particular concern that during rainstorms, when there is little opportunity for rainwater to interact with deep soils, episodic acidification could occur.
Epiphytic macrolichen community responses
Epiphytic macrolichens grow on tree trunks, branches, and boles. Since these lichens grow above the ground, they obtain all their nutrients directly from precipitation and the air. Many epiphytic lichen species have narrow environmental niches and are extremely sensitive to changes in air pollution. Geiser et al. (2019) used a U.S. Forest Service national survey to develop critical loads of nitrogen (N) and critical loads of sulfur (S) to prevent more than a 20% decline in four lichen community metrics: total species richness, pollution sensitive species richness, forage lichen abundance, and cyanolichen abundance.
McCoy et al. (2021) used forested area from the National Land Cover Database to estimate the impact of air pollution on epiphytic lichen communities. Forested area makes up 201 km2 (96.2%) of the land area of Mammoth Cave National Park.
- N deposition exceeded the 3.1 kg-N ha-1 yr-1 critical load to protect N-sensitive lichen species richness in 100% of the forested area.
- S deposition exceeded the 2.7 kg-S ha-1 yr-1 critical load to protect S-sensitive lichen species richness in 100% of the forested area.
For exceedances of other lichen metrics and the predicted decline of lichen communities see Appendices A and B of McCoy et al. (2021).
Additional modeling was done on 459 lichen species to test the combined effects of air pollution and climate gradients (Geiser et al. 2021). A critical load indicative of initial shifts from pollution-sensitive toward pollution-tolerant species occurred at 1.5 kg-N ha-1 yr-1 and 2.7 kg-S ha-1 yr-1 even under changing climate regimes.
Plant species response
Plants vary in their tolerance of eutrophication and acidification, and some plant species respond to nitrogen (N) or sulfur (S) pollution with declines in growth, survival, or abundance on the landscape. Horn et al. (2018) used the U.S. Forest Service national forest survey to develop critical loads of N and critical loads of S to prevent declines in growth or survival of sensitive tree species. Clark et al. (2019) used a database of plant community surveys to develop critical loads of N and critical loads of S to prevent a decline in abundance of sensitive herbaceous plant species. According to NPSpecies, Mammoth Cave National Park contains:
- 31 N-sensitive tree species and 96 N-sensitive herbaceous species.
- 35 S-sensitive tree species and 78 S-sensitive herbaceous species.
Mycorrhizal fungi community response
Many plants have a symbiotic relationship with mycorrhizal fungi (MF). Through the roots, the plants supply the fungi with carbon from photosynthesis and in exchange the MF enhance nutrient availability within soils, increase drought tolerance, and provide physical resistance to soil erosion (George et al., 1995; Cheng et al., 2021; Burri et al., 2013). Anthropogenic Nitrogen (N) deposition can disrupt this symbiotic relationship resulting in a shift from N sensitive to N tolerant mycorrhizal fungi and plant communities.
With increased N deposition to the soil, MF become less important for nutrient uptake and many plants will cease the exchange of nutrients altogether making them more vulnerable to stressors such as drought (Lilleskov et al., 2019). The CL-N for the shift in mycorrhizal community is 5-6 kg-N ha-1 yr-1 in coniferous forests and 10-20 kg-N ha-1 yr-1 broadleaf forests.
Mammoth Cave National Park has 18.3 km2 of coniferous forests, 176.1 km2 of broadleaf forests, and 14.1 km2 of mixed forests. Using the range in critical loads above, the minimum CL is exceeded in 68.5% of forested area and the maximum CL is exceeded in 8.8% of forested area based on 2019-2021 TDep Total N deposition.
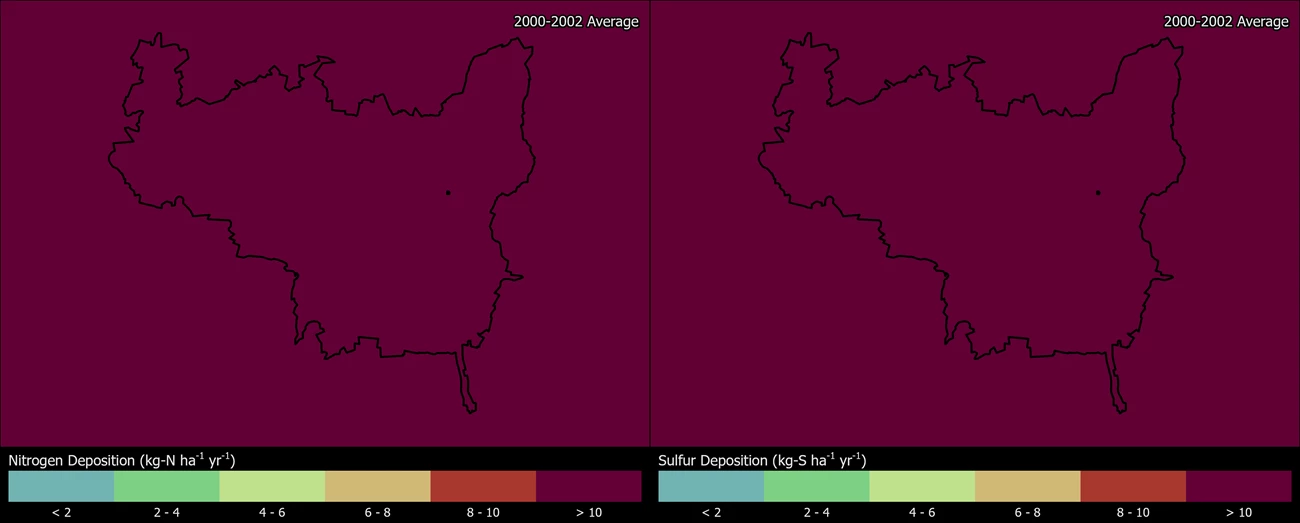
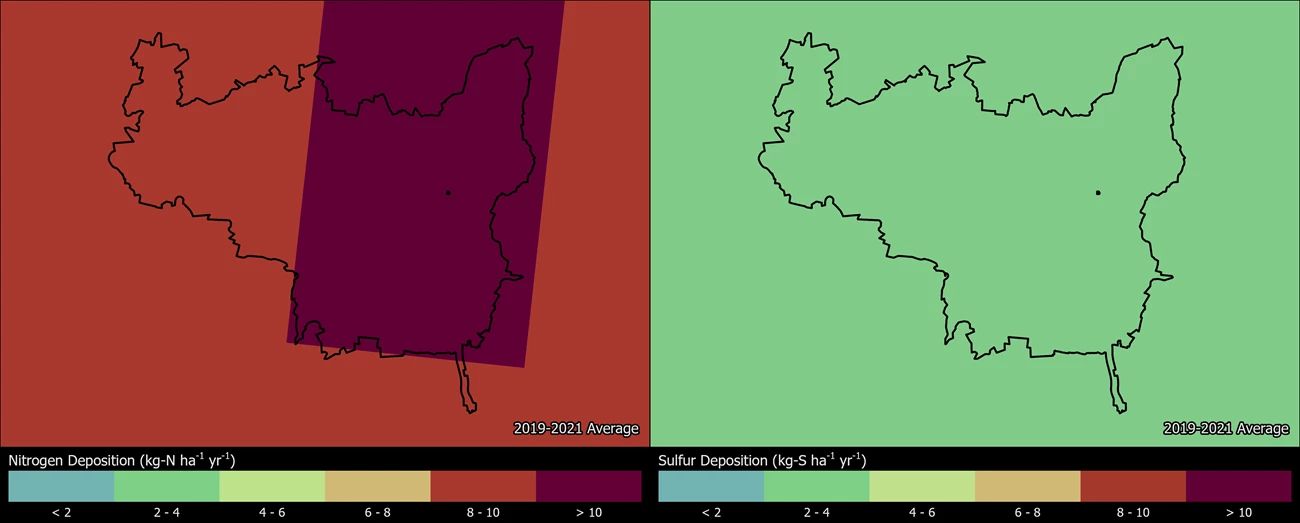
Change in N and S deposition from 2000 to 2021
The maps below show how the spatial distribution of estimated Total N and Total S deposition in MACA has changed from 2000-2002 to 2019-2021 (TDep MMF version 2022.02). Slide the arrows in the middle of the image up and down to compare N and S deposition between the two years (Yearly Data).
- Minimum N deposition decreased from 13.0 to 9.7 kg-N ha-1 yr-1 and maximum N deposition decreased from 14.9 to 11.1 kg-N ha-1 yr-1.
- Minimum S deposition decreased from 13.9 to 2.5 kg-S ha-1 yr-1 and maximum S deposition decreased from 15.7 to 2.7 kg-S ha-1 yr-1.
Persistent Pollutants
Pollutants like mercury and pesticides are concerning because they are persistent and toxic in the environment. These contaminants can travel in the air thousands of miles away from the source of pollution, even depositing in protected places like national parks. In addition, while some of these harmful pollutants may be banned from use, historically contaminated sites continue to endure negative environmental consequences.
When deposited, airborne mercury and other toxic air contaminants are known to harm wildlife like birds and fish, and cause human health concerns. Many of these substances enter the food chain and accumulate in the tissue of organisms causing reduced reproductive success, impaired growth and development, and decreased survival.
- Mercury concentrations in some fish sampled at Mammoth Cave NP exceeded the threshold for human consumption. Preliminary data from three sites in the park indicate an average fish mercury concentration of 0.218 ppm ww. Mercury concentrations in 27% of fish (n=90) exceeded the US EPA threshold established for human consumption (0.3 ppm ww) (Eagles-Smith et al. 2019). However, the data may not reflect the risk at other unsampled locations in the park. Fish consumption advisories may be in effect for mercury and other contaminants (NPS 2022).
- Some dragonfly larvae sampled at Mammoth Cave NP had mercury concentrations at a moderate impairment level. Dragonfly larvae have been sampled and analyzed for mercury from two sites in the park; 67% of the data fall into the moderate (100-300 ng/g dw) impairment category for potential mercury risk. An index of moderate impairment or higher suggests some fish may exceed the US EPA benchmark for protection of human health (Eagles-Smith et al. 2018; Eagles-Smith et al. 2020).
- Earlier studies also found elevated levels of mercury in park bats, fish, insects, water, and sediment (NPS 2009). Mercury deposition at the park is high compared to other parks (NPS 2010). Mercury deposition at Mammoth Cave NP is a concern given numerous nearby coal-burning power plants, which are significant sources of airborne mercury.
The NPS Air Resources Division reports on park conditions and trends for mercury. Visit the webpage to learn more.
Visibility

Visitors come to Mammoth Cave NP not only to explore the vast and complex underground labyrinths, but also to enjoy vistas of the Green River valley and hill country of South Central Kentucky. Unfortunately, these scenic views are often affected by haze that reduces how well and how far people can see. Visibility reducing haze is caused by tiny particles in the air, and these particles can also affect human health. Many of the same pollutants that ultimately fall out as nitrogen and sulfur deposition contribute to this haze. Organic compounds, soot, and dust reduce visibility as well. Significant improvements in park visibility have been documented since the 1990’s. Still, visibility in the park is a long way from the Clean Air Act goal of no human caused impairment.
Visibility effects:
- Reduced visibility due to human-caused haze
- Reduction of the average natural visual range from about 110 miles (without the effects of pollution) to about 50 miles because of pollution at the park
- Reduction of the visual range to below 25 miles on high pollution days
Visit the NPS air quality conditions and trends website for park-specific visibility information. Mammoth Cave NP has been monitoring visibility since 2000. Check out the live air quality webcam and explore air monitoring »
Ground-Level Ozone

At ground level, ozone is harmful to human health and the environment. Ground-level ozone does not come directly from smokestacks or vehicles, but instead is formed when other pollutants, mainly nitrogen oxides and volatile organic compounds, react in the presence of sunlight.
Ozone levels in the park have come down significantly over the past 10 years but still occasionally exceed the National Ambient Air Quality Standard set by the U.S. Environmental Protection Agency to protect public health. Ozone is a respiratory irritant, causing coughing, sinus inflammation, chest pains, scratchy throat, lung damage, and reduced immune system functions. Children, the elderly, people with existing health problems, and active adults are most vulnerable. When ozone levels exceed, or are predicted to exceed, health standards, Mammoth Cave NP staff post health advisories cautioning visitors of the potential health risks associated with exposures to elevated levels.
Ground-level ozone also weakens plants making them less resistant to disease and insect infestations. There are several ozone-sensitive plants in Mammoth Cave NP including Asclepias syriaca (common milkweed), Liquidambar styraciflua (sweetgum), and Liriodendron tulipifera (tulip poplar). A risk assessment concluded that plants in at Mammoth Cave NP were at high risk for ozone damage (Kohut 2007; Kohut 2004). Assessments in the park have also documented visible ozone injury on the leaves of approximately 25% of Common milkweed plants surveyed (CUPN 2010). Sweetgum and Tulip poplar have also shown ozone damage on leaves. Search ozone-sensitive plant species found at Mammoth Cave NP.
Visit the NPS air quality conditions and trends website for park-specific ozone information. Mammoth Cave NP has been monitoring ozone since 1997. Check out the live ozone and meteorology data from Mammoth Cave, NP and explore air monitoring »
Explore Other Park Air Profiles
There are 47 other Park Air Profiles covering parks across the United States and its territories.
References
Burri, K., C. Gromke, and F. Graf. "Mycorrhizal fungi protect the soil from wind erosion: a wind tunnel study." Land Degradation & Development 24.4 (2013): 385-392.
Clark, C.M., Simkin, S.M., Allen, E.B. et al. Potential vulnerability of 348 herbaceous species to atmospheric deposition of nitrogen and sulfur in the United States. Nat. Plants 5, 697–705 (2019). https://doi.org/10.1038/s41477-019-0442-8
Cheng, Shen, et al. "Elucidating the mechanisms underlying enhanced drought tolerance in plants mediated by arbuscular mycorrhizal fungi." Frontiers in Microbiology 12 (2021): 809473.
[CUPN] Cumberland Piedmont Network. 2010. Summary of Results of 2009 Foliar Injury Surveys by Cumberland Piedmont Network. Presented at the National Park Service Air Quality Planning Meeting. January 5-7, 2010. Denver, CO.
Eagles-Smith, C.A., S.J. Nelson., C.M. Flanagan Pritz, J.J. Willacker Jr., and A. Klemmer. 2018. Total Mercury Concentrations in Dragonfly Larvae from U.S. National Parks (ver. 6.0, June 2021): U.S. Geological Survey data release. https://doi.org/10.5066/P9TK6NPT
Eagles-Smith, CA, JJ Willacker, CM Flanagan Pritz, AC Ellsworth. 2019. Total Mercury Concentrations in Fish from 31 National Parks, USA, 2015-2016. USGS Sensitive Data Release. https://irma.nps.gov/DataStore/Reference/Profile/2260288
Eagles-Smith, C.A., J.J. Willacker, S.J. Nelson, C.M. Flanagan Pritz, D.P. Krabbenhoft, C.Y. Chen, J.T. Ackerman, E.H. Campbell Grant, and D.S. Pilliod. 2020. Dragonflies as biosentinels of mercury availability in aquatic food webs of national parks throughout the United States. Environmental Science and Technology 54(14):8779-8790. https://doi.org/10.1021/acs.est.0c01255
Geiser, Linda & Nelson, Peter & Jovan, Sarah & Root, Heather & Clark, Christopher. (2019). Assessing Ecological Risks from Atmospheric Deposition of Nitrogen and Sulfur to US Forests Using Epiphytic Macrolichens. Diversity. 11. 87. 10.3390/d11060087.
Geiser, Linda & Root, Heather & Smith, Robert & Jovan, Sarah & Clair, Larry & Dillman, Karen. (2021). Lichen-based critical loads for deposition of nitrogen and sulfur in US forests. Environmental Pollution. 291. 118187. 10.1016/j.envpol.2021.118187.
George, Eckhard, Horst Marschner, and Iver Jakobsen. "Role of arbuscular mycorrhizal fungi in uptake of phosphorus and nitrogen from soil." Critical reviews in biotechnology 15.3-4 (1995): 257-270.
Horn KJ, Thomas RQ, Clark CM, Pardo LH, Fenn ME, Lawrence GB, et al. (2018) Growth and survival relationships of 71 tree species with nitrogen and sulfur deposition across the conterminous U.S.. PLoS ONE 13(10): e0205296. https://doi.org/10.1371/journal.pone.0205296
Kohut R.J. 2007. Ozone Risk Assessment for Vital Signs Monitoring Networks, Appalachian National Scenic Trail, and Natchez Trace National Scenic Trail. NPS/NRPC/ARD/NRTR—2007/001. National Park Service. Fort Collins, Colorado. Available at https://www.nps.gov/articles/ozone-risk-assessment.htm
Lilleskov, Erik A., et al. "Atmospheric nitrogen deposition impacts on the structure and function of forest mycorrhizal communities: a review." Environmental Pollution 246 (2019): 148-162.
McCoy K., M. D. Bell, and E. Felker-Quinn. 2021. Risk to epiphytic lichen communities in NPS units from atmospheric nitrogen and sulfur pollution: Changes in critical load exceedances from 2001‒2016. Natural Resource Report NPS/NRSS/ARD/NRR—2021/2299. National Park Service, Fort Collins, Colorado. https://doi.org/10.36967/nrr-2287254.
[NADP] National Atmospheric Deposition Program. 2018. NTN Data. Accessed January 20, 2022. Available at http://nadp.slh.wisc.edu/NADP/
[NPS] National Park Service. 2009. Assessing the Impact of Mercury Bioaccumulation in Cumberland Piedmont Park Units. PMIS 110144. National Park Service Annual Report.
[NPS] National Park Service. 2010. Air Quality in National Parks: 2009 Annual Performance and Progress Report. Natural Resource Report NPS/NRPC/ARD/NRR–2010/266. National Park Service, Denver, Colorado. Available at https://irma.nps.gov/DataStore/Reference/Profile/2166247
[NPS] National Park Service. 2022. Fish Consumption Advisories. https://www.nps.gov/subjects/fishing/fish-consumption-advisories.htm
Porter, E., Blett, T., Potter, D.U., Huber, C. 2005. Protecting resources on federal lands: Implications of critical loads for atmospheric deposition of nitrogen and sulfur. BioScience 55(7): 603–612. https://doi.org/10.1641/0006-3568(2005)055[0603:PROFLI]2.0.CO;2
Sullivan, T. J. 2016. Air quality related values (AQRVs) in national parks: Effects from ozone; visibility reducing particles; and atmospheric deposition of acids, nutrients and toxics. Natural Resource Report NPS/NRSS/ARD/NRR—2016/1196. National Park Service, Fort Collins, CO.
Last updated: July 23, 2024