Part of a series of articles titled Park Air Profiles.
Article
Park Air Profiles - Lava Beds National Monument

Dan Duriscoe / NPS
Air Quality at Lava Beds National Monument
Most people who visit national parks expect clean air and clear views. Lava Beds National Monument (NM), California is well known for its many volcanic formations including cinder cones and lava flows, and experiences relatively good air quality. This is in part because of low population density nearby. The park’s natural and scenic resources such as visibility, vegetation, soils, and wildlife can be affected by local and regional sources of air pollution. These include vehicles, power plants, agriculture, proposed geothermal energy production, wood-fired industrial boilers, and wildfires. The National Park Service works to address air pollution effects at Lava Beds NP, and in parks around the U.S., through science, policy and planning, and by doing our part.
At Lava Beds National Monument particles, nitrogen, and ozone affect natural resources including vegetation and wildlife, and visibility of scenic vistas.
Nitrogen and Sulfur
Nitrogen (N) and sulfur (S) compounds deposited from the air may have harmful effects on ecosystem processes. Healthy ecosystems can naturally buffer a certain amount of pollution, but once a threshold is passed the ecosystem may respond negatively. This threshold is the critical load, or the amount of pollution above which harmful changes in sensitive ecosystems occur (Porter 2005). N and S deposition change ecosystems through eutrophication (N deposition) and acidification (N + S deposition). Eutrophication increases soil and water nutrients which causes some species to grow more quickly and changes community composition. Ecosystem sensitivity to nutrient N enrichment at Lava Beds National Monument (LABE) relative to other national parks is very low (Sullivan et al. 2016); for a full list of N sensitive ecosystem components, see: NPS ARD 2019. Acidification leaches important cations from soils, lakes, ponds, and streams which decreases habitat quality. Ecosystem sensitivity to acidification at LABE relative to other national parks is very high (Sullivan et al. 2016); to search for acid-sensitive plant species, see: NPSpecies.
From 2017-2019 total N deposition in LABE ranged from 1.6 to 2.3 kg-N ha-1 yr-1 and total S deposition ranged from 0.3 to 0.5 kg-S ha-1 yr-1 based on the TDep model (NADP, 2018). See the conditions and trends website for park-specific information on N and S deposition at LABE.
Surface waters in LABE are confined to a few seeps that can be sensitive to N. These seeps provide habitats for ferns in cave entrances and collapsed structures that are not found in the surrounding semi-arid landscape. Ferns in these micro-wetland refuges are remarkable for both species diversity and the number of populations present. Ferns are potentially sensitive to eutrophication from N deposition at LABE. In southern California, increased N deposition has contributed to spreading annual grasses and increased fire risk in shrublands at Joshua Tree National Park (Rao et al. 2010).
Epiphytic macrolichen community responses
Epiphytic macrolichens grow on tree trunks, branches, and boles. Since these lichens grow above the ground, they obtain all their nutrients directly from precipitation and the air. Many epiphytic lichen species have narrow environmental niches and are extremely sensitive to changes in air pollution. Geiser et al. (2019) used a U.S. Forest Service national survey to develop critical loads of nitrogen (N) and critical loads of sulfur (S) to prevent more than a 20% decline in four lichen community metrics: total species richness, pollution sensitive species richness, forage lichen abundance, and cyanolichen abundance.
McCoy et al. (2021) used forested area from the National Land Cover Database to estimate the impact of air pollution on epiphytic lichen communities. Forested area makes up 15.5 km2 (8.2%) of the land area of Lava Beds National Monument.
- N deposition was below the 3.1 kg-N ha-1 yr-1 critical load to protect N-sensitive lichen species richness in every part of the forested area.
- S deposition was below the 2.7 kg-S ha-1 yr-1 critical load to protect S-sensitive lichen species richness in every part of the forested area.
For exceedances of other lichen metrics and the predicted decline of lichen communities see Appendices A and B of McCoy et al. (2021).
Additional modeling was done on 459 lichen species to test the combined effects of air pollution and climate gradients (Geiser et al. 2021). A critical load indicative of initial shifts from pollution-sensitive toward pollution-tolerant species occurred at 1.5 kg-N ha-1 yr-1 and 2.7 kg-S ha-1 yr-1 even under changing climate regimes.
Plant species response
Plants vary in their tolerance of eutrophication and acidification, and some plant species respond to nitrogen (N) or sulfur (S) pollution with declines in growth, survival, or abundance on the landscape. Horn et al. (2018) used the U.S. Forest Service national forest survey to develop critical loads of N and critical loads of S to prevent declines in growth or survival of sensitive tree species. Clark et al. (2019) used a database of plant community surveys to develop critical loads of N and critical loads of S to prevent a decline in abundance of sensitive herbaceous plant species. According to NPSpecies, Lava Beds National Monument contains:
- 2 N-sensitive tree species and 9 N-sensitive herbaceous species.
- 4 S-sensitive tree species and 7 S-sensitive herbaceous species.
Mycorrhizal community response
Many plants have a symbiotic relationship with mycorrhizal fungi (MF). Through the roots, the plants supply the fungi with carbon from photosynthesis and in exchange the MF enhance nutrient availability within soils, increase drought tolerance, and provide physical resistance to soil erosion (George et al., 1995; Cheng et al., 2021; Burri et al., 2013). Anthropogenic Nitrogen (N) deposition can disrupt this symbiotic relationship resulting in a shift from N sensitive to N tolerant mycorrhizal fungi and plant communities.
With increased N deposition to the soil, MF become less important for nutrient uptake and many plants will cease the exchange of nutrients altogether making them more vulnerable to stressors such as drought (Lilleskov et al., 2019). The CL-N for the shift in mycorrhizal community is 5-6 kg-N ha-1 yr-1 in coniferous forests and 10-20 kg-N ha-1 yr-1 broadleaf forests.Lava Beds National Monument has 28 km2 of coniferous forests. Using the range in critical loads above, the minimum CL is exceeded in 0% of forested area and the maximum CL is exceeded in 0% of forested area based on 2019-2021 TDep Total N deposition.
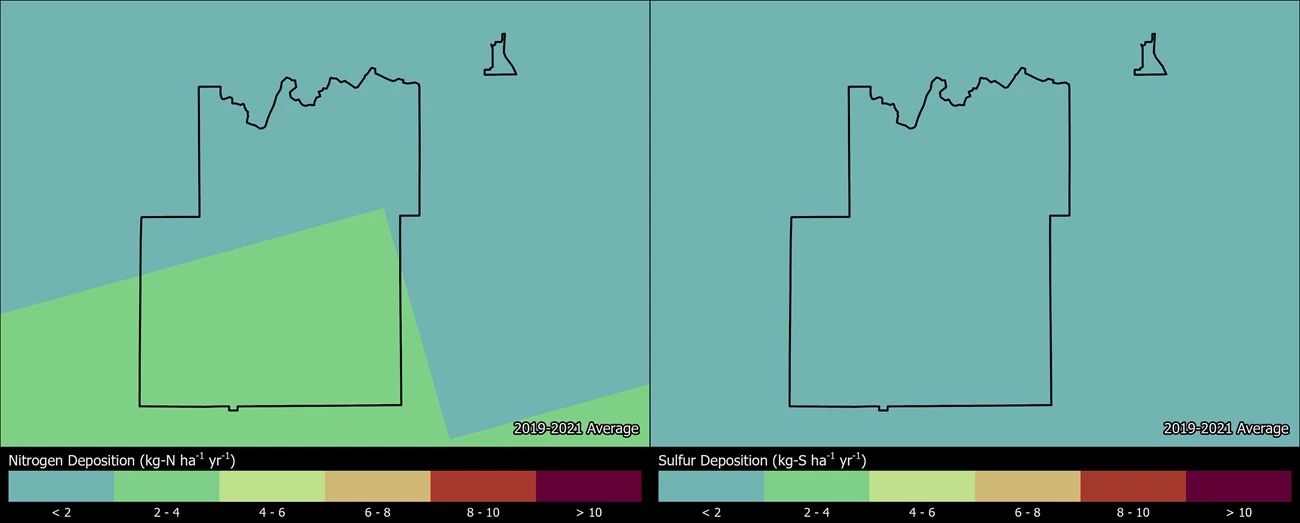
Change in N and S deposition from 2000 to 2021
The maps below show how the spatial distribution of estimated Total N and Total S deposition in LABE has changed from 2000-2002 to 2019-2021 (TDep MMF version 2022.02). Slide the arrows in the middle of the image up and down to compare N and S deposition between the two years (Yearly Data).
- Minimum N deposition decreased from 1.4 to 1.2 kg-N ha-1 yr-1 and maximum N deposition decreased from 3.1 to 2.3 kg-N ha-1 yr-1.
- Minimum S deposition remained at 0.2 kg-S ha-1 yr-1 and maximum S deposition decreased from 0.4 to 0.3 kg-S ha-1 yr-1.

Persistent Pollutants
Pollutants like mercury and pesticides are concerning because they are persistent and toxic in the environment. These contaminants can travel in the air thousands of miles away from the source of pollution, even depositing in protected places like national parks. In addition, while some of these harmful pollutants may be banned from use, historically contaminated sites continue to endure negative environmental consequences.
When deposited, airborne mercury and other toxic air contaminants are known to harm wildlife like birds and fish, and cause human health concerns. Many of these substances enter the food chain and accumulate in the tissue of organisms causing reduced reproductive success, impaired growth and development, and decreased survival.
While there are limited studies on persistent pollutants at Lava Beds NM, an analysis shows that pesticides toxic to fish and bees and most likely to drift into park boundaries due to pesticide application in the counties surrounding Lava Beds NM are fumigants like Methyl Bromide and Chloropicrin (Meyer and DeMars 2018).
Fish consumption advisories may be in effect for mercury and other contaminants (NPS 2022). The NPS Air Resources Division reports on park conditions and trends for mercury. Visit the webpage to learn more.
Visibility

Park vistas of volcanic formations are sometimes obscured by haze, reducing how well and how far people can see. Visibility reducing haze is caused by tiny particles in the air. Many of the same pollutants that ultimately fall out as nitrogen and sulfur deposition contribute to this haze. Organic compounds, soot, dust, and wood smoke reduce visibility as well.
Visibility effects:
- At times, reduced visibility due to human-caused haze and fine particles of air pollution
- Reduction of the average natural visual range from about 160 miles (without the effects of pollution) to about 130 miles because of pollution at the park
- Reduction of the visual range to below 60 miles on high pollution days
Visit the NPS air quality conditions and trends website for park-specific visibility information. Explore scenic vistas through a live webcam at Lava Beds National Monument.
Lava Beds National Monument has been monitoring visibility since 2000. Explore air monitoring »
Ground-Level Ozone

At ground level, ozone is harmful to human health and the environment. Ground-level ozone does not come directly from smokestacks or vehicles, but instead is formed when other pollutants, mainly nitrogen oxides and volatile organic compounds, react in the presence of sunlight.
Over the course of a growing season, ozone can damage plant tissues making it harder for plants to grow and store carbon. Ozone causes leaf injuries like bleaching or dark spots on some sensitive plants. There are 4 plants that may display ozone leaf injury at Lava Beds National Monument. Search ozone-sensitive plant species found at Lava Beds National Monument.
US Environmental Protection Agency and NPS found in ozone exposure experiments that ozone slowed tree seedling growth. NPS uses W126 values from averaged seedling responses in those experiments to describe park condition in terms of Vegetation Health. Ozone affects actively growing plants, so the W126 metric weights a sum of ozone concentrations during daylight hours over three months in the growing season.
A recent re-analysis of the seedling experiments established critical levels of ozone protective of each tree species tested (Lee et al. 2022). The ozone critical levels are W126 values that will prevent 5% or greater deficit in tree seedling biomass. Air Quality Conditions and Trends reports a 5-year average of W126 for each park. In 2018-2022, the average W126 value for Lava Beds National Monument was 9.0 ppm-h. Based on this ozone level, trees present in the park (NPSpecies) are at risk of the following ozone effects:
-
The tree species ponderosa pine (Pinus ponderosa), with an ozone critical level of 6 ppm-h, is at risk of 7% biomass deficit in seedlings. Tree species quaking aspen (Populus tremuloides), with an ozone critical level of 9 ppm-h, is at risk of 5% deficit in seedlings.
Ozone critical levels are for tree seedlings, which represent the regenerative capacity and long-term stability of sensitive species within a forest. These tree species are also known to be sensitive to ozone as adults (Bell et al. 2020), but critical values for seedling growth do not predict ozone effects on mature trees. Air Resources Division is currently working with collaborators to establish critical levels for mature trees using data from forest monitoring plots.
Ozone causes growth deficits in non-woody plants as well as in trees. Ozone critical levels have been established to protect non-woody plants that grow in European meadows and grasslands (Van Goethem et al. 2013). Twenty herb species with ozone critical levels grow in California. A county-level assessment predicted that five herb species in Siskiyou and Modoc counties lost more than 10% biomass annually due to ground-level ozone pollution (Kaylor et al. 2023). Ozone effects on sensitive herbs in the counties that contain Lava Beds National Monument exceed European recommendations to cap growth deficits at 10% annual losses.
Visit the NPS air quality conditions and trends website for park-specific ozone information. View live air quality data.
Explore Other Park Air Profiles
There are 47 other Park Air Profiles covering parks across the United States and its territories.
References
Bell MD, Felker-Quinn E, Kohut R. 2020. Ozone sensitive plant species on National Park Service lands. Natural Resource Report. NPS/WASO/NRR—2020/2062. National Park Service. Fort Collins, Colorado. https://irma.nps.gov/DataStore/Reference/Profile/2271702
Burri, K., C. Gromke, and F. Graf. "Mycorrhizal fungi protect the soil from wind erosion: a wind tunnel study." Land Degradation & Development 24.4 (2013): 385-392.
Clark, C.M., Simkin, S.M., Allen, E.B. et al. Potential vulnerability of 348 herbaceous species to atmospheric deposition of nitrogen and sulfur in the United States. Nat. Plants 5, 697–705 (2019). https://doi.org/10.1038/s41477-019-0442-8
Cheng, Shen, et al. "Elucidating the mechanisms underlying enhanced drought tolerance in plants mediated by arbuscular mycorrhizal fungi." Frontiers in Microbiology 12 (2021): 809473.
Geiser, Linda & Nelson, Peter & Jovan, Sarah & Root, Heather & Clark, Christopher. (2019). Assessing Ecological Risks from Atmospheric Deposition of Nitrogen and Sulfur to US Forests Using Epiphytic Macrolichens. Diversity. 11. 87. 10.3390/d11060087.
Geiser, Linda & Root, Heather & Smith, Robert & Jovan, Sarah & Clair, Larry & Dillman, Karen. (2021). Lichen-based critical loads for deposition of nitrogen and sulfur in US forests. Environmental Pollution. 291. 118187. 10.1016/j.envpol.2021.118187.
George, Eckhard, Horst Marschner, and Iver Jakobsen. "Role of arbuscular mycorrhizal fungi in uptake of phosphorus and nitrogen from soil." Critical reviews in biotechnology 15.3-4 (1995): 257-270.
Horn KJ, Thomas RQ, Clark CM, Pardo LH, Fenn ME, Lawrence GB, et al. (2018) Growth and survival relationships of 71 tree species with nitrogen and sulfur deposition across the conterminous U.S.. PLoS ONE 13(10): e0205296. https://doi.org/10.1371/journal.pone.0205296
Kaylor SD, Snell Taylor SJ, Herrick JD. 2023. Estimates of biomass reductions of ozone sensitive herbaceous plants in California. Sci Total Environ. 2023 Jun 20;878:163134. https://doi.org/10.1016/j.scitotenv.2023.163134
Kohut R.J. 2007. Ozone Risk Assessment for Vital Signs Monitoring Networks, Appalachian National Scenic Trail, and Natchez Trace National Scenic Trail. NPS/NRPC/ARD/NRTR—2007/001. National Park Service. Fort Collins, Colorado. Available at https://www.nps.gov/articles/ozone-risk-assessment.htm
Lee EH, Anderson CP, Beedlow PA, Tingey DT, Koike S, Dubois J, Kaylor SD, Novak K, Rice RB, Neufeld HS, Herrick JD. 2022. Ozone Exposure-Response Relationships Parametrized for Sixteen Tree Species with Varying Sensitivity in the United States. Atmospheric Environment. 284:1-16. https://irma.nps.gov/DataStore/Reference/Profile/2294221
Lilleskov, Erik A., et al. "Atmospheric nitrogen deposition impacts on the structure and function of forest mycorrhizal communities: a review." Environmental Pollution 246 (2019): 148-162.
McCoy K., M. D. Bell, and E. Felker-Quinn. 2021. Risk to epiphytic lichen communities in NPS units from atmospheric nitrogen and sulfur pollution: Changes in critical load exceedances from 2001‒2016. Natural Resource Report NPS/NRSS/ARD/NRR—2021/2299. National Park Service, Fort Collins, Colorado. https://doi.org/10.36967/nrr-2287254.
Meyer, Erik and Christopher DeMars. 2018. A Simplified Approach to Using Pesticide Use Reporting To Prioritize Pesticide Risk in California’s National Parks. https://doi.org/10.1021/bk-2018-1283.ch018
[NADP] National Atmospheric Deposition Program. 2018. NTN Data. Accessed January 20, 2022. Available at http://nadp.slh.wisc.edu/NADP/
[NPS] National Park Service. 2022. Fish Consumption Advisories. https://www.nps.gov/subjects/fishing/fish-consumption-advisories.htm
Porter, E., Blett, T., Potter, D.U., Huber, C. 2005. Protecting resources on federal lands: Implications of critical loads for atmospheric deposition of nitrogen and sulfur. BioScience 55(7): 603–612. https://doi.org/10.1641/0006-3568(2005)055[0603:PROFLI]2.0.CO;2
Rao L. E., Allen E. B., Meixner T. 2010. Risk-based determination of critical nitrogen deposition loads for fire spread in southern California deserts. Ecological Applications 20 (5): 1320–1335.
Sullivan T.J. 2016. Air quality related values (AQRVs) in national parks: Effects from ozone; visibility reducing particles; and atmospheric deposition of acids, nutrients and toxics. Natural Resource Report. NPS/NRSS/ARD/NRR—2016/1196. National Park Service. Fort Collins, Colorado. Available at https://www.nps.gov/articles/aqrv-assessment.htm
Van Goethem TMWJ, Azevedo LB, van Zelm R, Hayes F, Ashmore MR, Huijbregts MAJ. 2013. Plant species sensitivity distributions for ozone exposure. Environmental Pollution 178:1-6. https://doi.org/10.1016/j.envpol.2013.02.023
Last updated: November 18, 2024