Part of a series of articles titled Park Air Profiles.
Article
Park Air Profiles - Crater Lake National Park
Air Quality at Crater Lake National Park
Most visitors expect clean air and clear views in parks. Fortunately, that is often what they find at Crater Lake National Park (NP), Oregon, a park well known for its violent volcanic history and blue caldera lake that is often referred to as the “Jewel of the Cascades.” However, the park is located downwind of populated areas, agriculture, and other air pollution sources. Air pollution from these sources has the potential to harm the park’s natural and scenic resources such as vegetation, surface waters, and visibility. The National Park Service works to address air pollution effects at Crater Lake NP, and in parks across the U.S., through science, policy and planning, and by doing our part.
Nitrogen and Sulfur

Nitrogen (N) and sulfur (S) compounds deposited from the air may have harmful effects on ecosystem processes. Healthy ecosystems can naturally buffer a certain amount of pollution, but once a threshold is passed the ecosystem may respond negatively. This threshold is the critical load, or the amount of pollution above which harmful changes in sensitive ecosystems occur (Porter 2005). N and S deposition change ecosystems through eutrophication (N deposition) and acidification (N + S deposition). Eutrophication increases soil and water nutrients which causes some species to grow more quickly and changes community composition. Ecosystem sensitivity to nutrient N enrichment at Crater Lake National Park (CRLA) relative to other national parks is moderate (Sullivan et al. 2016); for a full list of N sensitive ecosystem components, see: NPS ARD 2019. Acidification leaches important cations from soils, lakes, ponds, and streams which decreases habitat quality. Ecosystem sensitivity to acidification at CRLA relative to other national parks is very high (Sullivan et al. 2016); to search for acid-sensitive plant species, see: NPSpecies.
From 2017-2019 total N deposition in CRLA ranged from 1.8 to 3.1 kg-N ha-1 yr-1 and total S deposition ranged from 0.5 to 0.9 kg-S ha-1 yr-1 based on the TDep model (NADP, 2018). CRLA has been monitoring atmospheric N and S deposition since 1983, see the conditions and trends website for park-specific information.
CRLA may be sensitive to eutrophication from N deposition. Because the lake itself represents a great majority of the watershed area, most N deposition falls directly on the lake and is not taken up by surrounding soils, trees, and plants. N enrichment can alter lake diversity and increase lake productivity, resulting in decreased water clarity (Sullivan et al. 2016).
N deposition may also disrupt soil nutrient cycling and alter sensitive alpine plant communities by promoting the growth of weedier invasive species over native plants. Higher elevation ecosystems in CRLA are more at risk than lower elevation areas because they receive greater amounts of snow and rain (Bowman et al. 2012). Short growing seasons and shallow soils at higher elevations limit the capacity of soils and plants to buffer or absorb N and S.
Alpine ecosystem effects
Alpine environments are particularly vulnerable to large inputs of reactive nitrogen because of the sparse cover of vegetation, short growing seasons, large areas of exposed bedrock and talus, and snowmelt nutrient releases (Williams et al., 1996; Nanus et al., 2012). Approximately 4% of the land area in CRLA is alpine (~328 km2 above 1550 m). McClung et al. (2021) compared the 2015 estimated total N deposition (TDep; NADP, 2018) to the critical load of N for an increase in alpine sedge growth (alpine plant critical load = 3 kg-N ha-1yr-1) and the critical load of N for alpine soil nitrate leaching (alpine soil critical load = 10 kg-N ha-1yr-1; Bowman et al., 2012). They found that deposition exceeeded the alpine plant critical load in 18% of the park’s alpine area, but was below the alpine soil critical load throughout the park’s entire alpine area.
Epiphytic macrolichen community responses
Epiphytic macrolichens grow on tree trunks, branches, and boles. Since these lichens grow above the ground, they obtain all their nutrients directly from precipitation and the air. Many epiphytic lichen species have narrow environmental niches and are extremely sensitive to changes in air pollution. Geiser et al. (2019) used a U.S. Forest Service national survey to develop critical loads of nitrogen (N) and critical loads of sulfur (S) to prevent more than a 20% decline in four lichen community metrics: total species richness, pollution sensitive species richness, forage lichen abundance, and cyanolichen abundance.
McCoy et al. (2021) used forested area from the National Land Cover Database to estimate the impact of air pollution on epiphytic lichen communities. Forested area makes up 542 km2 (73.4%) of the land area of Crater Lake National Park.
- N deposition exceeded the 3.1 kg-N ha-1 yr-1 critical load to protect N-sensitive lichen species richness in 2.8% of the forested area.
- S deposition was below the 2.7 kg-S ha-1 yr-1 critical load to protect S-sensitive lichen species richness in every part of the forested area.
For exceedances of other lichen metrics and the predicted decline of lichen communities see Appendices A and B of McCoy et al. (2021).
Additional modeling was done on 459 lichen species to test the combined effects of air pollution and climate gradients (Geiser et al. 2021). A critical load indicative of initial shifts from pollution-sensitive toward pollution-tolerant species occurred at 1.5 kg-N ha-1 yr-1 and 2.7 kg-S ha-1 yr-1 even under changing climate regimes.
Plant species response
Plants vary in their tolerance of eutrophication and acidification, and some plant species respond to nitrogen (N) or sulfur (S) pollution with declines in growth, survival, or abundance on the landscape. Horn et al. (2018) used the U.S. Forest Service national forest survey to develop critical loads of N and critical loads of S to prevent declines in growth or survival of sensitive tree species. Clark et al. (2019) used a database of plant community surveys to develop critical loads of N and critical loads of S to prevent a decline in abundance of sensitive herbaceous plant species. According to NPSpecies, Crater Lake National Park contains:
- 8 N-sensitive tree species and 22 N-sensitive herbaceous species.
- 9 S-sensitive tree species and 17 S-sensitive herbaceous species.
Mycorrhizal fungi community response
Many plants have a symbiotic relationship with mycorrhizal fungi (MF). Through the roots, the plants supply the fungi with carbon from photosynthesis and in exchange the MF enhance nutrient availability within soils, increase drought tolerance, and provide physical resistance to soil erosion (George et al., 1995; Cheng et al., 2021; Burri et al., 2013). Anthropogenic Nitrogen (N) deposition can disrupt this symbiotic relationship resulting in a shift from N sensitive to N tolerant mycorrhizal fungi and plant communities.
With increased N deposition to the soil, MF become less important for nutrient uptake and many plants will cease the exchange of nutrients altogether making them more vulnerable to stressors such as drought (Lilleskov et al., 2019). The CL-N for the shift in mycorrhizal community is 5-6 kg-N ha-1 yr-1 in coniferous forests and 10-20 kg-N ha-1 yr-1 broadleaf forests.
Crater Lake National Park has 590.5 km2 of coniferous forests. Using the range in critical loads above, the minimum CL is exceeded in 57.5% of forested area and the maximum CL is exceeded in 20.1% of forested area based on 2019-2021 TDep Total N deposition.
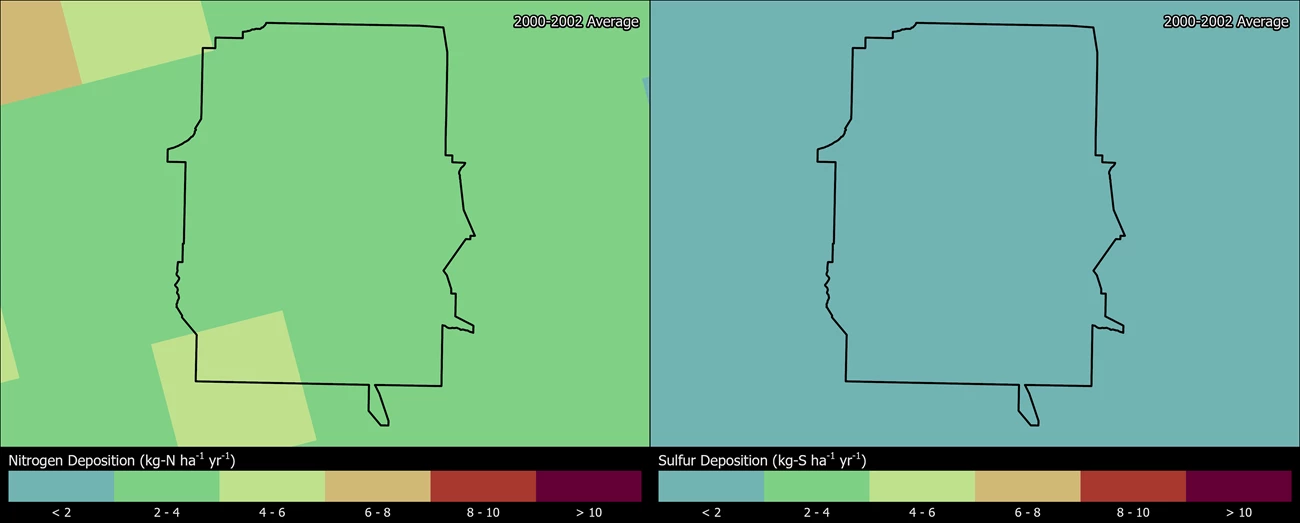
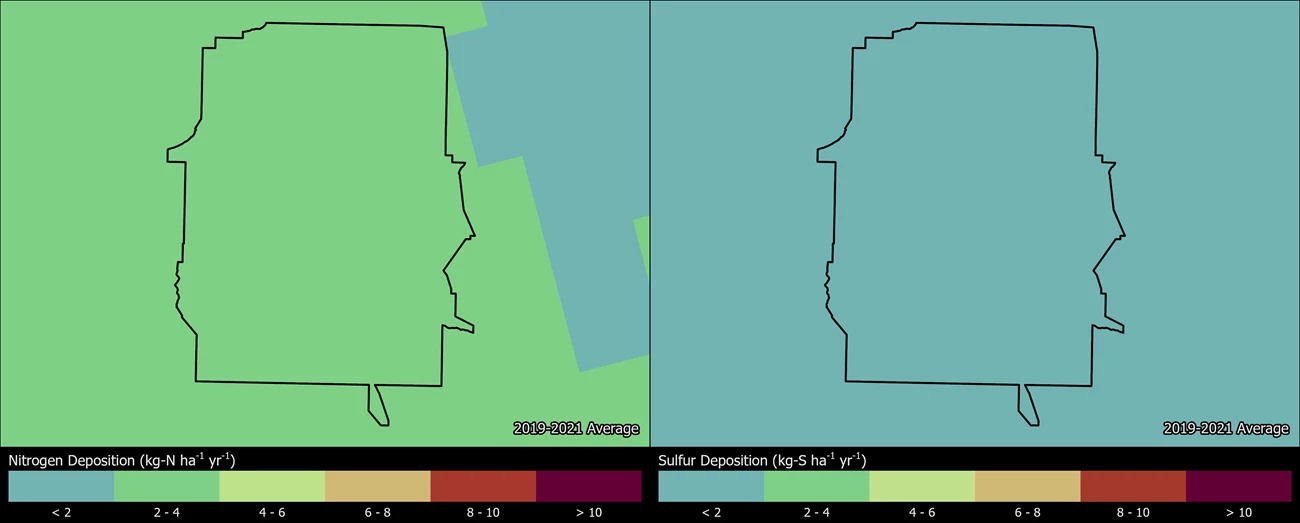
Change in N and S deposition from 2000 to 2021
The maps below show how the spatial distribution of estimated Total N and Total S deposition in CRLA has changed from 2000-2002 to 2019-2021 (TDep MMF version 2022.02). Slide the arrows in the middle of the image up and down to compare N and S deposition between the two years (Yearly Data).
- Minimum N deposition decreased from 2.6 to 2.0 kg-N ha-1 yr-1 and maximum N deposition decreased from 4.3 to 3.4 kg-N ha-1 yr-1.
- Minimum S deposition decreased from 0.7 to 0.5 kg-S ha-1 yr-1 and maximum S deposition decreased from 1.1 to 0.8 kg-S ha-1 yr-1.
Persistent Pollutants
Pollutants like mercury and pesticides are concerning because they are persistent and toxic in the environment. These contaminants can travel in the air thousands of miles away from the source of pollution, even depositing in protected places like national parks. In addition, while some of these harmful pollutants may be banned from use, historically contaminated sites continue to endure negative environmental consequences.
When deposited, airborne mercury and other toxic air contaminants are known to harm wildlife like birds and fish, and cause human health concerns. Many of these substances enter the food chain and accumulate in the tissue of organisms causing reduced reproductive success, impaired growth and development, and decreased survival.
- Mercury concentrations in fish sampled at Crater Lake did not exceed any thresholds for fish toxicity, bird toxicity, or US EPA’s human consumption guidance. Fish were sampled and analyzed for mercury from two sites at the park and compared to data across 21 western parks. The average fish mercury concentration (38.0 ng/g ww) was lower than the study-wide mean (77.7 ng/g ww). However, the data may not reflect the risk at other unsampled locations in the park (Eagles-Smith et al. 2014).
- No fish sampled from the park were found to be intersex (Schreck and Kent 2013). Reproductive abnormalities such as intersex, the presence of both male and female reproductive structures in the same fish, can signify exposure to contaminants. Fish consumption advisories may be in effect for mercury and other contaminants (NPS 2022).
- Dragonfly larvae sampled at three sites within Crater Lake NP had mercury concentrations at sub-impairment or low impairment levels, suggesting fish from these sites would not exceed the US EPA benchmark for protection of human health (Eagles-Smith et al. 2020; Eagles-Smith et al. 2018).
- Related studies also found contaminants in park air and vegetation. Concentrations of toxic air contaminants including combustion by-products (PAHs), current-use pesticides (endosulfans, dacthal), and historic-use pesticides (HCB, a-HCH) were elevated in air and vegetation samples from Crater Lake NP (Landers et al. 2010; Landers et al. 2008).
The NPS Air Resources Division reports on park conditions and trends for mercury. Visit the webpage to learn more.
Visibility

Many visitors come to Crater Lake NP to enjoy vistas of the vivid blue Crater Lake, the deepest lake in the United States. Unfortunately, this scene is sometimes obscured by haze. Visibility reducing haze is caused by tiny particles in the air, and these particles can also affect human health. Many of the same pollutants that ultimately fall out as nitrogen and sulfur deposition contribute to this haze. Organic compounds, soot, and dust reduce visibility as well. Significant improvements in park visibility on clearest days have been documented since the 1990’s. There is no significant trend for visibility on haziest days in the park, likely due to the influence of wildfires on these days. Visibility in the park still needs improvement to reach the Clean Air Act goal of no human caused impairment.
Visibility effects:
- Reduction of the average natural visual range from about 175 miles (without the effects of pollution) to about 140 miles because of pollution at the park
- Reduction of the visual range to below 70 miles on high pollution days
Visit the NPS air quality conditions and trends website for park-specific visibility information. Crater Lake NP has been monitoring visibility since 1992. Check out the live webcam and explore air monitoring »
Ground-Level Ozone

At ground level, ozone is harmful to human health and the environment. Ground-level ozone does not come directly from smokestacks or vehicles, but instead is formed when other pollutants, mainly nitrogen oxides and volatile organic compounds, react in the presence of sunlight.
Over the course of a growing season, ozone can damage plant tissues making it harder for plants to grow and store carbon. Ozone causes leaf injuries like bleaching or dark spots on some sensitive plants. There are eight plants that may display ozone leaf injury at Crater Lake National Park. Search ozone-sensitive plant species found at Crater Lake National Park.
US Environmental Protection Agency and NPS found in ozone exposure experiments that ozone slowed tree seedling growth. NPS uses W126 values from averaged seedling responses in those experiments to describe park condition in terms of Vegetation Health. Ozone affects actively growing plants, so the W126 metric weights a sum of ozone concentrations during daylight hours over three months in the growing season.
A recent re-analysis of the seedling experiments established critical levels of ozone protective of each tree species tested (Lee et al. 2022). The ozone critical levels are W126 values that will prevent 5% or greater deficit in tree seedling biomass. Air Quality Conditions and Trends reports a 5-year average of W126 for each park. In 2018-2022, the average W126 value for Crater Lake National Park was 6.4 ppm-h. Based on this ozone level, trees present in the park (NPSpecies) are at risk of the following ozone effects:
-
The tree species ponderosa pine (Pinus ponderosa), with an ozone critical level of 6 ppm-h, is at risk of 5% biomass deficit in seedlings. Recent ozone levels in the park exceed the critical level that protects this species.
-
Tree species Douglas-fir (Pseudotsuga menziesii) and quaking aspen (Populous tremuloides) are at low risk from ozone despite their known sensitivity. Recent ozone levels in the park are below critical levels that protect these trees from 5% biomass deficit.
Ozone critical levels are for tree seedlings, which represent the regenerative capacity and long-term stability of sensitive species within a forest. These tree species are also known to be sensitive to ozone as adults (Bell et al. 2020), but critical values for seedling growth do not predict ozone effects on mature trees. Air Resources Division is currently working with collaborators to establish critical levels for mature trees using data from forest monitoring plots.
Visit the NPS air quality conditions and trends website for park-specific ozone information.
Explore Other Park Air Profiles
There are 47 other Park Air Profiles covering parks across the United States and its territories.
References
Bell MD, Felker-Quinn E, Kohut R. 2020. Ozone sensitive plant species on National Park Service lands. Natural Resource Report. NPS/WASO/NRR—2020/2062. National Park Service. Fort Collins, Colorado. https://irma.nps.gov/DataStore/Reference/Profile/2271702
Binkley, D., C. Giardina, I. Dockersmith, D. Morse, M. Scruggs, K. Tonnessen. 1997. Status of Air Quality and Related Values in Class I National Parks and Monuments of the Colorado Plateau. National Park Service, Air Resources Division, Denver, Colorado. Chapter 4: Bandelier National Monument. Available at https://irma.nps.gov/DataStore/Reference/Profile/585485.
Burri, K., C. Gromke, and F. Graf. "Mycorrhizal fungi protect the soil from wind erosion: a wind tunnel study." Land Degradation & Development 24.4 (2013): 385-392.
Cheng, Shen, et al. "Elucidating the mechanisms underlying enhanced drought tolerance in plants mediated by arbuscular mycorrhizal fungi." Frontiers in Microbiology 12 (2021): 809473.
Clark, C.M., Simkin, S.M., Allen, E.B. et al. Potential vulnerability of 348 herbaceous species to atmospheric deposition of nitrogen and sulfur in the United States. Nat. Plants 5, 697–705 (2019). https://doi.org/10.1038/s41477-019-0442-8
Eagles-Smith, C.A., J.J. Willacker, and C.M.Flanagan Pritz. 2014. Mercury in fishes from 21 national parks in the Western United States—Inter and intra-park variation in concentrations and ecological risk: U.S. Geological Survey Open-File Report 2014-1051, 54 p. Available at: http://dx.doi.org/10.3133/ofr20141051
Eagles-Smith, C.A., S.J. Nelson., C.M. Flanagan Pritz, J.J. Willacker Jr., and A. Klemmer. 2018. Total Mercury Concentrations in Dragonfly Larvae from U.S. National Parks (ver. 6.0, June 2021): U.S. Geological Survey data release. https://doi.org/10.5066/P9TK6NPT
Eagles-Smith, C.A., J.J. Willacker, S.J. Nelson, C.M. Flanagan Pritz, D.P. Krabbenhoft, C.Y. Chen, J.T. Ackerman, E.H. Campbell Grant, and D.S. Pilliod. 2020. Dragonflies as biosentinels of mercury availability in aquatic food webs of national parks throughout the United States. Environmental Science and Technology 54(14):8779-8790. https://doi.org/10.1021/acs.est.0c01255
Fenn, M. E., Baron, J. S., Allen, E. B., Rueth, H. M., Nydick, K. R., Geiser, L., Bowman, W. D., Sickman, J. O., Meixner, T., Johnson, D. W., & Neitlich, P. (2003). Ecological effects of nitrogen deposition in the western United States. BioScience, 53(4), 404-420. https://doi.org/10.1641/0006-3568(2003)053[0404:EEONDI]2.0.CO;2
Geiser, Linda & Nelson, Peter & Jovan, Sarah & Root, Heather & Clark, Christopher. (2019). Assessing Ecological Risks from Atmospheric Deposition of Nitrogen and Sulfur to US Forests Using Epiphytic Macrolichens. Diversity. 11. 87. 10.3390/d11060087.
Geiser, Linda & Root, Heather & Smith, Robert & Jovan, Sarah & Clair, Larry & Dillman, Karen. (2021). Lichen-based critical loads for deposition of nitrogen and sulfur in US forests. Environmental Pollution. 291. 118187. 10.1016/j.envpol.2021.118187.
George, Eckhard, Horst Marschner, and Iver Jakobsen. "Role of arbuscular mycorrhizal fungi in uptake of phosphorus and nitrogen from soil." Critical reviews in biotechnology 15.3-4 (1995): 257-270.
Horn KJ, Thomas RQ, Clark CM, Pardo LH, Fenn ME, Lawrence GB, et al. (2018) Growth and survival relationships of 71 tree species with nitrogen and sulfur deposition across the conterminous U.S.. PLoS ONE 13(10): e0205296. https://doi.org/10.1371/journal.pone.0205296
Kohut R.J. 2007. Ozone Risk Assessment for Vital Signs Monitoring Networks, Appalachian National Scenic Trail, and Natchez Trace National Scenic Trail. NPS/NRPC/ARD/NRTR—2007/001. National Park Service. Fort Collins, Colorado. Available at https://www.nps.gov/articles/ozone-risk-assessment.htm
Landers, D. H., S. L. Simonich, D. A. Jaffe, L. H. Geiser, D. H. Campbell, A. R. Schwindt, C. B. Schreck, M. L. Kent, W. D. Hafner, H. E. Taylor, K. J. Hageman, S. Usenko, L. K. Ackerman, J. E. Schrlau, N. L. Rose, T. F. Blett, and M. M. Erway. 2008. The Fate, Transport, and Ecological Impacts of Airborne Contaminants in Western National Parks (USA). EPA/600/R—07/138. U.S. Environmental Protection Agency, Office of Research and Development, NHEERL, Western Ecology Division, Corvallis, Oregon. Available at https://www.nature.nps.gov/air/studies/air_toxics/WACAPreport.cfm
Lee EH, Anderson CP, Beedlow PA, Tingey DT, Koike S, Dubois J, Kaylor SD, Novak K, Rice RB, Neufeld HS, Herrick JD. 2022. Ozone Exposure-Response Relationships Parametrized for Sixteen Tree Species with Varying Sensitivity in the United States. Atmospheric Environment. 284:1-16. https://irma.nps.gov/DataStore/Reference/Profile/2294221
Lilleskov, Erik A., et al. "Atmospheric nitrogen deposition impacts on the structure and function of forest mycorrhizal communities: a review." Environmental Pollution 246 (2019): 148-162.
Porter, E., Blett, T., Potter, D.U., Huber, C. 2005. Protecting resources on federal lands: Implications of critical loads for atmospheric deposition of nitrogen and sulfur. BioScience 55(7): 603–612. https://doi.org/10.1641/0006-3568(2005)055[0603:PROFLI]2.0.CO;2
Landers, D. H., Simonich, S. M., Jaffe, D., Geiser, L., Campbell, D. H., Schwindt, A., Schreck, C., Kent, M., Hafner, W., Taylor, H. E., Hageman, K., Usenko, S., Ackerman, L., Schrlau, J., Rose, N., Blett, T., Erway, M. M. 2010. The Western Airborne Contaminant Assessment Project (WACAP): An Interdisciplinary Evaluation of the Impacts of Airborne Contaminants in Western U.S. National Parks. Environmental Science and Technology 44: 855–859.
McCoy K., M. D. Bell, and E. Felker-Quinn. 2021. Risk to epiphytic lichen communities in NPS units from atmospheric nitrogen and sulfur pollution: Changes in critical load exceedances from 2001‒2016. Natural Resource Report NPS/NRSS/ARD/NRR—2021/2299. National Park Service, Fort Collins, Colorado. https://doi.org/10.36967/nrr-2287254.
[NADP] National Atmospheric Deposition Program. 2018. NTN Data. Accessed January 20, 2022. Available at http://nadp.slh.wisc.edu/NADP/
[NPS] National Park Service. 2022. Fish Consumption Advisories. https://www.nps.gov/subjects/fishing/fish-consumption-advisories.htm
Phillips, M. L., D. E. Winkler, R. H. Reibold, B. B. Osborne, and S. C. Reed. 2021. Muted responses to chronic experimental nitrogen deposition on the Colorado Plateau. Oecologia 195:513-524.
Porter, E., Blett, T., Potter, D.U., Huber, C. 2005. Protecting resources on federal lands: Implications of critical loads for atmospheric deposition of nitrogen and sulfur. BioScience 55(7): 603–612. https://doi.org/10.1641/0006-3568(2005)055[0603:PROFLI]2.0.CO;2
Schreck, C.B. and M. Kent. 2013. Extent of Endocrine Disruption in Fish of Western and Alaskan National Parks. NPS-OSU Task Agreement J8W07080024. NPS Final Report, 72 pp. https://irma.nps.gov/DataStore/DownloadFile/469831
Sullivan T.J. 2016. Air quality related values (AQRVs) in national parks: Effects from ozone; visibility reducing particles; and atmospheric deposition of acids, nutrients and toxics. Natural Resource Report. NPS/NRSS/ARD/NRR—2016/1196. National Park Service. Fort Collins, Colorado. Available at https://www.nps.gov/articles/aqrv-assessment.htm
Sullivan, T. J. 2016. Air quality related values (AQRVs) in national parks: Effects from ozone; visibility reducing particles; and atmospheric deposition of acids, nutrients and toxics. Natural Resource Report NPS/NRSS/ARD/NRR—2016/1196. National Park Service, Fort Collins, CO.
Last updated: September 23, 2024