Visitor Impact Mapping

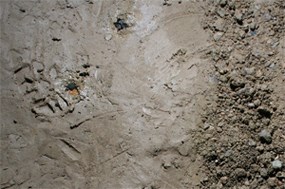
Cave sediment compaction

NPS

Visitor impacts include obvious physical damage to the cave, for example, broken cave formations, darkened and polished rock from touching, and graffiti, and less obvious disturbances, such as lint deposition, sediment compaction and translocation, and displacement of animal bones and fossils. Visitor impacts can also be secondary effects from cave development and use, i.e. growth of algae around tour path lighting and changes to cave climate due to altered air flow from enlarged passages or entrances. All visitor impacts are undesirable because they compromise the integrity of the cave, its natural processes, and ecology. Additionally, visitor impacts to caves tend to be difficult or impossible to restore or reverse.
 

What is visitor impact mapping?

The phrase “visitor impact mapping” was coined by caver Hans Bodenhamer to describe his method for monitoring the condition of a cave and its resources. Bodenhamer’s technique was to draw point maps to locate fragile or damaged resources and area maps to show the extent and severity of foot traffic on floor surfaces. Later, these maps revealed how and where visitors had changed the condition of the cave. The original methods for visitor impact mapping were intended for relatively pristine caves, and Bodenhamer sometimes mapped to the detail of individual footprints.

Visitor impact maps present an interesting and different view of a cave and help clarify cave conditions and their relationship to visitor use. For these reasons, Oregon Caves’ resource management has sought funding for a project to map visitor impacts using Geographic Information Systems (GIS). With GIS, visitor impact mapping methods can be more quantitative, using pull-down menus to collect data and enabling statistical and geographic analyses, and the maps, layers, and datasets produced can be more readily integrated with other data, such as the cave resource inventory from the 1990s.

 
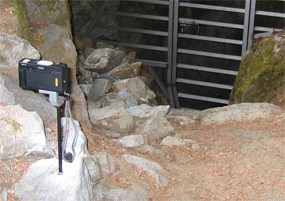
Photomonitoring station at a cave entrance.

NPS

How has visitor impact mapping been done at Oregon Caves?

Since 2005, resource management staff and interns have been conducting comprehensive visitor impact mapping through a combination of inventories, assessments, surveys, and digital photos. Many of the project’s components were developed specifically for Oregon Caves, as it is not a pristine cave, but one that has endured visitor impacts since its first known exploration in 1874. Project work will continue through the future.

  • Hazard-Fragility Assessment: All passages in the cave are classified according to the potential hazard they pose to the visitor and the potential impact of the visitor on the resources in that passage. These classifications are criteria-based and create an index for the cave that defines the system for obtaining permits to enter off-trail areas. Hazard-fragility assessment map, 507 KB pdf
  • Fixed-Point Photomonitoring: There are 19 fixed-point photomonitoring stations in and just outside the cave. Year after year, high-resolution digital photos can be retaken from the exact same angle by using a special camera monorod that locks into a stainless steel sleeve.
  • Photo Inventory: Any cave features or locations of noteworthy fragility, value, or impact are documented with digital photos, described, and geographically linked based on the nearest survey marker.
  • Impact Inventory: Using survey markers in the cave for a reference, the presence and severity of 29 kinds of impacts are mapped in heavily traveled corridors of the cave. Some of these impacts include sediment compaction and translocation, broken cave formations, lint deposits, and wiring.
  • Paleo Survey: A major characteristic of Oregon Caves is its collection of bone deposits. Many of the bones are bat and rat, the most common cave mammals, but some are of paleontological value, including grizzly bear, salamander, and jaguar bones. Human disturbance to these sites is a significant impact, so bones and animal remains are surveyed, photographed, described, and flagged for protection when necessary.
  • Sediment Compaction Assessment: Foot traffic increases the bulk density of sediments on the cave floor. This may affect microbial activity and biodiversity, water infiltration rates, and amount of runoff. With the assistance of a National Park Service soil scientist, resource management staff will assess the sediment compaction along corridors of the off-trail route.
  • Vandalism Survey: Cave formations that were broken by human activity are unobtrusively marked with a UV fluorescing compound as a way to monitor vandalism. After all formations have been marked, resurveys in the following years will reveal the newest damage in the cave, if there is any.
  • Algae Mapping: Algae growth is mapped annually along the tour path based on a GIS layer of tour path lights.
  • Monitoring Conductivity Levels in Cave Pools: Total ionic concentrations in cave pools may be affected by visitation, so pools near and far from the main path are monitored monthly.
 

What will visitor impact mapping reveal?

First, this project will create baseline datasets to compare with future conditions in the cave, including photos tied into specific locations and dates, cave pool conductivity readings, algae maps, compaction and cave floor sediment data, and a catalog of bones and fossils. Second, from the many approaches being used to map and monitor visitor impacts, resource management staff can develop protocols for monitoring visitor impacts that may be used for other caves. Third, the data gathered will reveal spatial patterns, areas to focus cave cleanup efforts, the nuances of specific kinds of impacts, and perhaps in five, ten, or twenty years, the nature of impacts over time.

Interested?

The resource management division would like to solicit the help of skilled volunteers or college students for the following projects:

  • Create a GIS network model of the cave based on the cave survey layer and the hazard-fragility classifications, so that routes through the cave can be queried based on least distance, least hazard, and least fragility. Currently, this has been complicated by the 3-D nature of the cave survey lines.
  • Explore methods for quantitative or semi-quantitative comparison of the digital photos taken at the fixed-point photomonitoring stations, perhaps with the use of precise overlays of photos in a software program.

If you are interested in either of these projects as a college student for part of your coursework or as a resource management volunteer contact us.

Last updated: October 3, 2021

Park footer

Contact Info

Mailing Address:

19000 Caves Hwy
Cave Junction, OR 97523

Phone:

541 592-2100

Contact Us