Part of a series of articles titled Park Air Profiles.
Article
Park Air Profiles - Wind Cave National Park
Air Quality at Wind Cave National Park
Most visitors expect clean air and clear views in parks. Wind Cave National Park (NP), South Dakota is home to one of the world’s longest caves beneath a sea of prairie grasses in the southern Black Hills. Located in the rural Northern Great Plains the park is still affected by some nearby and regional sources of air pollution, including oil and gas production, power plants, agriculture, and vehicles. Air pollutants blown into the park can harm natural and scenic resources such as soils, surface waters, plants, wildlife, and visibility. The National Park Service works to address air pollution effects at Wind Cave NP, and in parks across the U.S., through science, policy and planning, and by doing our part.
Nitrogen and Sulfur

Nitrogen (N) and sulfur (S) compounds deposited from the air may have harmful effects on ecosystem processes. Healthy ecosystems can naturally buffer a certain amount of pollution, but once a threshold is passed the ecosystem may respond negatively. This threshold is the critical load, or the amount of pollution above which harmful changes in sensitive ecosystems occur (Porter 2005). N and S deposition change ecosystems through eutrophication (N deposition) and acidification (N + S deposition). Eutrophication increases soil and water nutrients which causes some species to grow more quickly and changes community composition. Ecosystem sensitivity to nutrient N enrichment at Wind Cave National Park (WICA) relative to other national parks is very high (Sullivan et al. 2016); for a full list of N sensitive ecosystem components, see: NPS ARD 2019. Acidification leaches important cations from soils, lakes, ponds, and streams which decreases habitat quality. Ecosystem sensitivity to acidification at WICA relative to other national parks is very high (Sullivan et al. 2016); to search for acid-sensitive plant species, see: NPSpecies.
From 2017-2019 total N deposition in WICA ranged from 4.8 to 5.3 kg-N ha-1 yr-1 and total S deposition ranged from 0.8 to 0.9 kg-S ha-1 yr-1 based on the TDep model (NADP, 2018). WICA has been monitoring atmospheric N and S deposition since 2002, see the conditions and trends website for park-specific information.
Sensitive mixed-grass prairies cover about 75% of WICA (Peterson et al. 1998). Invasive grasses tend to thrive in areas with elevated N deposition, displacing native vegetation adapted to low N conditions. Cheatgrass, a non-native weed, is now common in the northern Great Plains (Ogle and Reiners 2002). Other non-native weeds at WICA include Canada thistle, leafy spurge, and purple loosestrife. N increases may also exacerbate water use in plants like sagebrush (Inouye 2006). Grassland vegetation at WICA has a critical load of N for an increase in non-native species between 6 and 10 kg-N ha-1 yr-1 (Symstad et al 2019).
Epiphytic macrolichen community responses
Epiphytic macrolichens grow on tree trunks, branches, and boles. Since these lichens grow above the ground, they obtain all their nutrients directly from precipitation and the air. Many epiphytic lichen species have narrow environmental niches and are extremely sensitive to changes in air pollution. Epiphytic lichen communities are less diverse in arid areas, but are still impacted by air pollution. Geiser et al. (2019) used a U.S. Forest Service national survey to develop critical loads of nitrogen (N) and critical loads of sulfur (S) to prevent more than a 20% decline in four lichen community metrics: total species richness, pollution sensitive species richness, forage lichen abundance, and cyanolichen abundance.
McCoy et al. (2021) used forested area from the National Land Cover Database to estimate the impact of air pollution on epiphytic lichen communities. Forested area makes up 35 km2 (25.7%) of the land area of Wind Cave National Park.
- N deposition exceeded the 3.1 kg-N ha-1 yr-1 critical load to protect N-sensitive lichen species richness in 100% of the forested area.
- S deposition was below the 2.7 kg-S ha-1 yr-1 critical load to protect S-sensitive lichen species richness in every part of the forested area.
For exceedances of other lichen metrics and the predicted decline of lichen communities see Appendices A and B of McCoy et al. (2021).
Additional modeling was done on 459 lichen species to test the combined effects of air pollution and climate gradients (Geiser et al. 2021). A critical load indicative of initial shifts from pollution-sensitive toward pollution-tolerant species occurred at 1.5 kg-N ha-1 yr-1 and 2.7 kg-S ha-1 yr-1 even under changing climate regimes.
Plant species response
Plants vary in their tolerance of eutrophication and acidification, and some plant species respond to nitrogen (N) or sulfur (S) pollution with declines in growth, survival, or abundance on the landscape. Horn et al. (2018) used the U.S. Forest Service national forest survey to develop critical loads of N and critical loads of S to prevent declines in growth or survival of sensitive tree species. Clark et al. (2019) used a database of plant community surveys to develop critical loads of N and critical loads of S to prevent a decline in abundance of sensitive herbaceous plant species. According to NPSpecies, Wind Cave National Park contains:
- 6 N-sensitive tree species and 48 N-sensitive herbaceous species.
- 8 S-sensitive tree species and 41 S-sensitive herbaceous species.
Mycorrhizal fungi community response
Many plants have a symbiotic relationship with mycorrhizal fungi (MF). Through the roots, the plants supply the fungi with carbon from photosynthesis and in exchange the MF enhance nutrient availability within soils, increase drought tolerance, and provide physical resistance to soil erosion (George et al., 1995; Cheng et al., 2021; Burri et al., 2013). Anthropogenic Nitrogen (N) deposition can disrupt this symbiotic relationship resulting in a shift from N sensitive to N tolerant mycorrhizal fungi and plant communities.
With increased N deposition to the soil, MF become less important for nutrient uptake and many plants will cease the exchange of nutrients altogether making them more vulnerable to stressors such as drought (Lilleskov et al., 2019). The CL-N for the shift in mycorrhizal community is 5-6 kg-N ha-1 yr-1 in coniferous forests and 10-20 kg-N ha-1 yr-1 broadleaf forests.
Wind Cave National Park has 52.9 km2 of coniferous forests, 78.2 km2 of broadleaf forests, and 16.7 km2 of mixed forests. Using the range in critical loads above, the minimum CL is exceeded in 0% of forested area and the maximum CL is exceeded in 58.4% of forested area based on 2019-2021 TDep Total N deposition.
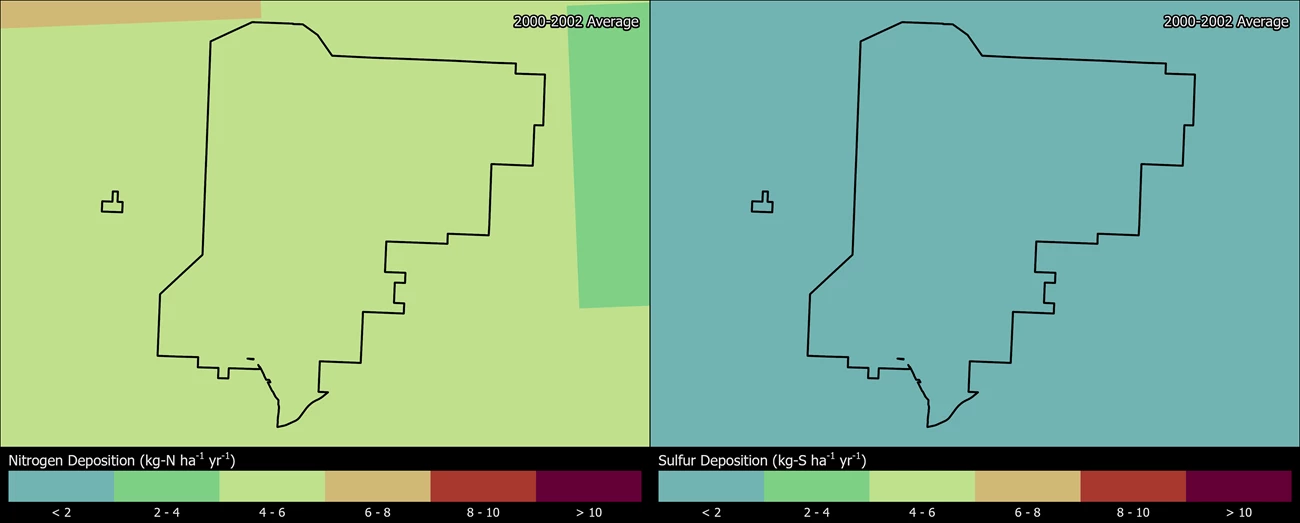
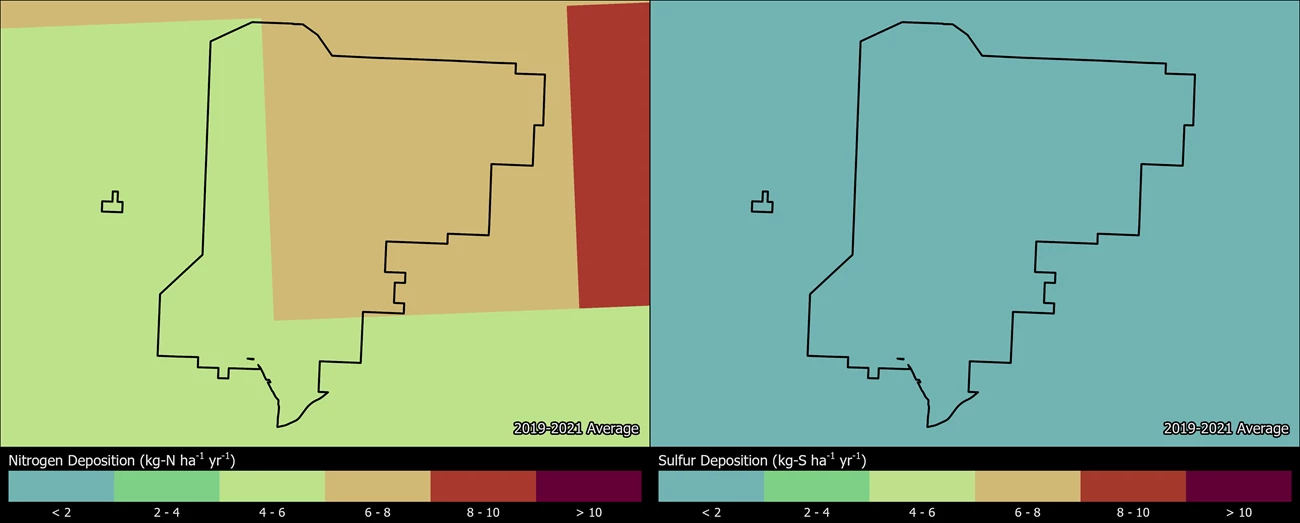
Change in N and S deposition from 2000 to 2021
The maps below show how the spatial distribution of estimated Total N and Total S deposition in WICA has changed from 2000-2002 to 2019-2021 (TDep MMF version 2022.02). Slide the arrows in the middle of the image up and down to compare N and S deposition between the two years (Yearly Data).
- Minimum N deposition increased from 4.6 to 4.9 kg-N ha-1 yr-1 and maximum N deposition increased from 5.4 to 7.5 kg-N ha-1 yr-1.
- Minimum S deposition decreased from 1.4 to 0.7 kg-S ha-1 yr-1 and maximum S deposition decreased from 1.5 to 0.8 kg-S ha-1 yr-1.
Persistent Pollutants
Pollutants like mercury and pesticides are concerning because they are persistent and toxic in the environment. These contaminants can travel in the air thousands of miles away from the source of pollution, even depositing in protected places like national parks. In addition, while some of these harmful pollutants may be banned from use, historically contaminated sites continue to endure negative environmental consequences.
When deposited, airborne mercury and other toxic air contaminants are known to harm wildlife like birds and fish, and cause human health concerns. Many of these substances enter the food chain and accumulate in the tissue of organisms causing reduced reproductive success, impaired growth and development, and decreased survival.
- No fish sampled at Wind Cave NP had mercury levels that exceeded the US EPA threshold for human consumption. Preliminary data from one site in the park indicate an average fish mercury concentration of 0.063 ppm ww. Mercury concentrations in all 15 fish sampled were below the health benchmark established for human consumption (0.3 ppm ww) (Eagles-Smith et al. 2019). However, the data may not reflect the risk at other unsampled locations in the park. Fish consumption advisories may be in effect for mercury and other contaminants (NPS 2022).
- Dragonfly larvae sampled at Wind Cave NP had mercury concentrations at a moderate impairment level. Dragonfly larvae have been sampled and analyzed for mercury from three sites in the park; 100% of the data fall into the moderate (100-300 ng/g dw) impairment category for potential mercury risk. An index of moderate impairment or higher suggests some fish may exceed the US EPA benchmark for protection of human health (Eagles-Smith et al. 2018; Eagles-Smith et al. 2020).
- Average mercury deposition rates at Wind Cave NP were high compared to other national parks, including nearby Badlands NP and Theodore Roosevelt NP (Stone 2011). Annual deposition rates were comparable to studies performed at similar latitudes and to estimates from the Mercury Deposition Network (MDN) (Lupo and Stone 2013).
Visibility

Visitors come to Wind Cave NP to experience one of the world’s longest caves, and to enjoy views of swaying prairie grasses, forested hillsides, and an array of wildlife that includes bison, elk, and prairie dogs. Park vistas are sometimes obscured by haze, reducing how well and how far people can see. Visibility reducing haze is caused by tiny particles in the air, and these particles can also affect human health. Many of the same pollutants that ultimately fall out as nitrogen and sulfur deposition contribute to this haze. Organic compounds, soot, dust, and wood smoke reduce visibility as well. Significant improvements in park visibility have been documented since the 2000’s. Overall, visibility in the park still needs improvement to reach the Clean Air Act goal of no human caused impairment.
Visibility effects:
- Reduced visibility, at times, due to human-caused haze and fine particles of air pollution, including dust;
- Reduction of the average natural visual range from about 160 miles (without pollution) to about 115 miles because of pollution at the park;
- Reduction of the visual range to below 65 miles on high pollution days.
Visit the NPS air quality conditions and trends website for park-specific visibility information. Wind Cave NP has been monitoring visibility since 2000. Explore air monitoring »
Ground-Level Ozone

At ground level, ozone is harmful to human health and the environment. Ground-level ozone does not come directly from smokestacks or vehicles, but instead is formed when other pollutants, mainly nitrogen oxides and volatile organic compounds, react in the presence of sunlight.
Over the course of a growing season, ozone can damage plant tissues making it harder for plants to produce and store food. It also weakens plants making them less resistant to disease and insect infestations. Some plants are more sensitive to ozone than others. Ozone sensitive plants in the park include Apocynum androsaemifolium (spreading dogbane), Asclepias syriaca (common milkweed), and Symphoricarpos albus (common snowberry). Search for more ozone-sensitive plant species found at Wind Cave NP.
A risk assessment that considered ozone exposure, soil moisture, and sensitive plant species concluded that plants at Wind Cave NP are at low risk of ozone injury (Kohut 2004). The park’s arid to semi-arid conditions limit ozone uptake by plants. In other parks, scientists have found that plants in moist areas along streams and seeps may have higher ozone uptake and subsequent injury (Kohut et al. 2012).
Visit the NPS air quality conditions and trends website for park-specific ozone information. Wind Cave NP has been monitoring ozone since 2004. View live ozone and meteorology data and explore air monitoring »
Explore Other Park Air Profiles
There are 47 other Park Air Profiles covering parks across the United States and its territories.
References
Burri, K., C. Gromke, and F. Graf. "Mycorrhizal fungi protect the soil from wind erosion: a wind tunnel study." Land Degradation & Development 24.4 (2013): 385-392.
Cheng, Shen, et al. "Elucidating the mechanisms underlying enhanced drought tolerance in plants mediated by arbuscular mycorrhizal fungi." Frontiers in Microbiology 12 (2021): 809473.
Clark, C.M., Simkin, S.M., Allen, E.B. et al. Potential vulnerability of 348 herbaceous species to atmospheric deposition of nitrogen and sulfur in the United States. Nat. Plants 5, 697–705 (2019). https://doi.org/10.1038/s41477-019-0442-8
Eagles-Smith, C.A., J.J. Willacker, and C.M.Flanagan Pritz. 2014. Mercury in fishes from 21 national parks in the Western United States—Inter and intra-park variation in concentrations and ecological risk: U.S. Geological Survey Open-File Report 2014-1051, 54 p. Available at: http://dx.doi.org/10.3133/ofr20141051.
Eagles-Smith, C.A., S.J. Nelson., C.M. Flanagan Pritz, J.J. Willacker Jr., and A. Klemmer. 2018. Total Mercury Concentrations in Dragonfly Larvae from U.S. National Parks (ver. 6.0, June 2021): U.S. Geological Survey data release. https://doi.org/10.5066/P9TK6NPT
Eagles-Smith, C.A., J.J. Willacker, S.J. Nelson, C.M. Flanagan Pritz, D.P. Krabbenhoft, C.Y. Chen, J.T. Ackerman, E.H. Campbell Grant, and D.S. Pilliod. 2020. Dragonflies as biosentinels of mercury availability in aquatic food webs of national parks throughout the United States. Environmental Science and Technology 54(14):8779-8790. https://doi.org/10.1021/acs.est.0c01255
Geiser, Linda & Nelson, Peter & Jovan, Sarah & Root, Heather & Clark, Christopher. (2019). Assessing Ecological Risks from Atmospheric Deposition of Nitrogen and Sulfur to US Forests Using Epiphytic Macrolichens. Diversity. 11. 87. 10.3390/d11060087.
Geiser, Linda & Root, Heather & Smith, Robert & Jovan, Sarah & Clair, Larry & Dillman, Karen. (2021). Lichen-based critical loads for deposition of nitrogen and sulfur in US forests. Environmental Pollution. 291. 118187. 10.1016/j.envpol.2021.118187.
George, Eckhard, Horst Marschner, and Iver Jakobsen. "Role of arbuscular mycorrhizal fungi in uptake of phosphorus and nitrogen from soil." Critical reviews in biotechnology 15.3-4 (1995): 257-270.
Horn KJ, Thomas RQ, Clark CM, Pardo LH, Fenn ME, Lawrence GB, et al. (2018) Growth and survival relationships of 71 tree species with nitrogen and sulfur deposition across the conterminous U.S.. PLoS ONE 13(10): e0205296. https://doi.org/10.1371/journal.pone.0205296
Inouye, R.S. 2006. Effects of shrub removal and nitrogen addition on soil moisture in sagebrush steppe. Journal of Arid Environments 65: 604–618.
Kohut, B. 2004. Assessing the Risk of Foliar Injury from Ozone on Vegetation in Parks in the Northern Great Plains Network. Available at https://irma.nps.gov/DataStore/Reference/Profile/2181539.
Kohut, B., C. Flanagan, E. Porter, J. Cheatham. 2012. Foliar Ozone Injury on Cutleaf Coneflower at Rocky Mountain National Park, Colorado. Western North American Naturalist 72(1): 32–42.
Lilleskov, Erik A., et al. "Atmospheric nitrogen deposition impacts on the structure and function of forest mycorrhizal communities: a review." Environmental Pollution 246 (2019): 148-162.
Lupo, C.D. and Stone, J.J. 2013. Bulk Atmospheric Mercury Fluxes for the Northern Great Plains, USA. Water, Air, & Soil Pollution 224:1437. https://doi.org/10.1007/s11270-013-1437-0
McCoy K., M. D. Bell, and E. Felker-Quinn. 2021. Risk to epiphytic lichen communities in NPS units from atmospheric nitrogen and sulfur pollution: Changes in critical load exceedances from 2001‒2016. Natural Resource Report NPS/NRSS/ARD/NRR—2021/2299. National Park Service, Fort Collins, Colorado. https://doi.org/10.36967/nrr-2287254.
[NADP] National Atmospheric Deposition Program. 2018. NTN Data. Accessed January 20, 2022. Available at http://nadp.slh.wisc.edu/NADP/
[NPS] National Park Service. 2022. Fish Consumption Advisories. https://www.nps.gov/subjects/fishing/fish-consumption-advisories.htm
Ogle, S. M. and W. A. Reiners. 2002. A phytosociological study of exotic annual brome grasses in a mixed grass prairie/ponderosa pine forest ecotone. The American Midland Naturalist. 147(1): 25–31.
Peterson, D. L., T. J. Sullivan, J. M. Eilers, S. Brace, D. Horner, K. Savig, and D. Morse. 1998. Assessment of air quality and air pollutant impacts in national parks of the Rocky Mountains and northern Great Plains. Chapter 8. Wind Cave National Park. Report NPS/CCSOUW/NRTR–98/19. National Park Service, Air Resources Division, Denver, CO. Available at https://irma.nps.gov/DataStore/Reference/Profile/11733
Porter, E., Blett, T., Potter, D.U., Huber, C. 2005. Protecting resources on federal lands: Implications of critical loads for atmospheric deposition of nitrogen and sulfur. BioScience 55(7): 603–612. https://doi.org/10.1641/0006-3568(2005)055[0603:PROFLI]2.0.CO;2
Stone, J. 2011. 2010 Project Summary Report – Assessment of Atmospheric Deposition at Select Northern Great Plains National Parks Service Locations. Unpublished report to parks, 6p.
Sullivan, T. J. 2016. Air quality related values (AQRVs) in national parks: Effects from ozone; visibility reducing particles; and atmospheric deposition of acids, nutrients and toxics. Natural Resource Report NPS/NRSS/ARD/NRR—2016/1196. National Park Service, Fort Collins, CO.
Symstad, A. J., A. T. Smith, W. E. Newton, and A. K. Knapp. 2019. Experimentally derived nitrogen critical loads for northern Great Plains vegetation. Ecological Applications 29:e01915.
Last updated: August 6, 2024