Part of a series of articles titled Park Air Profiles.
Article
Park Air Profiles - Shenandoah National Park
Air Quality at Shenandoah National Park
Most visitors expect clean air and clear views in parks. Shenandoah National Park (NP) in Virginia experiences some of the highest measured air pollution of any national park in the U.S. The park is downwind of many sources of air pollution, including power plants, factories, vehicles, and agriculture from the mid-Atlantic region and Ohio River Valley. Air pollutants blown into the park can harm natural and scenic resources such as soils, surface waters, plants, wildlife, and visibility. The National Park Service works to address air pollution effects at Shenandoah NP, and in parks across the U.S., through science, policy and planning, and by doing our part.
Nitrogen and Sulfur

Nitrogen (N) and sulfur (S) compounds deposited from the air may have harmful effects on ecosystem processes. Healthy ecosystems can naturally buffer a certain amount of pollution, but once a threshold is passed the ecosystem may respond negatively. This threshold is the critical load, or the amount of pollution above which harmful changes in sensitive ecosystems occur (Porter 2005). N and S deposition change ecosystems through eutrophication (N deposition) and acidification (N + S deposition). Eutrophication increases soil and water nutrients which causes some species to grow more quickly and changes community composition. Ecosystem sensitivity to nutrient N enrichment at Shenandoah National Park (SHEN) relative to other national parks is very low (Sullivan et al. 2016); for a full list of N sensitive ecosystem components, see: NPS ARD 2019. Acidification leaches important cations from soils, lakes, ponds, and streams which decreases habitat quality. Ecosystem sensitivity to acidification at SHEN relative to other national parks is very high (Sullivan et al. 2016); to search for acid-sensitive plant species, see: NPSpecies.
From 2017-2019 total N deposition in SHEN ranged from 7.3 to 11.3 kg-N ha-1 yr-1 and total S deposition ranged from 1.6 to 2.2 kg-S ha-1 yr-1 based on the TDep model (NADP, 2018). SHEN has been monitoring atmospheric N and S deposition since 1981, see the conditions and trends website for park-specific information.
SHEN receives among the highest measured deposition of both sulfur and nitrogen of all monitored national parks. Although the Acid Rain Program has significantly reduced acid deposition throughout the Eastern U.S., problems remain. High ridgetop ecosystems at SHEN, especially soils, are particularly vulnerable to acid deposition. These systems receive more deposition from rain, fog, and clouds than lower elevation areas. Additionally, low buffering capacity, short growing seasons, and shallow soils make higher elevation areas more sensitive to acidic inputs.
Acidification of streamwaters and changes in condition of sensitive species, such as native brook trout, have been documented in the park as a result of acid deposition (Webb et al. 2004). Sulfur deposition needs to drop substantially below current levels in order to prevent further acidification and associated biological impacts in acid-sensitive streams within the park according to a study that analyzed critical loads for sulfur deposition (Sullivan et al. 2016). Plants sensitive to the effects of acidification in the park include Acer saccharum (sugar maple) and Picea rubens (red spruce).
SHEN is a leader among the national parks with respect to park-specific knowledge of acidic deposition effects and watershed ecosystem conditions. Extensive monitoring, research, and assessment of acidic deposition effects on sensitive surface waters in the park dates back to 1979 (Shenandoah Watershed Study—Virginia Trout Stream Sensitivity Study). Of note, the 2014 Appalachian Trail Atmospheric Deposition Effects Study assessed ecosystem response to acid deposition in sensitive ridgetop areas. This research, conducted at numerous sites within SHEN, determined critical loads for forests, soils, and streams.
Additional N and S Research:- Acid rain with an average acidity (pH) as low as 4.6, ten times more acidic than normal rainfall (NADP 2018)
- Many streams have pH measurements as low as 5, ten times more acidic than the pH of park streams prior to human-caused pollution (NAPAP 1998)
- Streams that have been highly damaged by acidification in the park support fewer fish species than park streams with better acid neutralizing capacity. (Bulger et al. 1999)
- Sensitive fish species including brook trout, dace, chub, sculpin, darter, and bass have been affected by stream acidification (Webb et al. 2004; Bulger et al. 1999)
- Aquatic insect communities, an important food source for trout, have been harmed by acidification in some park streams (Moeykens and Voshell 2002)
- Decreased capacity of soils to buffer sulfur, with subsequent declines of essential nutrients calcium and magnesium, creating the potential for toxic aluminum to leach into streams (Welsch et al. 2001; Sullivan et al. 2016)
Epiphytic macrolichen community responses
Epiphytic macrolichens grow on tree trunks, branches, and boles. Since these lichens grow above the ground, they obtain all their nutrients directly from precipitation and the air. Many epiphytic lichen species have narrow environmental niches and are extremely sensitive to changes in air pollution. Geiser et al. (2019) used a U.S. Forest Service national survey to develop critical loads of nitrogen (N) and critical loads of sulfur (S) to prevent more than a 20% decline in four lichen community metrics: total species richness, pollution sensitive species richness, forage lichen abundance, and cyanolichen abundance.
McCoy et al. (2021) used forested area from the National Land Cover Database to estimate the impact of air pollution on epiphytic lichen communities. Forested area makes up 728 km2 (93%) of the land area of Shenandoah National Park.
- N deposition exceeded the 3.1 kg-N ha-1 yr-1 critical load to protect N-sensitive lichen species richness in 94.7% of the forested area.
- S deposition was below the 2.7 kg-S ha-1 yr-1 critical load to protect S-sensitive lichen species richness in every part of the forested area.
For exceedances of other lichen metrics and the predicted decline of lichen communities see Appendices A and B of McCoy et al. (2021).
Additional modeling was done on 459 lichen species to test the combined effects of air pollution and climate gradients (Geiser et al. 2021). A critical load indicative of initial shifts from pollution-sensitive toward pollution-tolerant species occurred at 1.5 kg-N ha-1 yr-1 and 2.7 kg-S ha-1 yr-1 even under changing climate regimes.
Plant species response
Plants vary in their tolerance of eutrophication and acidification, and some plant species respond to nitrogen (N) or sulfur (S) pollution with declines in growth, survival, or abundance on the landscape. Horn et al. (2018) used the U.S. Forest Service national forest survey to develop critical loads of N and critical loads of S to prevent declines in growth or survival of sensitive tree species. Clark et al. (2019) used a database of plant community surveys to develop critical loads of N and critical loads of S to prevent a decline in abundance of sensitive herbaceous plant species. According to NPSpecies, Shenandoah National Park contains:
- 33 N-sensitive tree species and 118 N-sensitive herbaceous species.
- 40 S-sensitive tree species and 94 S-sensitive herbaceous species.
Mycorrhizal community response
Many plants have a symbiotic relationship with mycorrhizal fungi (MF). Through the roots, the plants supply the fungi with carbon from photosynthesis and in exchange the MF enhance nutrient availability within soils, increase drought tolerance, and provide physical resistance to soil erosion (George et al., 1995; Cheng et al., 2021; Burri et al., 2013). Anthropogenic Nitrogen (N) deposition can disrupt this symbiotic relationship resulting in a shift from N sensitive to N tolerant mycorrhizal fungi and plant communities.
With increased N deposition to the soil, MF become less important for nutrient uptake and many plants will cease the exchange of nutrients altogether making them more vulnerable to stressors such as drought (Lilleskov et al., 2019). The CL-N for the shift in mycorrhizal community is 5-6 kg-N ha-1 yr-1 in coniferous forests and 10-20 kg-N ha-1 yr-1 broadleaf forests.
Shenandoah National Park has 5.1 km2 of coniferous forests, 742.4 km2 of broadleaf forests, and 49.5 km2 of mixed forests. Using the range in critical loads above, the minimum CL is exceeded in 33.8% of forested area and the maximum CL is exceeded in 0.6% of forested area based on 2019-2021 TDep Total N deposition.
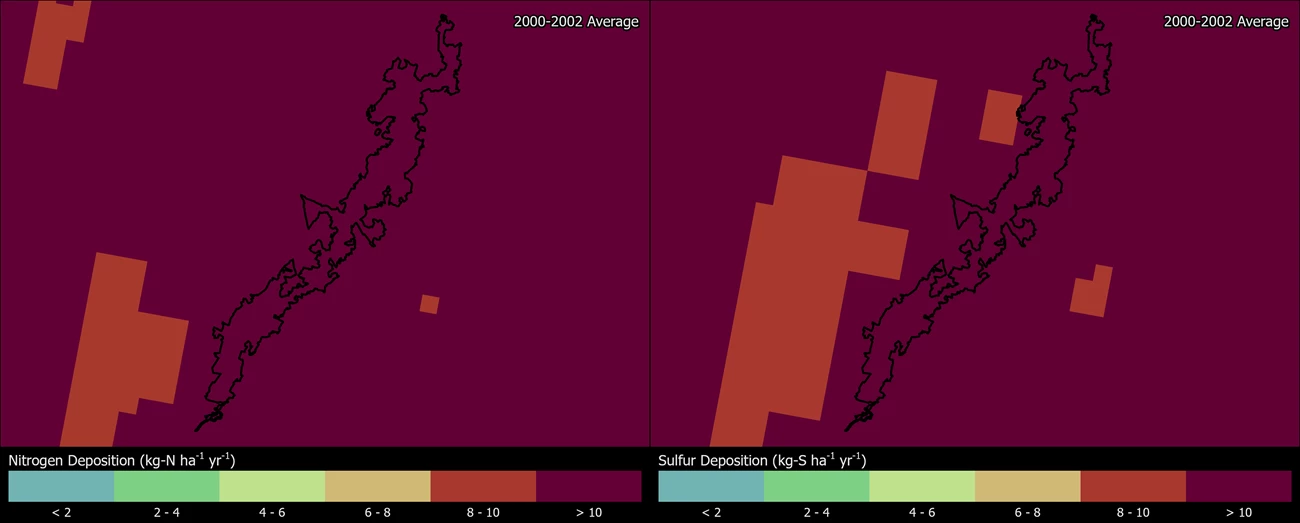
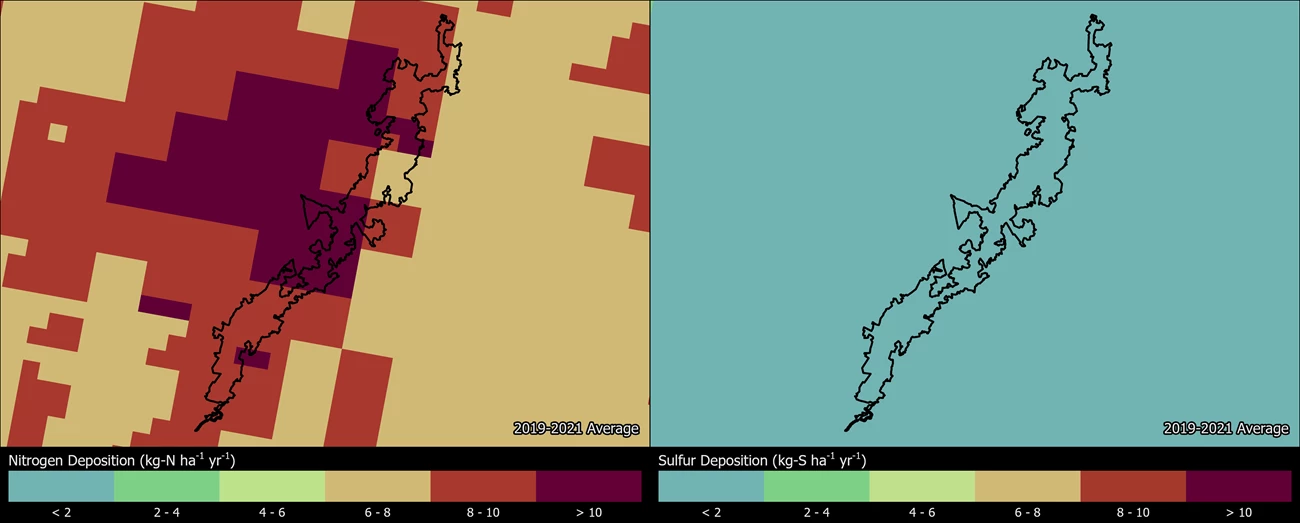
Change in N and S deposition from 2000 to 2021
The maps below show how the spatial distribution of estimated Total N and Total S deposition in SHEN has changed from 2000-2002 to 2019-2021 (TDep MMF version 2022.02). Slide the arrows in the middle of the image up and down to compare N and S deposition between the two years (Yearly Data).
- Minimum N deposition decreased from 12.4 to 7.6 kg-N ha-1 yr-1 and maximum N deposition decreased from 17.5 to 11.6 kg-N ha-1 yr-1.
- Minimum S deposition decreased from 10.2 to 1.2 kg-S ha-1 yr-1 and maximum S deposition decreased from 15.1 to 1.9 kg-S ha-1 yr-1.
Persistent Pollutants
Pollutants like mercury and pesticides are concerning because they are persistent and toxic in the environment. These contaminants can travel in the air thousands of miles away from the source of pollution, even depositing in protected places like national parks. In addition, while some of these harmful pollutants may be banned from use, historically contaminated sites continue to endure negative environmental consequences.
When deposited, airborne mercury and other toxic air contaminants are known to harm wildlife like birds and fish, and cause human health concerns. Many of these substances enter the food chain and accumulate in the tissue of organisms causing reduced reproductive success, impaired growth and development, and decreased survival.
- Mercury concentrations in some fish sampled at Shenandoah NP exceeded the threshold for human consumption. Preliminary data from seven sites in the park indicate an average fish mercury concentration of 0.088 ppm ww. Mercury concentrations in less than 2% of fish sampled (n=337) exceeded the US EPA threshold established for human consumption (0.3 ppm ww) (Eagles-Smith et al. 2019). However, the data may not reflect the risk at other unsampled locations in the park. Fish consumption advisories may be in effect for mercury and other contaminants (NPS 2022).
- Some dragonfly larvae sampled at Shenandoah NP had mercury concentrations at a moderate impairment level. Dragonfly larvae have been sampled and analyzed for mercury from two sites in the park; 63% of the data fall into the moderate (100-300 ng/g dw) impairment category for potential mercury risk. An index of moderate impairment or higher suggests some fish may exceed the US EPA benchmark for protection of human health (Eagles-Smith et al. 2018; Eagles-Smith et al. 2020).
- Elevated levels of mercury were found in tree swallows at the headwaters of the Shenandoah River (Brasso and Cristal 2008).
The NPS Air Resources Division reports on park conditions and trends for mercury. Visit the webpage to learn more.
Visibility

Many visitors come to enjoy the spectacular vistas found at Shenandoah NP. From the vistas along Skyline Drive to the rocky peaks of Hawksbill and Old Rag mountains, clean air is critical for inspirational views of the Blue Ridge Mountains, flanked by the beautiful Shenandoah Valley to the west and Virginia Piedmont to the east. Unfortunately, park vistas are sometimes obscured by haze, reducing how well and how far people can see. Visibility reducing haze is caused by tiny particles in the air, and these particles can also affect human health. Many of the same pollutants that ultimately fall out as nitrogen and sulfur deposition contribute to this haze. Organic compounds, soot, dust, and wood smoke reduce visibility as well.
Pollution-caused haze typically appears as a uniform whitish haze, different from the natural haze caused by organic compounds released by trees over the Blue Ridge Mountains of the eastern United States. Significant improvements in park visibility have been documented since the late 1980’s. Still, visibility in the park is a long way from the Clean Air Act goal of no human caused impairment.
Visibility effects:
- Reduction of the average natural visual range from about 120 miles (without the effects of pollution) to about 75 miles because of pollution;
- Reduction of the visual range from about 80 miles to below 35 miles on high pollution days;
- Human-caused haze frequently impairs scenic vistas at the park.
Visit the NPS air quality conditions and trends website for park-specific visibility information. Shenandoah NP has been monitoring visibility since 1988. View a live air quality webcam, and explore air monitoring »
Ground-Level Ozone

At ground level, ozone is harmful to human health and the environment. Ground-level ozone does not come directly from smokestacks or vehicles, but instead is formed when other pollutants, mainly nitrogen oxides and volatile organic compounds, react in the presence of sunlight.
Over the course of a growing season, ozone can damage plant tissues making it harder for plants to grow and store carbon. Ozone causes leaf injuries like bleaching or dark spots on some sensitive plants:
-
The most recent survey for ozone-sensitive milkweed in the park in 2016 found ozone injury at Big Meadows on tall milkweed (Asclepias exaltata) and common milkweed (Asclepias syriaca; Skelly 2016).
-
Earlier surveys in the 1980s and 1990s, when ozone levels were considerably higher, found ozone injury leaves of trees, tree seedlings, and understory plants including black cherry, tulip tree (yellow poplar), white ash, green ash, sweetgum, Eastern white pine, milkweed, virgin’s bower, black locust, and wild grape (Sullivan et al. 2003; Hildebrand et al. 1996; Sanchini 1989; Winner et al. 1989; Duchelle et al. 1982);
-
Early surveys found ozone injury on leaves was more severe on higher-elevation populations of virgin’s bower, black locust, and wild grape in the park (Winner et al. 1989).
There are 26 plants that may display ozone leaf injury at Shenandoah National Park. Search ozone-sensitive plant species found at Shenandoah National Park.
US Environmental Protection Agency and NPS found in ozone exposure experiments that ozone slowed tree seedling growth. NPS uses W126 values from averaged seedling responses in those experiments to describe park condition in terms of Vegetation Health. Ozone affects actively growing plants, so the W126 metric weights a sum of ozone concentrations during daylight hours over three months in the growing season.
A recent re-analysis of the seedling experiments established critical levels of ozone protective of each tree species tested (Lee et al. 2022). The ozone critical levels are W126 values that will prevent 5% or greater deficit in tree seedling biomass. Air Quality Conditions and Trends reports a 5-year average of W126 for each park. In 2018-2022, the average W126 value for Shenandoah National Park was 4.9 ppm-h. Based on this ozone level, trees present in the park (NPSpecies) are at risk of the following ozone effects:
-
The tree species tulip poplar (Liriodendron tulipfera), with an ozone critical level of 3.5 ppm-h, is at risk of 7% biomass deficit in seedlings. The tree species black cherry (Prunus serotina), with a critical ozone level of 2.5 ppm-h, is at risk of 10% biomass deficit in seedlings.
-
Tree species eastern white pine (Pinus strobus), American sycamore (Plantanus occidentalis), Virginia pine (Pinus virginiana), sugar maple (Acer saccharum), red maple (Acer rubrum), chestnut oak (Quercus montana and Quercus prinus), table mountain pine (Pinus pungens) and winged sumac (Rhus copallinum) are at low risk from ozone despite their known sensitivity. Recent ozone levels in the park are below critical levels that protect these trees from 5% biomass deficit.
Ozone critical levels are for tree seedlings, which represent the regenerative capacity and long-term stability of sensitive species within a forest. These tree species are also known to be sensitive to ozone as adults (Bell et al. 2020), but critical values for seedling growth do not predict ozone effects on mature trees. Ozone effects on plant growth studied at Shenandoah NP include:
•Reduced average height of yellow poplar, green ash, white ash, black locust, Virginia pine, Eastern white pine, table mountain pine, and Eastern hemlock (Duchelle et al. 1982);
•Reduced above-ground biomass production of native vegetation (Duchelle et al. 1983);
In addition to these effects, Air Resources Division is currently working with collaborators to establish critical levels for mature trees using data from forest monitoring plots.
Visit the NPS air quality conditions and trends website for park-specific ozone information. Shenandoah National Park has been monitoring ozone since 1983. View live ozone and meteorology data.
Explore Other Park Air Profiles
There are 47 other Park Air Profiles covering parks across the United States and its territories.
References
Bell MD, Felker-Quinn E, Kohut R. 2020. Ozone sensitive plant species on National Park Service lands. Natural Resource Report. NPS/WASO/NRR—2020/2062. National Park Service. Fort Collins, Colorado. https://irma.nps.gov/DataStore/Reference/Profile/2271702
Brasso, R. L. and Cristol, D. A. 2008. Effects of mercury exposure on the reproductive success of tree swallows (Tachycineta bicolor). Ecotoxicology 17:133–141. Available at: https://irma.nps.gov/DataStore/Reference/Profile/2171808
Bulger, A. J., Cosby, B. J. Dolloff, C. A., Eshleman, K. N., Webb, J. R., and Galloway, J. N. 1999. The “Shenandoah National Park: Fish in Sensitive Habitats (SNP: FISH)” An Integrated Assessment of Fish Community Responses to Stream Acidification. National Park Service Final Report. 570 pp. Available at https://irma.nps.gov/DataStore/Reference/Profile/112386.
Burri, K., C. Gromke, and F. Graf. "Mycorrhizal fungi protect the soil from wind erosion: a wind tunnel study." Land Degradation & Development 24.4 (2013): 385-392.
Cheng, Shen, et al. "Elucidating the mechanisms underlying enhanced drought tolerance in plants mediated by arbuscular mycorrhizal fungi." Frontiers in Microbiology 12 (2021): 809473.
Clark, C.M., Simkin, S.M., Allen, E.B. et al. Potential vulnerability of 348 herbaceous species to atmospheric deposition of nitrogen and sulfur in the United States. Nat. Plants 5, 697–705 (2019). https://doi.org/10.1038/s41477-019-0442-8
Duchelle, S. F., J. M. Skelly, and B. I. Chevone. 1982. Oxidant effects on forest tree seedling growth in the Appalachian Mountains. Water Air Soil Pollut. 18: 363–373.
Duchelle, S. F., J. M. Skelly, T. L. Sharick, B. I. Chevone, Y-S. Yang, and J. E. Nellessen. 1983. Effects of ozone on the productivity of natural vegetation in a high meadow of the Shenandoah National Park of Virginia. J. Environ. Manage. 17:299–308.
Eagles-Smith, C.A., S.J. Nelson., C.M. Flanagan Pritz, J.J. Willacker Jr., and A. Klemmer. 2018. Total Mercury Concentrations in Dragonfly Larvae from U.S. National Parks (ver. 6.0, June 2021): U.S. Geological Survey data release. https://doi.org/10.5066/P9TK6NPT
Eagles-Smith, CA, JJ Willacker, CM Flanagan Pritz, AC Ellsworth. 2019. Total Mercury Concentrations in Fish from 31 National Parks, USA, 2015-2016. USGS Sensitive Data Release. https://irma.nps.gov/DataStore/Reference/Profile/2260288
Eagles-Smith, C.A., J.J. Willacker, S.J. Nelson, C.M. Flanagan Pritz, D.P. Krabbenhoft, C.Y. Chen, J.T. Ackerman, E.H. Campbell Grant, and D.S. Pilliod. 2020. Dragonflies as biosentinels of mercury availability in aquatic food webs of national parks throughout the United States. Environmental Science and Technology 54(14):8779-8790. https://doi.org/10.1021/acs.est.0c01255
Geiser, Linda & Nelson, Peter & Jovan, Sarah & Root, Heather & Clark, Christopher. (2019). Assessing Ecological Risks from Atmospheric Deposition of Nitrogen and Sulfur to US Forests Using Epiphytic Macrolichens. Diversity. 11. 87. 10.3390/d11060087.
Geiser, Linda & Root, Heather & Smith, Robert & Jovan, Sarah & Clair, Larry & Dillman, Karen. (2021). Lichen-based critical loads for deposition of nitrogen and sulfur in US forests. Environmental Pollution. 291. 118187. 10.1016/j.envpol.2021.118187.
George, Eckhard, Horst Marschner, and Iver Jakobsen. "Role of arbuscular mycorrhizal fungi in uptake of phosphorus and nitrogen from soil." Critical reviews in biotechnology 15.3-4 (1995): 257-270.
Hildebrand, E., Skelly, J. M., and Fredericksen, T. S. 1996. Foliar response of ozone-sensitive hardwood trees species from 1991 to 1993 in Shenandoah National Park, Virginia. Can. J. For. Res. 26: 658–669. https://doi.org/10.1139/x26-076
Horn KJ, Thomas RQ, Clark CM, Pardo LH, Fenn ME, Lawrence GB, et al. (2018) Growth and survival relationships of 71 tree species with nitrogen and sulfur deposition across the conterminous U.S.. PLoS ONE 13(10): e0205296. https://doi.org/10.1371/journal.pone.0205296
Lee EH, Anderson CP, Beedlow PA, Tingey DT, Koike S, Dubois J, Kaylor SD, Novak K, Rice RB, Neufeld HS, Herrick JD. 2022. Ozone Exposure-Response Relationships Parametrized for Sixteen Tree Species with Varying Sensitivity in the United States. Atmospheric Environment. 284:1-16. https://irma.nps.gov/DataStore/Reference/Profile/2294221
Lilleskov, Erik A., et al. "Atmospheric nitrogen deposition impacts on the structure and function of forest mycorrhizal communities: a review." Environmental Pollution 246 (2019): 148-162.
McCoy K., M. D. Bell, and E. Felker-Quinn. 2021. Risk to epiphytic lichen communities in NPS units from atmospheric nitrogen and sulfur pollution: Changes in critical load exceedances from 2001‒2016. Natural Resource Report NPS/NRSS/ARD/NRR—2021/2299. National Park Service, Fort Collins, Colorado. https://doi.org/10.36967/nrr-2287254.
Moeykens, M. D. and Voshell, J. R. 2002. Studies of Benthic Macroinvertebrates for the Shenandoah National Park Long-Term Ecological Monitoring System: Statistical Analysis of LTEMS Aquatic Dataset from 1986 to 2000 on Water Chemistry, Habitat and Macroinvertebrates. Report to Shenandoah National Park from the Dept. of Entomology, Virginia Polytechnic and State University, Blacksburg, VA. 49 pp.
[NADP] National Atmospheric Deposition Program. 2018. NTN Data. Accessed January 20, 2022. Available at http://nadp.slh.wisc.edu/NADP/
[NAPAP] National Acid Precipitation Assessment Program. 1998. Biennial Report to Congress: An Integrated Assessment. National Acid Precipitation Assessment Program: Silver Spring, MD.
[NPS] National Park Service. 2022. Fish Consumption Advisories. https://www.nps.gov/subjects/fishing/fish-consumption-advisories.htm
Porter, E., Blett, T., Potter, D.U., Huber, C. 2005. Protecting resources on federal lands: Implications of critical loads for atmospheric deposition of nitrogen and sulfur. BioScience 55(7): 603–612. https://doi.org/10.1641/0006-3568(2005)055[0603:PROFLI]2.0.CO;2
Sanchini PJ. 1989. Extent of ozone injuries in Pinus strobus populations of five eastern national parks in 1986. HRI Report No. 150. Air Quality Division, National Park Service. Denver, CO. https://irma.nps.gov/DataStore/Reference/Profile/43362
Skelly, J.2016. Investigator Annual Report on Common and Tall Milkweed as bioindicators of ozone air pollution: NASA/GLOBE educational program "Surface Ozone Measurements and Using Sensitive Plants as Bioindicators of Ozone Air Pollution". National Park Service Research Permit and Reporting System. https://irma.nps.gov/RPRS/IAR/Profile/120843
Sullivan, T. J. 2016. Air quality related values (AQRVs) in national parks: Effects from ozone; visibility reducing particles; and atmospheric deposition of acids, nutrients and toxics. Natural Resource Report NPS/NRSS/ARD/NRR—2016/1196. National Park Service, Fort Collins, CO.
Sullivan, T. J., Cosby, B. J., Laurence, J. A., Dennis, R. L., Savig, K., Webb, J. R., Bulger, A. J., Scruggs, M., Gordon, C., Ray, J., Lee, E. H., Hogsett, W. E., Wayne, H., Miller, D., and Kern, J. S. 2003. Assessment of Air Quality and Related Values in Shenandoah National Park. National Park Service Technical Report NPS/NERCHAL/NRTR—03/090. NPS Northeast Region: Philadelphia, PA. Available at https://irma.nps.gov/DataStore/Reference/Profile/596260.
Webb, J. R., Cosby, B. J., Deviney, Jr., F. A., Galloway, J. N., Maben, S. W., and Bulger, A. J. 2004. Are brook trout streams in western Virginia and Shenandoah National Park recovering from acidification? Environmental Science and Technology 38: 4091–4096.
Welsch, D. L., Webb, J. R., and Cosby, B. J. 2001. Description of Summer 2000 Field Work: Collection of Soil Samples and Tree Corps in the Shenandoah National Park with Summary Soils Data. Dept. of Environ. Sciences: Univ. of Virginia.
Winner, W. E., Lefohn, A. S., Cotter, I. S., Greitner, C. S., Nellessen, J., McEvoy, Jr., L. R., Olson, R. L., Atkinson, C. J., and Moore, L. D. 1989. Plant responses to elevational gradients of ozone exposures in Virginia. Proceedings National Academy of Sciences 86: 8828–8832.
Last updated: September 30, 2024