Part of a series of articles titled Park Air Profiles.
Article
Park Air Profiles - Point Reyes National Seashore
Air Quality at Point Reyes National Seashore
Most visitors expect clean air and clear views in parks. Point Reyes National Seashore (NS), California is home to rocky headlands rising above the Pacific ocean, sand beaches, open grasslands, brushy hillsides, and forested ridges. The seashore enjoys relatively good air quality due to the prevailing westerly marine winds, but sometimes winds from the San Francisco Bay Area can bring air pollution to the seashore. Air pollutants blown into the park can harm natural and scenic resources such as soils, surface waters, plants, wildlife, and visibility. The National Park Service works to address air pollution effects at Point Reyes NS, and in parks across the U.S., through science, policy and planning, and by doing our part.
Nitrogen and Sulfur

Nitrogen (N) and sulfur (S) compounds deposited from the air may have harmful effects on ecosystem processes. Healthy ecosystems can naturally buffer a certain amount of pollution, but once a threshold is passed the ecosystem may respond negatively. This threshold is the critical load, or the amount of pollution above which harmful changes in sensitive ecosystems occur (Porter 2005). N and S deposition change ecosystems through eutrophication (N deposition) and acidification (N + S deposition). Eutrophication increases soil and water nutrients which causes some species to grow more quickly and changes community composition. Ecosystem sensitivity to nutrient N enrichment at Point Reyes National Seashore (PORE) relative to other national parks is high (Sullivan et al. 2016); for a full list of N sensitive ecosystem components, see: NPS ARD 2019. Acidification leaches important cations from soils, lakes, ponds, and streams which decreases habitat quality. Ecosystem sensitivity to acidification at PORE relative to other national parks is moderate (Sullivan et al. 2016); to search for acid-sensitive plant species, see: NPSpecies.
From 2017-2019 total N deposition in PORE ranged from 3.2 to 6.1 kg-N ha-1 yr-1 and total S deposition ranged from 1.1 to 2.3 kg-S ha-1 yr-1 based on the TDep model (NADP, 2018). See the conditions and trends website for park-specific information at PORE.
In certain areas of California N deposition plays an important role in the ongoing replacement of native plant species with exotic, invasive plant species in coastal sage scrub communities (Fenn et al. 2003). This can lead to increased fire frequency and a type conversion from shrublands to invaded grassland (Cox et al. 2016).
Epiphytic macrolichen community responses
Epiphytic macrolichens grow on tree trunks, branches, and boles. Since these lichens grow above the ground, they obtain all their nutrients directly from precipitation and the air. Many epiphytic lichen species have narrow environmental niches and are extremely sensitive to changes in air pollution. Epiphytic lichen communities are less diverse in arid areas, but are still impacted by air pollution Geiser et al. (2019) used a U.S. Forest Service national survey to develop critical loads of nitrogen (N) and critical loads of sulfur (S) to prevent more than a 20% decline in four lichen community metrics: total species richness, pollution sensitive species richness, forage lichen abundance, and cyanolichen abundance.
McCoy et al. (2021) used forested area from the National Land Cover Database to estimate the impact of air pollution on epiphytic lichen communities. Forested area makes up 96.2 km2 (33.1%) of the land area of Point Reyes National Seashore.
- N deposition exceeded the 3.1 kg-N ha-1 yr-1 critical load to protect N-sensitive lichen species richness in 99.3% of the forested area.
- S deposition was below the 2.7 kg-S ha-1 yr-1 critical load to protect S-sensitive lichen species richness in every part of the forested area.
For exceedances of other lichen metrics and the predicted decline of lichen communities see Appendices A and B of McCoy et al. (2021).
Additional modeling was done on 459 lichen species to test the combined effects of air pollution and climate gradients (Geiser et al. 2021). A critical load indicative of initial shifts from pollution-sensitive toward pollution-tolerant species occurred at 1.5 kg-N ha-1 yr-1 and 2.7 kg-S ha-1 yr-1 even under changing climate regimes.
Plant species response
Plants vary in their tolerance of eutrophication and acidification, and some plant species respond to nitrogen (N) or sulfur (S) pollution with declines in growth, survival, or abundance on the landscape. Horn et al. (2018) used the U.S. Forest Service national forest survey to develop critical loads of N and critical loads of S to prevent declines in growth or survival of sensitive tree species. Clark et al. (2019) used a database of plant community surveys to develop critical loads of N and critical loads of S to prevent a decline in abundance of sensitive herbaceous plant species. According to NPSpecies, Point Reyes National Seashore contains:
- 3 N-sensitive tree species and 11 N-sensitive herbaceous species.
- 5 S-sensitive tree species and 10 S-sensitive herbaceous species.
Mycorrhizal fungi community response
Many plants have a symbiotic relationship with mycorrhizal fungi (MF). Through the roots, the plants supply the fungi with carbon from photosynthesis and in exchange the MF enhance nutrient availability within soils, increase drought tolerance, and provide physical resistance to soil erosion (George et al., 1995; Cheng et al., 2021; Burri et al., 2013). Anthropogenic Nitrogen (N) deposition can disrupt this symbiotic relationship resulting in a shift from N sensitive to N tolerant mycorrhizal fungi and plant communities.
With increased N deposition to the soil, MF become less important for nutrient uptake and many plants will cease the exchange of nutrients altogether making them more vulnerable to stressors such as drought (Lilleskov et al., 2019). The CL-N for the shift in mycorrhizal community is 5-6 kg-N ha-1 yr-1 in coniferous forests and 10-20 kg-N ha-1 yr-1 broadleaf forests.
Point Reyes National Seashore has 84.9 km2 of coniferous forests, 3.3 km2 of broadleaf forests, and 36.6 km2 of mixed forests. Using the range in critical loads above, the minimum CL is exceeded in 47.5% of forested area and the maximum CL is exceeded in 42.8% of forested area based on 2019-2021 TDep Total N deposition.
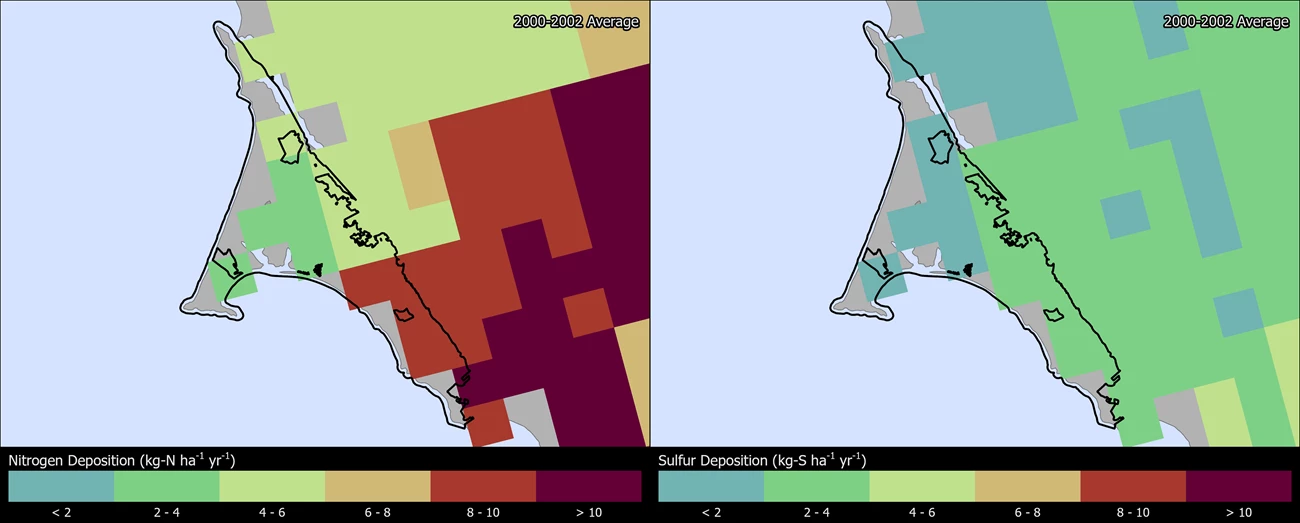
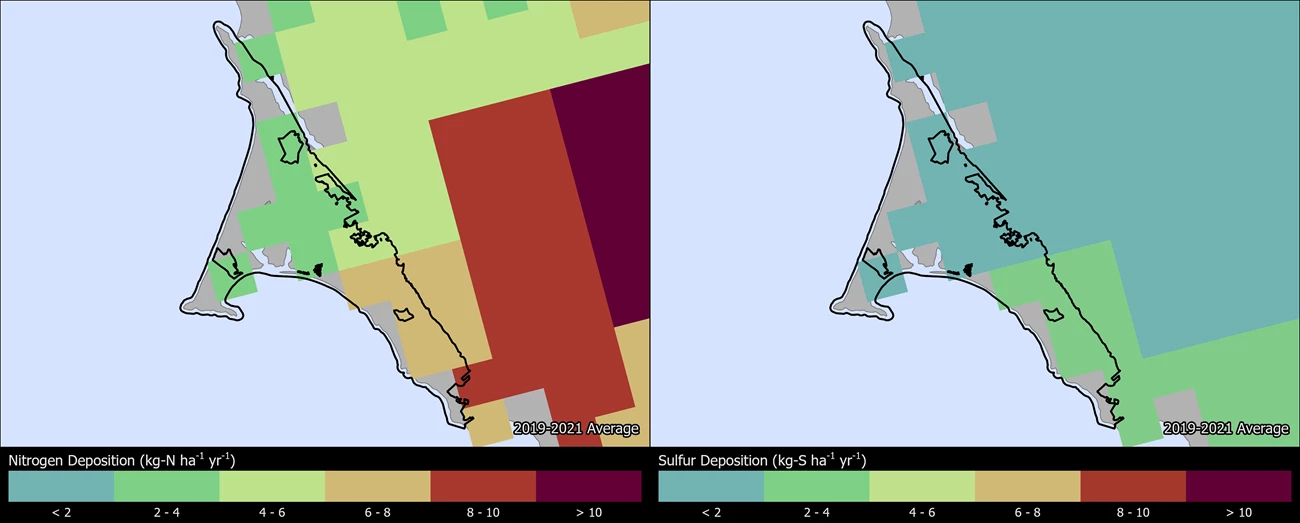
Change in N and S deposition from 2000 to 2021
The maps below show how the spatial distribution of estimated Total N and Total S deposition in PORE has changed from 2000-2002 to 2019-2021 (TDep MMF version 2022.02). Slide the arrows in the middle of the image up and down to compare N and S deposition between the two years (Yearly Data).
- Minimum N deposition decreased from 3.0 to 2.4 kg-N ha-1 yr-1 and maximum N deposition decreased from 9.4 to 7.4 kg-N ha-1 yr-1.
- Minimum S deposition decreased from 1.7 to 1.3 kg-S ha-1 yr-1 and maximum S deposition decreased from 2.8 to 2.2 kg-S ha-1 yr-1.
Persistent Pollutants
Pollutants like mercury and pesticides are concerning because they are persistent and toxic in the environment. These contaminants can travel in the air thousands of miles away from the source of pollution, even depositing in protected places like national parks. In addition, while some of these harmful pollutants may be banned from use, historically contaminated sites continue to endure negative environmental consequences.
When deposited, airborne mercury and other toxic air contaminants are known to harm wildlife like birds and fish, and cause human health concerns. Many of these substances enter the food chain and accumulate in the tissue of organisms causing reduced reproductive success, impaired growth and development, and decreased survival.
- Elevated mercury concentrations have been found in lichens from the seashore at high elevation sites that intercept fog (Bennett and Benson 2005). Marine fog is a stabilizing medium for the toxic form of mercury, methylmercury, and is one of many sources that may carry mercury inward and impact coastal food webs (Weiss-Penzias et al. 2019).
- Pesticides toxic to fish and bees and most likely to drift into park boundaries due to application in the counties surrounding Point Reyes National Seashore are fungicides like Difenoconazole, Fludioxonil, Trifloxystrobin, and Pyraclostrobin (Meyer and DeMars 2018).
Fish consumption advisories may be in effect for mercury and other contaminants (NPS 2022). The NPS Air Resources Division reports on park conditions and trends for mercury. Visit the webpage to learn more.
Visibility

Many visitors come to Point Reyes NS to enjoy views of the coast from this narrow, steep-ridged peninsula. Natural fog and humidity sometimes form over the ocean and blanket the seashore, obscuring spectacular vistas, and occasionally the vistas are obscured by human-caused haze. Haze reduces how well and how far people can see. Visibility reducing haze is caused by tiny particles in the air, and these particles can also affect human health. Many of the same pollutants that ultimately fall out as nitrogen and sulfur deposition contribute to this haze. Organic compounds, soot, and dust reduce visibility as well. Significant improvements in park visibility have been documented since the 1990’s. Still, visibility in the park needs improvement to reach the Clean Air Act goal of no human caused impairment.
Visibility effects:
- Reduced visibility on some days due to human-caused haze and fine particles of air pollution;
- Reduction of the average natural visual range from about 90 miles (without the effects of pollution) to about 70 miles because of pollution at the park;
- Reduction of the visual range from about 50 miles to below 35 miles on high pollution days.
Visit the NPS air quality conditions and trends website for park-specific visibility information. Point Reyes NS has been monitoring visibility since 1989. View a live air quality webcam, and explore air monitoring »
Ground-Level Ozone

At ground level, ozone is harmful to human health and the environment. Ground-level ozone does not come directly from smokestacks or vehicles, but instead is formed when other pollutants, mainly nitrogen oxides and volatile organic compounds, react in the presence of sunlight.
Over the course of a growing season, ozone can damage plant tissues making it harder for plants to produce and store food. It also weakens plants making them less resistant to disease and insect infestations. Some plants are more sensitive to ozone than others. Ozone concentrations and seasonal exposures at Point Reyes NS are unlikely to cause plant injury or reduced growth (Sullivan et al. 2001). However, several park species, including Artemisia douglasiana (Douglas’ sagewort) and Sambucus mexicana (blue elderberry), are known to be sensitive to ozone. Search for more ozone-sensitive plant species found at Point Reyes NS.
Visit the NPS air quality conditions and trends website for park-specific ozone information.
Explore Other Park Air Profiles
There are 47 other Park Air Profiles covering parks across the United States and its territories.
References
Bennett, J. P. and Benson, S. 2005. Elemental content of lichens of the Point Reyes Peninsula, northern California. Sci Total Environ. 343 (1–3): 199–206. Available at: https://irma.nps.gov/DataStore/Reference/Profile/664018
Burri, K., C. Gromke, and F. Graf. "Mycorrhizal fungi protect the soil from wind erosion: a wind tunnel study." Land Degradation & Development 24.4 (2013): 385-392.
Cheng, Shen, et al. "Elucidating the mechanisms underlying enhanced drought tolerance in plants mediated by arbuscular mycorrhizal fungi." Frontiers in Microbiology 12 (2021): 809473.
Clark, C.M., Simkin, S.M., Allen, E.B. et al. Potential vulnerability of 348 herbaceous species to atmospheric deposition of nitrogen and sulfur in the United States. Nat. Plants 5, 697–705 (2019). https://doi.org/10.1038/s41477-019-0442-8
Cox, R. D., K. L. Preston, R. F. Johnson, R. A. Minnich, and E. B. Allen. 2014. Influence of landscape-scale variables on vegetation conversion to exotic annual grassland in southern California, USA. Global Ecology and Conservation 2:190-203.
Fenn, M. E., Haeuber, G. S., Tonnesen, J. S., Baron, J. S., Grossman-Clarke, S., Hope, D., Jaffe, D. A., Copeland, S., Geiser, L., Rueth, H. M., and Sickman, J. O. 2003. Nitrogen emissions, deposition and monitoring in the western United States. Bioscience 53: 391–403.
Geiser, Linda & Nelson, Peter & Jovan, Sarah & Root, Heather & Clark, Christopher. (2019). Assessing Ecological Risks from Atmospheric Deposition of Nitrogen and Sulfur to US Forests Using Epiphytic Macrolichens. Diversity. 11. 87. 10.3390/d11060087.
Geiser, Linda & Root, Heather & Smith, Robert & Jovan, Sarah & Clair, Larry & Dillman, Karen. (2021). Lichen-based critical loads for deposition of nitrogen and sulfur in US forests. Environmental Pollution. 291. 118187. 10.1016/j.envpol.2021.118187.
George, Eckhard, Horst Marschner, and Iver Jakobsen. "Role of arbuscular mycorrhizal fungi in uptake of phosphorus and nitrogen from soil." Critical reviews in biotechnology 15.3-4 (1995): 257-270.
Horn KJ, Thomas RQ, Clark CM, Pardo LH, Fenn ME, Lawrence GB, et al. (2018) Growth and survival relationships of 71 tree species with nitrogen and sulfur deposition across the conterminous U.S.. PLoS ONE 13(10): e0205296. https://doi.org/10.1371/journal.pone.0205296
Lilleskov, Erik A., et al. "Atmospheric nitrogen deposition impacts on the structure and function of forest mycorrhizal communities: a review." Environmental Pollution 246 (2019): 148-162.
McCoy K., M. D. Bell, and E. Felker-Quinn. 2021. Risk to epiphytic lichen communities in NPS units from atmospheric nitrogen and sulfur pollution: Changes in critical load exceedances from 2001‒2016. Natural Resource Report NPS/NRSS/ARD/NRR—2021/2299. National Park Service, Fort Collins, Colorado. https://doi.org/10.36967/nrr-2287254.
Meyer, Erik and Christopher DeMars. 2018. A Simplified Approach to Using Pesticide Use Reporting To Prioritize Pesticide Risk in California’s National Parks. https://doi.org/10.1021/bk-2018-1283.ch018
[NADP] National Atmospheric Deposition Program. 2018. NTN Data. Accessed January 20, 2022. Available at http://nadp.slh.wisc.edu/NADP/
[NPS] National Park Service. 2022. Fish Consumption Advisories. https://www.nps.gov/subjects/fishing/fish-consumption-advisories.htm
Porter, E., Blett, T., Potter, D.U., Huber, C. 2005. Protecting resources on federal lands: Implications of critical loads for atmospheric deposition of nitrogen and sulfur. BioScience 55(7): 603–612. https://doi.org/10.1641/0006-3568(2005)055[0603:PROFLI]2.0.CO;2
Sullivan, T. J. 2016. Air quality related values (AQRVs) in national parks: Effects from ozone; visibility reducing particles; and atmospheric deposition of acids, nutrients and toxics. Natural Resource Report NPS/NRSS/ARD/NRR—2016/1196. National Park Service, Fort Collins, CO.
Sullivan, T. J., Peterson, D. L., Blanchard, C. L. 2001. Assessment of Air Quality and Air Pollutant Impacts in Class I National Parks of California. National Park Service. 421 pp. Available at https://irma.nps.gov/DataStore/Reference/Profile/561620.
Weiss-Penzias, P.S., Bank, M.S., Clifford, D.L. et al. 2019. Marine fog inputs appear to increase methylmercury bioaccumulation in a coastal terrestrial food web. Sci Rep 9, 17611. https://doi.org/10.1038/s41598-019-54056-7
Last updated: August 6, 2024