Part of a series of articles titled Park Air Profiles.
Article
Park Air Profiles - Pinnacles National Park
Air Quality at Pinnacles National Park
Most visitors expect clean air and clear views in parks. Pinnacles National Park (NP), California, is a spectacular landscape formed by ancient volcanoes and covered by mixed chaparral and oak woodlands. Air quality in the park is sometimes affected by pollution from mobile sources, road dust, agricultural activities, and burning. Air pollutants blown into the park from the San Francisco Bay Area to the north and beyond can harm natural and scenic resources such as soils, surface waters, plants, wildlife, and visibility. The National Park Service works to address air pollution effects at Pinnacles NP, and in parks across the U.S., through science, policy and planning, and by doing our part.
Nitrogen and Sulfur

Nitrogen (N) and sulfur (S) compounds deposited from the air may have harmful effects on ecosystem processes. Healthy ecosystems can naturally buffer a certain amount of pollution, but once a threshold is passed the ecosystem may respond negatively. This threshold is the critical load, or the amount of pollution above which harmful changes in sensitive ecosystems occur (Porter 2005). N and S deposition change ecosystems through eutrophication (N deposition) and acidification (N + S deposition). Eutrophication increases soil and water nutrients which causes some species to grow more quickly and changes community composition. Ecosystem sensitivity to nutrient N enrichment at Pinnacles National Park (PINN) relative to other national parks is high (Sullivan et al. 2016); for a full list of N sensitive ecosystem components, see: NPS ARD 2019. Acidification leaches important cations from soils, lakes, ponds, and streams which decreases habitat quality. Ecosystem sensitivity to acidification at PINN relative to other national parks is high (Sullivan et al. 2016); to search for acid-sensitive plant species, see: NPSpecies.
From 2017-2019 total N deposition in PINN ranged from 2.8 to 2.9 kg-N ha-1 yr-1 and total S deposition of 0.6 kg-S ha-1 yr-1 based on the TDep model (NADP, 2018). PINN has been monitoring atmospheric N and S deposition since 1999, see the conditions and trends website for park-specific information.
While N deposition levels are low at PINN, other areas of California with elevated N levels have seen weedy annual grasses spreading to shrublands, grasslands, and coastal chaparral communities, similar to those currently present at PINN (Fenn et al. 2003).
Steep-sided watersheds and very small uppermost streams found at PINN are typically associated with high acid sensitivity, although the high availability of base cations in the soils and streams helps to buffer acid deposition (Sullivan et al. 2016). Canyon live oak is the only identified acid-sensitive plant species found in the park.
Epiphytic macrolichen community responses
Epiphytic macrolichens grow on tree trunks, branches, and boles. Since these lichens grow above the ground, they obtain all their nutrients directly from precipitation and the air. Many epiphytic lichen species have narrow environmental niches and are extremely sensitive to changes in air pollution. Geiser et al. (2019) used a U.S. Forest Service national survey to develop critical loads of nitrogen (N) and critical loads of sulfur (S) to prevent more than a 20% decline in four lichen community metrics: total species richness, pollution sensitive species richness, forage lichen abundance, and cyanolichen abundance.
McCoy et al. (2021) used forested area from the National Land Cover Database to estimate the impact of air pollution on epiphytic lichen communities. Forested area makes up 6.1 km2 (5.7%) of the land area of Pinnacles National Park.
- N deposition was below the 3.1 kg-N ha-1 yr-1 critical load to protect N-sensitive lichen species richness in every part of the forested area.
- S deposition was below the 2.7 kg-S ha-1 yr-1 critical load to protect S-sensitive lichen species richness in every part of the forested area.
For exceedances of other lichen metrics and the predicted decline of lichen communities see Appendices A and B of McCoy et al. (2021).
Additional modeling was done on 459 lichen species to test the combined effects of air pollution and climate gradients (Geiser et al. 2021). A critical load indicative of initial shifts from pollution-sensitive toward pollution-tolerant species occurred at 1.5 kg-N ha-1 yr-1 and 2.7 kg-S ha-1 yr-1 even under changing climate regimes.
Plant species response
Plants vary in their tolerance of eutrophication and acidification, and some plant species respond to nitrogen (N) or sulfur (S) pollution with declines in growth, survival, or abundance on the landscape. Horn et al. (2018) used the U.S. Forest Service national forest survey to develop critical loads of N and critical loads of S to prevent declines in growth or survival of sensitive tree species. Clark et al. (2019) used a database of plant community surveys to develop critical loads of N and critical loads of S to prevent a decline in abundance of sensitive herbaceous plant species. According to NPSpecies, Pinnacles National Park contains:
- 0 N-sensitive tree species and 6 N-sensitive herbaceous species.
- 1 S-sensitive tree species and 6 S-sensitive herbaceous species.
Mycorrhizal fungi community response
Many plants have a symbiotic relationship with mycorrhizal fungi (MF). Through the roots, the plants supply the fungi with carbon from photosynthesis and in exchange the MF enhance nutrient availability within soils, increase drought tolerance, and provide physical resistance to soil erosion (George et al., 1995; Cheng et al., 2021; Burri et al., 2013). Anthropogenic Nitrogen (N) deposition can disrupt this symbiotic relationship resulting in a shift from N sensitive to N tolerant mycorrhizal fungi and plant communities.
With increased N deposition to the soil, MF become less important for nutrient uptake and many plants will cease the exchange of nutrients altogether making them more vulnerable to stressors such as drought (Lilleskov et al., 2019). The CL-N for the shift in mycorrhizal community is 5-6 kg-N ha-1 yr-1 in coniferous forests and 10-20 kg-N ha-1 yr-1 broadleaf forests.
Pinnacles National Park has 10.6 km2 of coniferous forests and 8.6 km2 of mixed forests. Using the range in critical loads above, the minimum CL is exceeded in 0% of forested area and the maximum CL is exceeded in 0% of forested area based on 2019-2021 TDep Total N deposition.
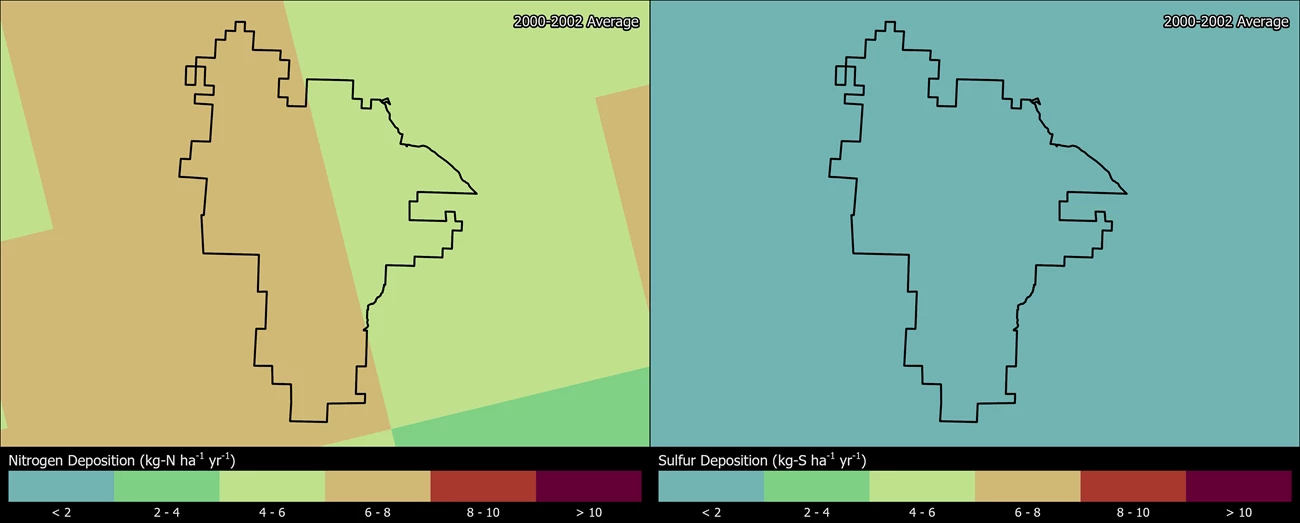
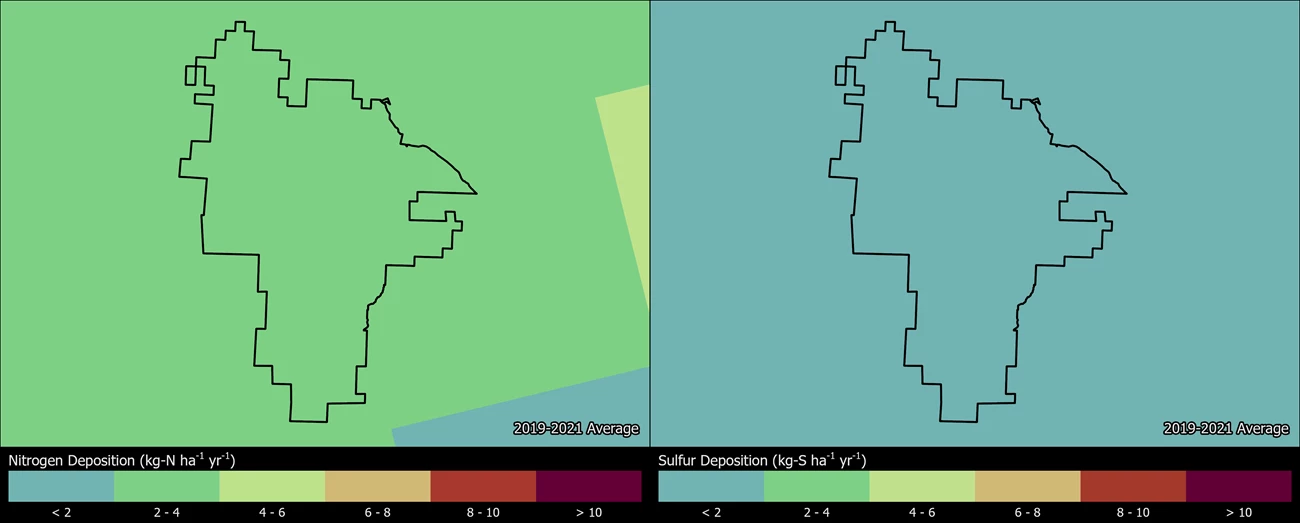
Change in N and S deposition from 2000 to 2021
The maps below show how the spatial distribution of estimated Total N and Total S deposition in PINN has changed from 2000-2002 to 2019-2021 (TDep MMF version 2022.02). Slide the arrows in the middle of the image up and down to compare N and S deposition between the two years (Yearly Data).
- Minimum N deposition decreased from 6.5 to 3.9 kg-N ha-1 yr-1 and maximum N deposition decreased from 6.6 to 3.9 kg-N ha-1 yr-1.
- Minimum S deposition decreased from 0.9 to 0.6 kg-S ha-1 yr-1 and maximum S deposition decreased from 0.9 to 0.6 kg-S ha-1 yr-1.
Persistent Pollutants
Pollutants like mercury and pesticides are concerning because they are persistent and toxic in the environment. These contaminants can travel in the air thousands of miles away from the source of pollution, even depositing in protected places like national parks. In addition, while some of these harmful pollutants may be banned from use, historically contaminated sites continue to endure negative environmental consequences.
When deposited, airborne mercury and other toxic air contaminants are known to harm wildlife like birds and fish, and cause human health concerns. Many of these substances enter the food chain and accumulate in the tissue of organisms causing reduced reproductive success, impaired growth and development, and decreased survival.
- Some dragonfly larvae sampled at Pinnacles NP had mercury concentrations at moderate or higher impairment levels. Dragonfly larvae have been sampled and analyzed for mercury from three sites in the park; 40% of the data fall into the moderate (100-300 ng/g dw) and 60% fall into the high/severe (>300 ng/g dw) impairment categories for potential mercury risk. An index of moderate impairment or higher suggests some fish may exceed the US EPA benchmark for protection of human health (Eagles-Smith et al. 2018; Eagles-Smith et al. 2020). However, the data may not reflect the risk at other unsampled locations in the park.
- Pesticides toxic to fish and bees and most likely to drift into park boundaries due to application in the counties surrounding Pinnacles NP are fumigants like Chloropicrin, 1,3-Dichloropropene, and Methyl Bromide (Meyer and DeMars 2018).
Fish consumption advisories may be in effect for mercury and other contaminants (NPS 2022). The NPS Air Resources Division reports on park conditions and trends for mercury. Visit the webpage to learn more.
Visibility

Visitors come to Pinnacles NP to enjoy spectacular views of the namesake rock pinnacles and chaparral-covered Gabilan Mountains. Park vistas are sometimes obscured by haze, reducing how well and how far people can see. Visibility reducing haze is caused by tiny particles in the air, and these particles can also affect human health. Many of the same pollutants that ultimately fall out as nitrogen and sulfur deposition contribute to this haze. Organic compounds, soot, dust, and wood smoke reduce visibility as well. Smoke from regional wildfires also contribute to particulate matter at the park. Significant improvements in park visibility have been documented since the late 1980’s. Overall, visibility in the park still needs improvement to reach the Clean Air Act goal of no human caused impairment.
Visibility effects:
- Reduced visibility, at times, due to human-caused haze from fine particles of air pollution;
- Reduction of the average natural visual range from about 140 miles (without pollution) to about 80 miles because of pollution at the park;
- Reduction of the visual range to below 50 miles on high pollution days.
Visit the NPS air quality conditions and trends website for park-specific visibility information. Pinnacles NP has been monitoring visibility since 1988. Explore air monitoring »
Ground-Level Ozone

At ground level, ozone is harmful to human health and the environment. Ground-level ozone does not come directly from smokestacks or vehicles, but instead is formed when other pollutants, mainly nitrogen oxides and volatile organic compounds, react in the presence of sunlight.
During the summer months, ozone levels in the park occasionally exceed the National Ambient Air Quality Standards set by the U.S. Environmental Protection Agency to protect public health. Ozone is a respiratory irritant, causing coughing, sinus inflammation, chest pains, scratchy throat, lung damage, and reduced immune system functions. Children, the elderly, people with existing health problems, and active adults are most vulnerable. When ozone levels exceed, or are predicted to exceed, health standards, Pinnacles NP staff post health advisories cautioning staff and visitors of the potential health risks associated with exposures to elevated levels.
Over the course of a growing season, ozone can also damage plant tissues making it harder for plants to produce and store food.It weakens plants making them less resistant to disease and insect infestations. A risk assessment that considered ozone exposure, soil moisture, and sensitive plant species concluded that plants in Pinnacles NP were at high risk of ozone damage relative to other national parks (Sullivan et al. 2001; Kohut 2007, 2004). The USDA Forest Service surveyed two forested sites near the park for ozone damage to plants and found a high level of injury at one site but none at the other site (Campbell et al. 2007). Some plants are more sensitive to ozone than others. Ozone-sensitive plants at Pinnacles NP include Artemisia douglasiana (mugwort), Sambucus mexicana (blue elderberry), and Apocynum cannabinum (Indian hemp). Search for more ozone-sensitive plant species found at Pinnacles NP.
Visit the NPS air quality conditions and trends website for park-specific ozone information. Pinnacles NP has been monitoring ozone since 1988. View live ozone and meteorology data and explore air monitoring »
Explore Other Park Air Profiles
There are 47 other Park Air Profiles covering parks across the United States and its territories.
References
Burri, K., C. Gromke, and F. Graf. "Mycorrhizal fungi protect the soil from wind erosion: a wind tunnel study." Land Degradation & Development 24.4 (2013): 385-392.
Campbell, S. J., Wanek, R. Coulston, J. W. 2007. Ozone injury in west coast forests: 6 years of monitoring. General Technical Report. PNW-GTR-722. Portland, OR: U.S. Department of Agriculture, Forest Service, Pacific Northwest Research Station. 53 p. Available at https://www.fs.usda.gov/treesearch/pubs/27926.
Cheng, Shen, et al. "Elucidating the mechanisms underlying enhanced drought tolerance in plants mediated by arbuscular mycorrhizal fungi." Frontiers in Microbiology 12 (2021): 809473.
Clark, C.M., Simkin, S.M., Allen, E.B. et al. Potential vulnerability of 348 herbaceous species to atmospheric deposition of nitrogen and sulfur in the United States. Nat. Plants 5, 697–705 (2019). https://doi.org/10.1038/s41477-019-0442-8
Eagles-Smith, C.A., S.J. Nelson., C.M. Flanagan Pritz, J.J. Willacker Jr., and A. Klemmer. 2018. Total Mercury Concentrations in Dragonfly Larvae from U.S. National Parks (ver. 6.0, June 2021): U.S. Geological Survey data release. https://doi.org/10.5066/P9TK6NPT
Eagles-Smith, C.A., J.J. Willacker, S.J. Nelson, C.M. Flanagan Pritz, D.P. Krabbenhoft, C.Y. Chen, J.T. Ackerman, E.H. Campbell Grant, and D.S. Pilliod. 2020. Dragonflies as biosentinels of mercury availability in aquatic food webs of national parks throughout the United States. Environmental Science and Technology 54(14):8779-8790. https://doi.org/10.1021/acs.est.0c01255
Fenn, M. E., Haeuber, G. S., Tonnesen, J. S., Baron, J. S., Grossman-Clarke, S., Hope, D., Jaffe, D. A., Copeland, S., Geiser, L., Rueth, H. M., and Sickman, J. O. 2003. Nitrogen emissions, deposition and monitoring in the western United States. Bioscience 53: 391–403.
Geiser, Linda & Nelson, Peter & Jovan, Sarah & Root, Heather & Clark, Christopher. (2019). Assessing Ecological Risks from Atmospheric Deposition of Nitrogen and Sulfur to US Forests Using Epiphytic Macrolichens. Diversity. 11. 87. 10.3390/d11060087.
Geiser, Linda & Root, Heather & Smith, Robert & Jovan, Sarah & Clair, Larry & Dillman, Karen. (2021). Lichen-based critical loads for deposition of nitrogen and sulfur in US forests. Environmental Pollution. 291. 118187. 10.1016/j.envpol.2021.118187.
George, Eckhard, Horst Marschner, and Iver Jakobsen. "Role of arbuscular mycorrhizal fungi in uptake of phosphorus and nitrogen from soil." Critical reviews in biotechnology 15.3-4 (1995): 257-270.
Horn KJ, Thomas RQ, Clark CM, Pardo LH, Fenn ME, Lawrence GB, et al. (2018) Growth and survival relationships of 71 tree species with nitrogen and sulfur deposition across the conterminous U.S.. PLoS ONE 13(10): e0205296. https://doi.org/10.1371/journal.pone.0205296
Kohut R.J. 2007. Ozone Risk Assessment for Vital Signs Monitoring Networks, Appalachian National Scenic Trail, and Natchez Trace National Scenic Trail. NPS/NRPC/ARD/NRTR—2007/001. National Park Service. Fort Collins, Colorado. Available at https://www.nps.gov/articles/ozone-risk-assessment.htm
Kohut, R. 2004. Assessing the Risk of Foliar Injury from Ozone on Vegetation in Parks in the San Francisco Bay Area Network. Available at https://irma.nps.gov/DataStore/Reference/Profile/2181550.
Lilleskov, Erik A., et al. "Atmospheric nitrogen deposition impacts on the structure and function of forest mycorrhizal communities: a review." Environmental Pollution 246 (2019): 148-162.
McCoy K., M. D. Bell, and E. Felker-Quinn. 2021. Risk to epiphytic lichen communities in NPS units from atmospheric nitrogen and sulfur pollution: Changes in critical load exceedances from 2001‒2016. Natural Resource Report NPS/NRSS/ARD/NRR—2021/2299. National Park Service, Fort Collins, Colorado. https://doi.org/10.36967/nrr-2287254.
Meyer, Erik and Christopher DeMars. 2018. A Simplified Approach to Using Pesticide Use Reporting To Prioritize Pesticide Risk in California’s National Parks. https://doi.org/10.1021/bk-2018-1283.ch018
[NADP] National Atmospheric Deposition Program. 2018. NTN Data. Accessed January 20, 2022. Available at http://nadp.slh.wisc.edu/NADP/
[NPS] National Park Service. 2022. Fish Consumption Advisories. https://www.nps.gov/subjects/fishing/fish-consumption-advisories.htm
Porter, E., Blett, T., Potter, D.U., Huber, C. 2005. Protecting resources on federal lands: Implications of critical loads for atmospheric deposition of nitrogen and sulfur. BioScience 55(7): 603–612. https://doi.org/10.1641/0006-3568(2005)055[0603:PROFLI]2.0.CO;2
Sullivan, T. J. 2016. Air quality related values (AQRVs) in national parks: Effects from ozone; visibility reducing particles; and atmospheric deposition of acids, nutrients and toxics. Natural Resource Report NPS/NRSS/ARD/NRR—2016/1196. National Park Service, Fort Collins, CO.
Sullivan, T. J., Peterson, D. L., Blanchard, C. L. 2001. Assessment of Air Quality and Air Pollutant Impacts in Class I National Parks of California. National Park Service. 421 pp. Available at https://irma.nps.gov/DataStore/Reference/Profile/561620.
Last updated: August 6, 2024