Part of a series of articles titled Park Air Profiles.
Article
Park Air Profiles - Mount Rainier National Park
Air Quality at Mount Rainier National Park
Most visitors expect clean air and clear views in parks. Mount Rainier National Park (NP), Washington, is home to one of the most iconic peaks in the U.S., an active volcano that supplies the headwaters for five major rivers. The park is also downwind of mobile and stationary pollutant sources, including the Puget Sound urban zone, agricultural areas, industry, and coal-burning power production. In addition, pollutants traveling across the Pacific Ocean from Asia, and pollutants from Europe and eastern North America that circumnavigate the globe, are deposited in lakes, streams, and on land at high elevations in the Cascade mountain range. The National Park Service works to address air pollution effects at Mount Rainier NP, and in parks across the U.S., through science, policy and planning, and by doing our part.
Nitrogen and Sulfur

Nitrogen (N) and sulfur (S) compounds deposited from the air may have harmful effects on ecosystem processes. Healthy ecosystems can naturally buffer a certain amount of pollution, but once a threshold is passed the ecosystem may respond negatively. This threshold is the critical load, or the amount of pollution above which harmful changes in sensitive ecosystems occur (Porter 2005). N and S deposition change ecosystems through eutrophication (N deposition) and acidification (N + S deposition). Eutrophication increases soil and water nutrients which causes some species to grow more quickly and changes community composition. Ecosystem sensitivity to nutrient N enrichment at Mount Rainier National Park (MORA) relative to other national parks is very high (Sullivan et al. 2016); for a full list of N sensitive ecosystem components, see: NPS ARD 2019. Acidification leaches important cations from soils, lakes, ponds, and streams which decreases habitat quality. Ecosystem sensitivity to acidification at MORA relative to other national parks is very high (Sullivan et al. 2016); to search for acid-sensitive plant species, see: NPSpecies.
From 2017-2019 total N deposition in MORA ranged from 1.8 to 3.2 kg-N ha-1 yr-1 and total S deposition ranged from 0.9 to 1.8 kg-S ha-1 yr-1 based on the TDep model (NADP, 2018). MORA has been monitoring atmospheric N and S deposition since 1999, see the conditions and trends website for park-specific information.
Alpine ecosystem effects
Alpine environments are particularly vulnerable to large inputs of reactive nitrogen because of the sparse cover of vegetation, short growing seasons, large areas of exposed bedrock and talus, and snowmelt nutrient releases (Williams et al., 1996; Nanus et al., 2012). Approximately 15% of the land area in MORA is alpine (~328 km2 above 1550 m). McClung et al. (2020) compared the 2015 estimated total N deposition (TDep; NADP, 2018) to the critical load of N for an increase in alpine sedge growth (alpine plant critical load = 3 kg-N ha-1yr-1) and the critical load of N for alpine soil nitrate leaching (alpine soil critical load = 10 kg-N ha-1yr-1; Bowman et al., 2012). They found that deposition exceeded the alpine plant critical load in 81% of the park’s alpine area, but was below the alpine soil critical load throughout the park’s entire alpine area.
Additional N and S Research:- Elevated and increasing concentrations of ammonium, a N compound that often comes from agriculture, in deposition (NPS 2010)
- Elevated concentrations of acidic compounds in precipitation, compared to background levels at nearby Olympic NP (Nieber et al. 2009)
- Spring snowmelt, late summer storms, or rain-on-snow can cause highly acidic deposition events that are harmful to aquatic life and amphibians (Clow and Campbell 2008)
- Episodic acidification of Eunice Lake, one of many lakes in MORA sensitive to acidification (Samora and Clow 2002)
Epiphytic macrolichen community responses
Epiphytic macrolichens grow on tree trunks, branches, and boles. Since these lichens grow above the ground, they obtain all their nutrients directly from precipitation and the air. Many epiphytic lichen species have narrow environmental niches and are extremely sensitive to changes in air pollution. Geiser et al. (2019) used a U.S. Forest Service national survey to develop critical loads of nitrogen (N) and critical loads of sulfur (S) to prevent more than a 20% decline in four lichen community metrics: total species richness, pollution sensitive species richness, forage lichen abundance, and cyanolichen abundance.
McCoy et al. (2021) used forested area from the National Land Cover Database to estimate the impact of air pollution on epiphytic lichen communities. Forested area makes up 625 km2 (65.3%) of the land area of Mount Rainier National Park.
- N deposition exceeded the 3.1 kg-N ha-1 yr-1 critical load to protect N-sensitive lichen species richness in 6.3% of the forested area.
- S deposition was below the 2.7 kg-S ha-1 yr-1 critical load to protect S-sensitive lichen species richness in every part of the forested area.
For exceedances of other lichen metrics and the predicted decline of lichen communities see Appendices A and B of McCoy et al. (2021).
Additional modeling was done on 459 lichen species to test the combined effects of air pollution and climate gradients (Geiser et al. 2021). A critical load indicative of initial shifts from pollution-sensitive toward pollution-tolerant species occurred at 1.5 kg-N ha-1 yr-1 and 2.7 kg-S ha-1 yr-1 even under changing climate regimes.
Plant species response
Plants vary in their tolerance of eutrophication and acidification, and some plant species respond to nitrogen (N) or sulfur (S) pollution with declines in growth, survival, or abundance on the landscape. Horn et al. (2018) used the U.S. Forest Service national forest survey to develop critical loads of N and critical loads of S to prevent declines in growth or survival of sensitive tree species. Clark et al. (2019) used a database of plant community surveys to develop critical loads of N and critical loads of S to prevent a decline in abundance of sensitive herbaceous plant species. According to NPSpecies, Mount Rainier National Park contains:
- 7 N-sensitive tree species and 26 N-sensitive herbaceous species.
- 7 S-sensitive tree species and 18 S-sensitive herbaceous species.
Mycorrhizal fungi community response
Many plants have a symbiotic relationship with mycorrhizal fungi (MF). Through the roots, the plants supply the fungi with carbon from photosynthesis and in exchange the MF enhance nutrient availability within soils, increase drought tolerance, and provide physical resistance to soil erosion (George et al., 1995; Cheng et al., 2021; Burri et al., 2013). Anthropogenic Nitrogen (N) deposition can disrupt this symbiotic relationship resulting in a shift from N sensitive to N tolerant mycorrhizal fungi and plant communities.
With increased N deposition to the soil, MF become less important for nutrient uptake and many plants will cease the exchange of nutrients altogether making them more vulnerable to stressors such as drought (Lilleskov et al., 2019). The CL-N for the shift in mycorrhizal community is 5-6 kg-N ha-1 yr-1 in coniferous forests and 10-20 kg-N ha-1 yr-1 broadleaf forests.
Mount Rainier National Park has 735.3 km2 of coniferous forests, 0.2 km2 of broadleaf forests, and 1.6 km2 of mixed forests. Using the range in critical loads above, the minimum CL is exceeded in 5% of forested area and the maximum CL is exceeded in 5% of forested area based on 2019-2021 TDep Total N deposition.
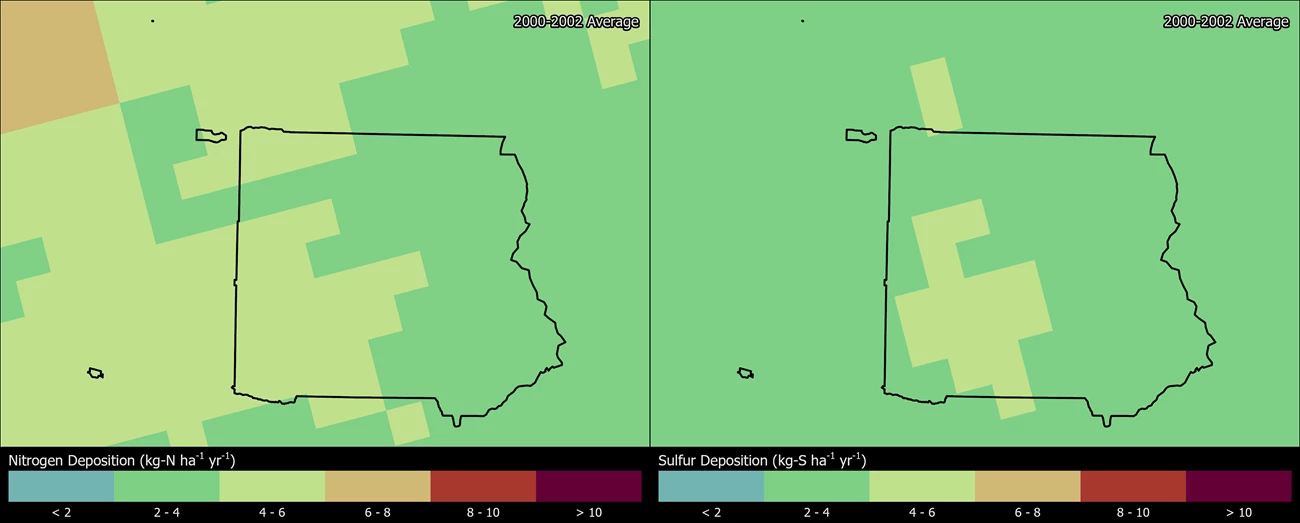
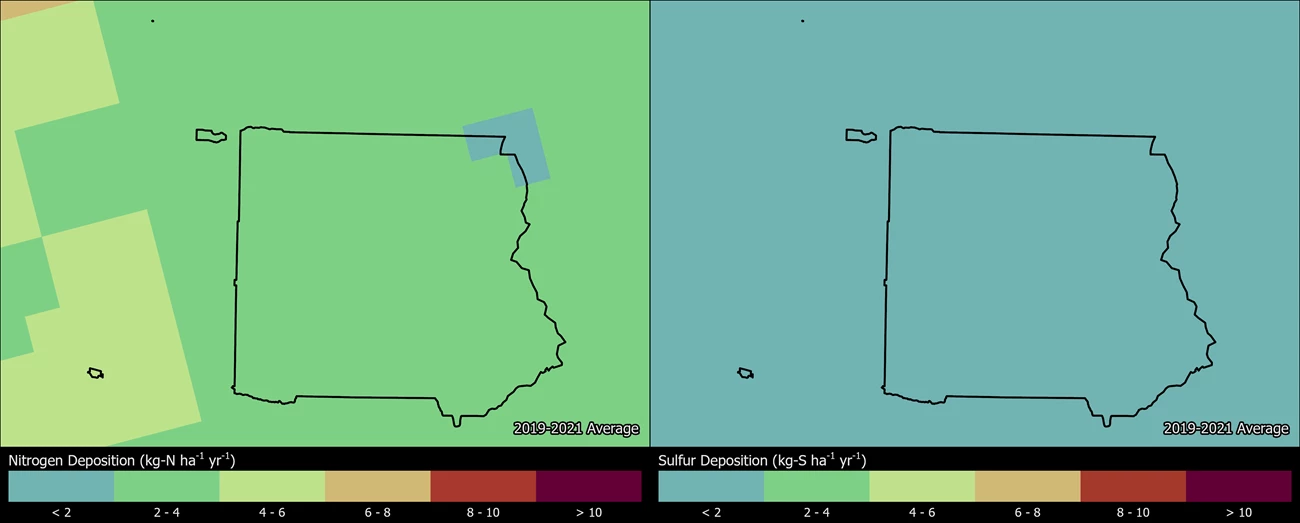
Change in N and S deposition from 2000 to 2021
The maps below show how the spatial distribution of estimated Total N and Total S deposition in MORA has changed from 2000-2002 to 2019-2021 (TDep MMF version 2022.02). Slide the arrows in the middle of the image up and down to compare N and S deposition between the two years (Yearly Data).
- Minimum N deposition decreased from 3.0 to 2.1 kg-N ha-1 yr-1 and maximum N deposition decreased from 4.9 to 3.7 kg-N ha-1 yr-1.
- Minimum S deposition decreased from 2.6 to 0.8 kg-S ha-1 yr-1 and maximum S deposition decreased from 4.9 to 1.9 kg-S ha-1 yr-1.
Persistent Pollutants
Pollutants like mercury and pesticides are concerning because they are persistent and toxic in the environment. These contaminants can travel in the air thousands of miles away from the source of pollution, even depositing in protected places like national parks. In addition, while some of these harmful pollutants may be banned from use, historically contaminated sites continue to endure negative environmental consequences.
When deposited, airborne mercury and other toxic air contaminants are known to harm wildlife like birds and fish, and cause human health concerns. Many of these substances enter the food chain and accumulate in the tissue of organisms causing reduced reproductive success, impaired growth and development, and decreased survival.
- Mercury concentrations in some fish sampled at Mount Rainier NP exceeded the toxicity thresholds for fish, birds, and/or human consumption. Fish (torrent sculpin and brook, rainbow, and cutthroat trout) were sampled and analyzed for mercury from 17 sites at the park and compared to data across 21 western parks. The average fish mercury concentration (71.5 ng/g ww) was slightly lower than the study-wide mean (77.7 ng/g ww). Mercury concentrations exceeded the thresholds for fish toxicity, bird toxicity, and US EPA’s human consumption guidance in 1%, 15%, and 2% of fish sampled, respectively (Eagles-Smith et al. 2014). However, the data may not reflect the risk at other unsampled locations in the park.
- Levels of dieldrin and/or p,p′-DDE in fish exceeded the human health threshold for subsistence fish consumption in some water bodies (Ackerman et al. 2008; Landers et al. 2010; Landers et al. 2008). Elevated mercury and toxic contaminant levels in fish are associated with tissue damage and changes in metabolic, endocrine, and immune-related genes (Moran et al. 2007; Schwindt et al. 2008). Fish consumption advisories may be in effect for mercury and other contaminants (NPS 2022).
- No fish sampled from the park were found to be intersex (Schreck and Kent 2013). Reproductive abnormalities such as intersex, the presence of both male and female reproductive structures in the same fish, can signify exposure to contaminants.
- Some dragonfly larvae sampled from the park had mercury concentrations at moderate or higher impairment levels. Dragonfly larvae have been sampled and analyzed for mercury from 21 sites in the park; 35% of the data fall into the moderate (100-300 ng/g dw) and 8% fall into the high (300-700 ng/g dw) impairment categories for potential mercury risk. An index of moderate impairment or higher suggests some fish may exceed the US EPA benchmark for protection of human health (Eagles-Smith et al. 2020; Eagles-Smith et al. 2018).
- Mercury was found in songbird blood samples from the park. Overall songbird blood mercury levels at Mount Rainier were on average lower than currently known effect levels (0.35 ppm), although some individuals (Varied Thrush) exceeded that threshold (Adams et al. 2013).
- Related studies also found mercury and other contaminants in park fish, snow, sediment, and vegetation. Contaminants include trace metals, current-use pesticides, historic-use pesticides, combustion byproducts, and industrial/urban use compounds (Flanagan Pritz et al. 2014; Frenzel et al. 1990; Hageman et al. 2006). Recent evidence suggests nearshore tree cover and fish diet account for the most variance in fish mercury at the park (Chiapella et al. 2021).
The NPS Air Resources Division reports on park conditions and trends for mercury. Visit the webpage to learn more.
Visibility

Many visitors come to Mount Rainier NP to enjoy stunning views of and from the fifth tallest peak in the contiguous 48 states, the highest in the chain of volcanoes comprising the Cascade Range. Park vistas are sometimes obscured by haze, reducing how well and how far people can see. Visibility reducing haze is caused by tiny particles in the air, and these particles can also affect human health. Many of the same pollutants that ultimately fall out as nitrogen and sulfur deposition contribute to this haze. Organic compounds, soot, and dust reduce visibility as well. Significant improvements in park visibility have been documented since the 1990’s. Still, visibility in the park needs improvement to reach the Clean Air Act goal of no human caused impairment.
Understanding how air pollution travels and where it comes from is essential to successfully targeting reductions. Learn about PREVENT, the Pacific Northwest Regional Visibility Experiment Using Natural Tracers special study. This 1990 study investigated the contribution of emission sources to fine particle concentrations and regional haze.
Visibility effects:
- Reduction of the average natural visual range from about 140 miles (without the effects of pollution) to about 110 miles because of pollution at the parks
- Reduction of the visual range from about 105 miles to below 55 miles on high pollution days
Visit the NPS air quality conditions and trends website for park-specific visibility information. Mount Rainier NP has been monitoring visibility since 2000. Check out the live air quality webcam and explore air monitoring »
Ground-Level Ozone

At ground level, ozone is harmful to human health and the environment. Ground-level ozone does not come directly from smokestacks or vehicles, but instead is formed when other pollutants, mainly nitrogen oxides and volatile organic compounds, react in the presence of sunlight. Ozone affecting Mount Rainier NP is transported primarily from the Puget Sound urban zone and via trans-Pacific air masses (Barna et al. 2000; Jaffe et al. 2003).
Over the course of a growing season, ozone can damage plant tissues making it harder for plants to produce and store food. It also weakens plants making them less resistant to disease and insect infestations. Some plants are more sensitive to ozone than others. While several ozone-sensitive plants, including Lonicera involucrata (bearberry honeysuckle) and Salix scouleriana (Scouler's willow), have been evaluated, no ozone injury has been documented in the park (Brace et al. 1999). A risk assessment concluded that plants in at Mount Rainier NP are at low risk for ozone damage (Kohut 2007; Kohut 2004). Search ozone-sensitive plant species found at Mount Rainier NP.
Visit the NPS air quality conditions and trends website for park-specific ozone information. Mount Rainier NP has been monitoring ozone since 1998. Check out the live ozone and meteorology data from Mount Rainier NP and explore air monitoring »
Explore Other Park Air Profiles
There are 47 other Park Air Profiles covering parks across the United States and its territories.
References
Ackerman, L. K., Schwindt, A. R., Massey Simonich S. L., Koch, D. C., Blett, T. F., Schreck, C. B., Kent, M. L., Landers, D. H. 2008. Atmospherically Deposited PBDEs, Pesticides, PCBs, and PAHs in Western U.S. National Park Fish: Concentrations and Consumption Guidelines. Environmental Science & Technology 42: 2334–2341. https://irma.nps.gov/DataStore/Reference/Profile/652640
Adams, E., A.K. Jackson and D.C. Evers. 2013. Songbirds: Indicators of mercury in national park ecosystems. Biodiversity Research Institute, Gorham, Maine. Science Communication Series BRI 2013-15. 4 pages. https://briwildlife.org/wp-content/uploads/2021/07/FINAL-Western-Parks-Report-062813.pdf
Barna, M., Lamb, B., O’Neill, S., Westberg, H., Figueroa-Kaminsky, C. Otterson, S., Bowman, C., and DeMay, J. 2000. Modeling Ozone Formation and Transport in the Cascadia Region of the Pacific Northwest. Journal of Applied Meteorology 39: 349–366.
Bowman W, Murgel J, Blett T, Porter E. 2012. Nitrogen critical loads for alpine vegetation and soils in Rocky Mountain National Park. Journal of Environmental Management. 103:165-171
Bowman WD, Gartner JR, Holland K, Wiedermann M. Nitrogen critical loads for alpine vegetation and terrestrial ecosystem response: are we there yet? Ecol Appl. 2006 Jun;16(3):1183-93. doi: 10.1890/1051-0761(2006)016[1183:nclfav]2.0.co;2. PMID: 16827011.
Brace, S., Peterson, D. L., and Bowers, D. 1999. A guide to ozone injury in vascular plants of the Pacific Northwest. Gen. Tech. Rep. PNW-GTR—446. Portland, OR: U.S. Department of Agriculture, Forest Service, Pacific Northwest Research Station. 63 pp.
Burri, K., C. Gromke, and F. Graf. "Mycorrhizal fungi protect the soil from wind erosion: a wind tunnel study." Land Degradation & Development 24.4 (2013): 385-392.
Cheng, Shen, et al. "Elucidating the mechanisms underlying enhanced drought tolerance in plants mediated by arbuscular mycorrhizal fungi." Frontiers in Microbiology 12 (2021): 809473.
Chiapella, A.M., Eagles-Smith, C.A. and Strecker, A.L. (2021), From forests to fish: Mercury in mountain lake food webs influenced by factors at multiple scales. Limnol Oceanogr, 66: 1021-1035. https://doi.org/10.1002/lno.11659
Clark, C.M., Simkin, S.M., Allen, E.B. et al. Potential vulnerability of 348 herbaceous species to atmospheric deposition of nitrogen and sulfur in the United States. Nat. Plants 5, 697–705 (2019). https://doi.org/10.1038/s41477-019-0442-8
Clow, D. W. and Campbell, D. H. 2008. Atmospheric deposition and surface-water chemistry in Mount Rainier and North Cascades National Parks, U.S.A., water years 2000 and 2005–2006: U.S. Geological Survey Scientific Investigations Report 2008–5152, 37 pp. Available at https://pubs.er.usgs.gov/publication/sir20085152
Eagles-Smith, C.A., J.J. Willacker, S.J. Nelson, C.M. Flanagan Pritz, D.P. Krabbenhoft, C.Y. Chen, J.T. Ackerman, E.H. Campbell Grant, and D.S. Pilliod. 2020. Dragonflies as biosentinels of mercury availability in aquatic food webs of national parks throughout the United States. Environmental Science and Technology 54(14):8779-8790. https://doi.org/10.1021/acs.est.0c01255
Eagles-Smith, C.A., S.J. Nelson., C.M. Flanagan Pritz, J.J. Willacker Jr., and A. Klemmer. 2018. Total Mercury Concentrations in Dragonfly Larvae from U.S. National Parks (ver. 6.0, June 2021): U.S. Geological Survey data release. https://doi.org/10.5066/P9TK6NPT
Eagles-Smith, C.A., J.J. Willacker, and C.M. Flanagan Pritz. 2014. Mercury in fishes from 21 national parks in the Western United States—Inter and intra-park variation in concentrations and ecological risk: U.S. Geological Survey Open-File Report 2014-1051, 54 p. Available at: http://dx.doi.org/10.3133/ofr20141051
Flanagan Pritz, C. M., J. E. Schrlau, S. L. Massey Simonich, T. F. Blett. 2014. Contaminants of Emerging Concern in Fish from Western U.S. and Alaskan National Parks – Spatial Distribution and Health Thresholds. Journal of American Water Resources Association 50 (2): 309–323. Available at https://irma.nps.gov/App/Reference/Profile/2210538.
Frenzel, R. W., Witmer, G. W. and Starkey, E. E. 1990. Heavy metal concentrations in a lichen of Mt. Rainier and Olympic National Parks, Washington, USA. Bulletin of Environmental Contamination and Toxicology 44 (1): 158–164. https://irma.nps.gov/DataStore/Reference/Profile/60167
Geiser, Linda & Nelson, Peter & Jovan, Sarah & Root, Heather & Clark, Christopher. (2019). Assessing Ecological Risks from Atmospheric Deposition of Nitrogen and Sulfur to US Forests Using Epiphytic Macrolichens. Diversity. 11. 87. 10.3390/d11060087.
Geiser, Linda & Root, Heather & Smith, Robert & Jovan, Sarah & Clair, Larry & Dillman, Karen. (2021). Lichen-based critical loads for deposition of nitrogen and sulfur in US forests. Environmental Pollution. 291. 118187. 10.1016/j.envpol.2021.118187.
George, Eckhard, Horst Marschner, and Iver Jakobsen. "Role of arbuscular mycorrhizal fungi in uptake of phosphorus and nitrogen from soil." Critical reviews in biotechnology 15.3-4 (1995): 257-270.
Hageman, K. J., Simonich, S. L., Campbell, D. H., Wilson, G. R., Landers, D. H. 2006. Atmospheric deposition of current-use and historic-use pesticides in snow at national parks in the Western United States. Environmental Science & Technology 40: 3174–3180. https://irma.nps.gov/DataStore/Reference/Profile/648369
Horn KJ, Thomas RQ, Clark CM, Pardo LH, Fenn ME, Lawrence GB, et al. (2018) Growth and survival relationships of 71 tree species with nitrogen and sulfur deposition across the conterminous U.S.. PLoS ONE 13(10): e0205296. https://doi.org/10.1371/journal.pone.0205296
Jaffe, D., McKendry, I., Anderson, T., Price, H. 2003. Six ‘new’ episodes of trans-Pacific transport of air pollutants. Atmos. Envir. 37: 391-404.
Kohut R.J. 2007. Ozone Risk Assessment for Vital Signs Monitoring Networks, Appalachian National Scenic Trail, and Natchez Trace National Scenic Trail. NPS/NRPC/ARD/NRTR—2007/001. National Park Service. Fort Collins, Colorado. Available at https://www.nps.gov/articles/ozone-risk-assessment.htm
Landers, D. H., S. L. Simonich, D. A. Jaffe, L. H. Geiser, D. H. Campbell, A. R. Schwindt, C. B. Schreck, M. L. Kent, W. D. Hafner, H. E. Taylor, K. J. Hageman, S. Usenko, L. K. Ackerman, J. E. Schrlau, N. L. Rose, T. F. Blett, and M. M. Erway. 2008. The Fate, Transport, and Ecological Impacts of Airborne Contaminants in Western National Parks (USA). EPA/600/R—07/138. U.S. Environmental Protection Agency, Office of Research and Development, NHEERL, Western Ecology Division, Corvallis, Oregon. Available at https://irma.nps.gov/DataStore/Reference/Profile/660829.
Landers, D. H., Simonich, S. M., Jaffe, D., Geiser, L., Campbell, D. H., Schwindt, A., Schreck, C., Kent, M., Hafner, W., Taylor, H. E., Hageman, K., Usenko, S., Ackerman, L., Schrlau, J., Rose, N., Blett, T., Erway, M. M. 2010. The Western Airborne Contaminant Assessment Project (WACAP): An Interdisciplinary Evaluation of the Impacts of Airborne Contaminants in Western U.S. National Parks. Environmental Science and Technology 44: 855–859. Available at https://pubs.acs.org/doi/10.1021/es901866e
Lilleskov, Erik A., et al. "Atmospheric nitrogen deposition impacts on the structure and function of forest mycorrhizal communities: a review." Environmental Pollution 246 (2019): 148-162.
McClung JJ, Bell MD, Felker-Quinn E. 2021. Extrapolating critical loads of nitrogen for alpine vegetation and assessing exceedance in national parks based on TDep Total N from 2002–2016. Natural Resource Report. NPS/NRSS/ARD/NRR—2021/2240. National Park Service. Fort Collins, Colorado. https://doi.org/10.36967/nrr-2284914
McCoy K., M. D. Bell, and E. Felker-Quinn. 2021. Risk to epiphytic lichen communities in NPS units from atmospheric nitrogen and sulfur pollution: Changes in critical load exceedances from 2001‒2016. Natural Resource Report NPS/NRSS/ARD/NRR—2021/2299. National Park Service, Fort Collins, Colorado. https://doi.org/10.36967/nrr-2287254.
Moran P. W., Aluru, N., Black, R. W., Vijayan, M. M. 2007. Tissue contaminants and associated transcriptional response in trout liver from high elevation lakes of Washington. Environ Sci Technol. 41(18): 6591–6597. https://irma.nps.gov/DataStore/Reference/Profile/660777
[NADP] National Atmospheric Deposition Program. 2018. NTN Data. Accessed January 20, 2022. Available at http://nadp.slh.wisc.edu/NADP/
Nanus L, Clow D, Saros J, Stephens V, Campbell D. 2012. Mapping Critical Loads of Nitrogen Deposition for Aquatic Ecosystems in the Rocky Mountains, USA.. Environmental Pollution. 166:125-135
[NPS] National Park Service. 2022. Fish Consumption Advisories. https://www.nps.gov/subjects/fishing/fish-consumption-advisories.htm
[NPS] National Park Service. 2010. Air Quality in National Parks: 2009 Annual Performance and Progress Report. Natural Resource Report NPS/NRPC/ARD/NRR—2010/266. National Park Service, Denver, Colorado. Available at https://irma.nps.gov/DataStore/Reference/Profile/2166247
Porter, E., Blett, T., Potter, D.U., Huber, C. 2005. Protecting resources on federal lands: Implications of critical loads for atmospheric deposition of nitrogen and sulfur. BioScience 55(7): 603–612. https://doi.org/10.1641/0006-3568(2005)055[0603:PROFLI]2.0.CO;2
Samora, B. A. and Clow, D. 2002. Episodic Acidification at Eunice Lake, Mount Rainier National Park, Washington. Internal Mount Rainier National Park Technical Report. Mount Rainier National Park. Ashford, Washington.
Schreck, C.B. and M. Kent. 2013. Extent of Endocrine Disruption in Fish of Western and Alaskan National Parks. NPS-OSU Task Agreement J8W07080024. NPS Final Report, 72 pp. https://irma.nps.gov/DataStore/DownloadFile/469831
Schwindt, A. R., Fournie, J. W., Landers, D. H., Schreck, C. B., Kent, M. 2008. Mercury Concentrations in Salmonids from Western U.S. National Parks and Relationships with Age and Macrophage Aggregates. Environmental Science & Technology 42 (4): 1365–1370. https://irma.nps.gov/DataStore/Reference/Profile/664114
Sullivan, T. J. 2016. Air quality related values (AQRVs) in national parks: Effects from ozone; visibility reducing particles; and atmospheric deposition of acids, nutrients and toxics. Natural Resource Report NPS/NRSS/ARD/NRR—2016/1196. National Park Service, Fort Collins, CO.
Williams MW, Baron JS, Caine N, Sommerfeld R, Sanford R. 1996. Nitrogen saturation in the Rocky Mountains. Environmental Science & Technology. 30(2):640-646
Last updated: July 23, 2024