Part of a series of articles titled Park Air Profiles.
Article
Park Air Profiles - Joshua Tree National Park
Air Quality at Joshua Tree National Park
Most visitors who come to national parks expect clean air and clear views. However, Joshua Tree National Park (NP), California, home to the famously twisted, spiky Joshua tree, is significantly affected by air pollution. Most of this pollution is generated in California’s Los Angeles basin and moves inland with the predominant westerly winds. Air pollutants blown into the park can harm natural and scenic resources such as soils, surface waters, plants, and visibility. The National Park Service works to address air pollution effects at Joshua Tree NP, and in parks across the U.S., through science, policy and planning, and by doing our part.
Nitrogen and Sulfur

Nitrogen (N) and sulfur (S) compounds deposited from the air may have harmful effects on ecosystem processes. Healthy ecosystems can naturally buffer a certain amount of pollution, but once a threshold is passed the ecosystem may respond negatively. This threshold is the critical load, or the amount of pollution above which harmful changes in sensitive ecosystems occur (Porter 2005). N and S deposition change ecosystems through eutrophication (N deposition) and acidification (N + S deposition). Eutrophication increases soil and water nutrients which causes some species to grow more quickly and changes community composition. Ecosystem sensitivity to nutrient N enrichment at Joshua Tree National Park (JOTR) relative to other national parks is very high (Sullivan et al. 2016); for a full list of N sensitive ecosystem components, see: NPS ARD 2019. Acidification leaches important cations from soils, lakes, ponds, and streams which decreases habitat quality. Ecosystem sensitivity to acidification at JOTR relative to other national parks is high (Sullivan et al. 2016); to search for acid-sensitive plant species, see: NPSpecies.
From 2017-2019 total N deposition in JOTR ranged from 2.7 to 5.3 kg-N ha-1 yr-1 and total S deposition ranged from 0.2 to 0.6 kg-S ha-1 yr-1 based on the TDep model (NADP, 2018). JOTR has been monitoring atmospheric N and S deposition since 2000, see the conditions and trends website for park-specific information.
Arid ecosystems have shown variable responses to excess N. Research in the park has found elevated soil nitrogen levels that are responsible for increased growth of invasive nitrogen-loving grasses. These grasses out-compete native plant species, leading to native plant species decline and reduced biodiversity. Additionally, the spread of weedy grasses that burn quickly increases fire risk (Allen et al. 2009; Rao et al. 2010).
Epiphytic macrolichen community responses
Epiphytic macrolichens grow on tree trunks, branches, and boles. Since these lichens grow above the ground, they obtain all their nutrients directly from precipitation and the air. Many epiphytic lichen species have narrow environmental niches and are extremely sensitive to changes in air pollution. Epiphytic lichen communities are less diverse in arid areas, but are still impacted by air pollution. Geiser et al. (2019) used a U.S. Forest Service national survey to develop critical loads of nitrogen (N) and critical loads of sulfur (S) to prevent more than a 20% decline in four lichen community metrics: total species richness, pollution sensitive species richness, forage lichen abundance, and cyanolichen abundance.
McCoy et al. (2021) used forested area from the National Land Cover Database to estimate the impact of air pollution on epiphytic lichen communities. Forested area makes up 3.2 km2 (0.1%) of the land area of Joshua Tree National Park.
- N deposition exceeded the 3.1 kg-N ha-1 yr-1 critical load to protect N-sensitive lichen species richness in 100% of the forested area.
- S deposition was below the 2.7 kg-S ha-1 yr-1 critical load to protect S-sensitive lichen species richness in every part of the forested area.
For exceedances of other lichen metrics and the predicted decline of lichen communities see Appendices A and B of McCoy et al. (2021).
Additional modeling was done on 459 lichen species to test the combined effects of air pollution and climate gradients (Geiser et al. 2021). A critical load indicative of initial shifts from pollution-sensitive toward pollution-tolerant species occurred at 1.5 kg-N ha-1 yr-1 and 2.7 kg-S ha-1 yr-1 even under changing climate regimes.
Plant species response
Plants vary in their tolerance of eutrophication and acidification, and some plant species respond to nitrogen (N) or sulfur (S) pollution with declines in growth, survival, or abundance on the landscape. Horn et al. (2018) used the U.S. Forest Service national forest survey to develop critical loads of N and critical loads of S to prevent declines in growth or survival of sensitive tree species. Clark et al. (2019) used a database of plant community surveys to develop critical loads of N and critical loads of S to prevent a decline in abundance of sensitive herbaceous plant species. According to NPSpecies, Joshua Tree National Park contains:
- 2 N-sensitive herbaceous species.
- 2 S-sensitive herbaceous species.
Mycccorrhizal community response
Many plants have a symbiotic relationship with mycorrhizal fungi (MF). Through the roots, the plants supply the fungi with carbon from photosynthesis and in exchange the MF enhance nutrient availability within soils, increase drought tolerance, and provide physical resistance to soil erosion (George et al., 1995; Cheng et al., 2021; Burri et al., 2013). Anthropogenic Nitrogen (N) deposition can disrupt this symbiotic relationship resulting in a shift from N sensitive to N tolerant mycorrhizal fungi and plant communities.
With increased N deposition to the soil, MF become less important for nutrient uptake and many plants will cease the exchange of nutrients altogether making them more vulnerable to stressors such as drought (Lilleskov et al., 2019). The CL-N for the shift in mycorrhizal community is 5-6 kg-N ha-1 yr-1 in coniferous forests and 10-20 kg-N ha-1 yr-1 broadleaf forests.
Joshua Tree National Park has 9.3 km2 of coniferous forests and 0.2 km2 of mixed forests. Using the range in critical loads above, the minimum CL is exceeded in 0% of forested area and the maximum CL is exceeded in 0% of forested area based on 2019-2021 TDep Total N deposition.
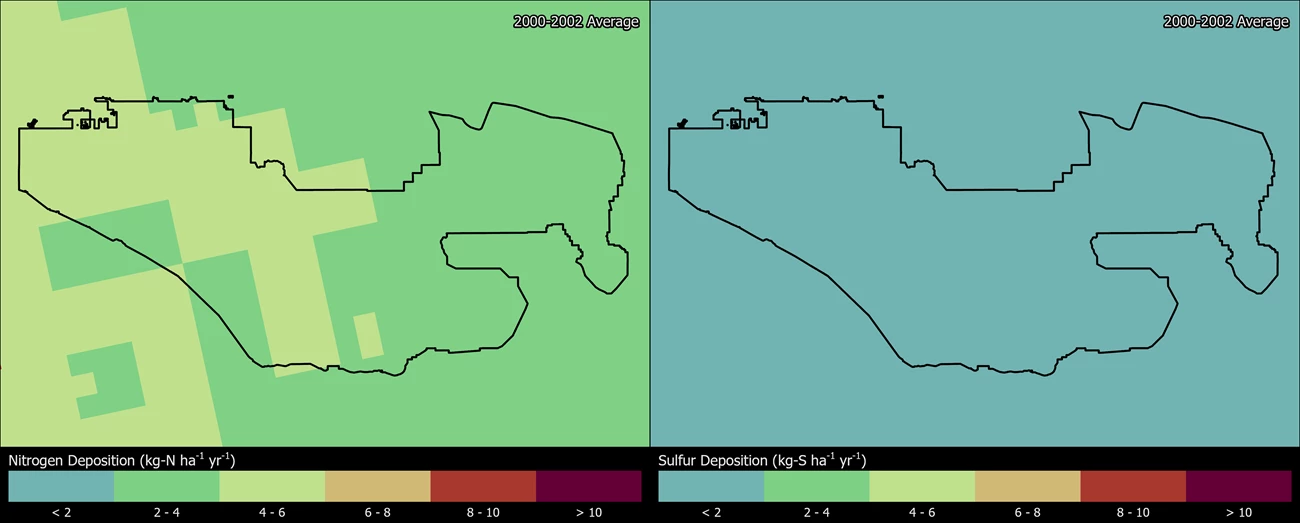
Change in N and S deposition from 2000 to 2021
The maps below show how the spatial distribution of estimated Total N and Total S deposition in JOTR has changed from 2000-2002 to 2019-2021 (TDep MMF version 2022.02). Slide the arrows in the middle of the image up and down to compare N and S deposition between the two years (Yearly Data).
- Minimum N deposition decreased from 2.3 to 1.3 kg-N ha-1 yr-1 and maximum N deposition decreased from 5.0 to 2.6 kg-N ha-1 yr-1.
- Minimum S deposition decreased from 0.3 to 0.2 kg-S ha-1 yr-1 and maximum S deposition decreased from 0.6 to 0.4 kg-S ha-1 yr-1.

Persistent Pollutants
Pollutants like mercury and pesticides are concerning because they are persistent and toxic in the environment. These contaminants can travel in the air thousands of miles away from the source of pollution, even depositing in protected places like national parks. In addition, while some of these harmful pollutants may be banned from use, historically contaminated sites continue to endure negative environmental consequences.
When deposited, airborne mercury and other toxic air contaminants are known to harm wildlife like birds and fish, and cause human health concerns. Many of these substances enter the food chain and accumulate in the tissue of organisms causing reduced reproductive success, impaired growth and development, and decreased survival.
- Dragonfly larvae sampled at Joshua Tree NP had mercury concentrations at moderate or high impairment levels. Dragonfly larvae have been sampled and analyzed for mercury from two sites in the park; 50% of the data fall into the high (300-700 ng/g dw) and 50% of the data fall into the moderate (100-300 ng/g dw) impairment categories for potential mercury risk. An index of moderate impairment or higher suggests some fish species may exceed the US EPA benchmark for protection of human health (Eagles-Smith et al. 2018; Eagles-Smith et al. 2020). However, the data may not reflect the risk at other unsampled locations in the park. Fish consumption advisories may be in effect for mercury and other contaminants (NPS 2022).
- Microplastics were found in park precipitation samples. These microplastics, thought to be distributed by atmospheric transport, consisted of mostly clothing fibers like cotton, polyester, and nylon. Joshua Tree NP is estimated to have an annual deposition rate of 3.4-3.7 metric tons of plastic per year (Brahney et al. 2020).
- Pesticides toxic to fish and bees and most likely to drift into park boundaries due to application in the counties surrounding Joshua Tree NP are the fumigant Metam-Sodium, and insecticides and herbicides like Chlorpyrifos and Diuron (Meyer and DeMars 2018).
The NPS Air Resources Division reports on park conditions and trends for mercury. Visit the webpage to learn more.
Visibility

Many visitors come to Joshua Tree NP to enjoy the spectacular vistas, including that of the Mexican border from the mile-high vantage point of Keys View. Unfortunately, park vistas are often obscured by haze, reducing how well and how far people can see. Visibility reducing haze is caused by tiny particles in the air, and these particles can also affect human health. Many of the same pollutants that ultimately fall out as nitrogen and sulfur deposition contribute to this haze. Organic compounds, soot, dust, and wood smoke reduce visibility as well.
Visibility effects:
- Reduced visibility on many days due to haze
- Reduction of the average natural visual range from about 160 miles (without the effects of pollution) to about 100 miles because of pollution at the park
- Reduction of the visual range from about 120 miles to below 55 miles on high pollution days
Visit the NPS air quality conditions and trends website for park-specific visibility information. Joshua Tree NP has been monitoring visibility since 2000. Check out the live air quality webcam and explore air monitoring »
Ground-Level ozone

At ground level, ozone is harmful to human health and the environment. Ground-level ozone does not come directly from smokestacks or vehicles, but instead is formed when other pollutants, mainly nitrogen oxides and volatile organic compounds, react in the presence of sunlight. Joshua Tree NP experiences high ozone concentrations, with peak levels and cumulative doses that are some of the highest in the NPS.
Especially during the summer months, ozone levels in the park frequently exceed the National Ambient Air Quality Standards set by the U.S. Environmental Protection Agency to protect public health. Between 2013 and 2022, ozone levels in the park exceeded EPA standards on more than 30 days each year (ARD Conditions and Trends). Ozone is a respiratory irritant, causing coughing, sinus inflammation, chest pains, scratchy throat, lung damage, and reduced immune system functions. Children, the elderly, people with existing health problems, and active adults are most vulnerable. When ozone levels exceed, or are predicted to exceed, health standards, Joshua Tree NP staff post health advisories cautioning visitors of the potential health risks associated with exposures to elevated levels.
Over the course of a growing season, ozone can damage plant tissues making it harder for plants to produce and store food. Ozone causes leaf injuries like bleaching or dark spots on some sensitive plants. While the generally dry conditions in the park are likely to limit ozone uptake by plants, a wet year or strong summer monsoon season increases the risk of ozone leaf injury. Studies in the 1980s tested the effects of ozone upon Mojave Desert plants:
-
Two experiments tested the effects of elevated ozone on herbaceous annual and perennial plants common in the Mojave Desert (Thompson et al. 1984, Bytnerowicz et al. 1988). High levels of ozone fumigation caused leaf injury, with symptoms of flecking or necrotic leaf patches which were white, brown, or brownish-red on the following plants:
-
In the evening primrose family, clavatefruit suncup (Chylismia claviformis ssp. claviformis) and Santa Cruz Island suncup (Camissoniopsis hirtella),
-
In the borage family, chuckwalla combseed (Pectocarya heterocarpa), broadnut combseed, (Pectocarya platycarpa), and Nevada catseye (Cryptantha nevadensis),
-
On other sensitive wildflowers: desert poppy (Eschscholzia parishii), smooth desert dandelion (Malacothrix glabrata), and whitestem blazingstar (Mentzelia albicaulis).
-
Surveys conducted in 1984 and 1985 found no ozone leaf injury symptoms in permanent vegetation monitoring plots in the park, but injury was reported to the park in 1987 and 1988 (Temple 1989).
-
An experiment tested the effects of elevated ozone on native summer annual and woody perennial species. High levels of ozone caused ozone injury on skunkbush sumac (Rhus trilobata), which the researchers recommended be used as a biosentinel: ozone injury symptoms on skunkbush sumac would indicate that vegetation across the park is taking up high doses of ozone (Temple 1989).
There are 3 additional plants that may display ozone injury at Joshua Tree National Park. Although ozone levels in Joshua Tree NP have improved over the last 30 years of monitoring, they remain sufficiently high in Joshua Tree NP to damage plant leaves, and possibly reduce plant growth, under certain conditions (Sullivan et al. 2001). Search ozone-sensitive plant species found at Joshua Tree NP.
Ozone can slow growth and accelerate senescence of sensitive plants. Ozone critical levels have been established to protect non-woody plants that grow in European meadows and grasslands (Van Goethem et al. 2013). Twenty herb species with ozone critical levels grow in California. A county-level assessment predicted that three herb species in San Bernardino and Riverside counties lost more than 10% biomass annually due to ground-level ozone pollution (Kaylor et al. 2023). Ozone effects on sensitive herbs in the counties that contain Joshua Tree National Park exceed European recommendations to cap growth deficits at 10% annual losses.
Visit the NPS air quality conditions and trends website for park-specific ozone information. Joshua Tree NP has been monitoring ozone since 1993. Check out the live ozone and meteorology data for Joshua Tree National Park.
Explore Other Park Air Profiles
There are 47 other Park Air Profiles covering parks across the United States and its territories.
References
Allen, E. B., Rao, L. E., Steers, R. J., Bytnerowicz, A., and Fenn, M. E. 2009. Impacts of atmospheric nitrogen deposition on vegetation and soils in Joshua Tree National Park. Pages 78–100 in R. H. Webb, L. F. Fenstermaker, J. S. Heaton, D. L. Hughson, E. V. McDonald, and D. M. Miller, eds. The Mojave Desert: Ecosystem Processes and Sustainability. University of Nevada Press, Las Vegas.
Brahney, J., M. Hallerud, E. Heim, M. Hahnenberger, and S. Sukumaran. 2020. Plastic rain in protected areas of the United States. Science 368(6496): 1257-1260. https://www.science.org/doi/10.1126/science.aaz5819
Burri, K., C. Gromke, and F. Graf. "Mycorrhizal fungi protect the soil from wind erosion: a wind tunnel study." Land Degradation & Development 24.4 (2013): 385-392.
Bytnerowicz A, Olszyk DM, Fox CA, Dawson PJ, Kats G, Morrison CL, Wolf J. 1988. Responses of desert annual plants to ozone and water stress in an in situ experiment. J. Air Pollut. Control Assoc. 38:1145-1151.
Cheng, Shen, et al. "Elucidating the mechanisms underlying enhanced drought tolerance in plants mediated by arbuscular mycorrhizal fungi." Frontiers in Microbiology 12 (2021): 809473.
Clark, C.M., Simkin, S.M., Allen, E.B. et al. Potential vulnerability of 348 herbaceous species to atmospheric deposition of nitrogen and sulfur in the United States. Nat. Plants 5, 697–705 (2019). https://doi.org/10.1038/s41477-019-0442-8
Eagles-Smith, C.A., S.J. Nelson., C.M. Flanagan Pritz, J.J. Willacker Jr., and A. Klemmer. 2018. Total Mercury Concentrations in Dragonfly Larvae from U.S. National Parks (ver. 6.0, June 2021): U.S. Geological Survey data release. https://doi.org/10.5066/P9TK6NPT
Eagles-Smith, C.A., J.J. Willacker, S.J. Nelson, C.M. Flanagan Pritz, D.P. Krabbenhoft, C.Y. Chen, J.T. Ackerman, E.H. Campbell Grant, and D.S. Pilliod. 2020. Dragonflies as biosentinels of mercury availability in aquatic food webs of national parks throughout the United States. Environmental Science and Technology 54(14):8779-8790. https://doi.org/10.1021/acs.est.0c01255
Fenn, M. E., Haeuber, G. S., Tonnesen, J. S., Baron, J. S., Grossman-Clarke, S., Hope, D., Jaffe, D. A., Copeland, S., Geiser, L., Rueth, H. M., and Sickman, J. O. 2003. Nitrogen emissions, deposition and monitoring in the western United States. Bioscience 53: 391–403.
Geiser, Linda & Nelson, Peter & Jovan, Sarah & Root, Heather & Clark, Christopher. (2019). Assessing Ecological Risks from Atmospheric Deposition of Nitrogen and Sulfur to US Forests Using Epiphytic Macrolichens. Diversity. 11. 87. 10.3390/d11060087.
Geiser, Linda & Root, Heather & Smith, Robert & Jovan, Sarah & Clair, Larry & Dillman, Karen. (2021). Lichen-based critical loads for deposition of nitrogen and sulfur in US forests. Environmental Pollution. 291. 118187. 10.1016/j.envpol.2021.118187.
George, Eckhard, Horst Marschner, and Iver Jakobsen. "Role of arbuscular mycorrhizal fungi in uptake of phosphorus and nitrogen from soil." Critical reviews in biotechnology 15.3-4 (1995): 257-270.
Horn KJ, Thomas RQ, Clark CM, Pardo LH, Fenn ME, Lawrence GB, et al. (2018) Growth and survival relationships of 71 tree species with nitrogen and sulfur deposition across the conterminous U.S.. PLoS ONE 13(10): e0205296. https://doi.org/10.1371/journal.pone.0205296
Kaylor SD, Snell Taylor SJ, Herrick JD. 2023. Estimates of biomass reductions of ozone sensitive herbaceous plants in California. Sci Total Environ. 2023 Jun 20;878:163134. https://doi.org/10.1016/j.scitotenv.2023.163134
Lilleskov, Erik A., et al. "Atmospheric nitrogen deposition impacts on the structure and function of forest mycorrhizal communities: a review." Environmental Pollution 246 (2019): 148-162.
McCoy K., M. D. Bell, and E. Felker-Quinn. 2021. Risk to epiphytic lichen communities in NPS units from atmospheric nitrogen and sulfur pollution: Changes in critical load exceedances from 2001‒2016. Natural Resource Report NPS/NRSS/ARD/NRR—2021/2299. National Park Service, Fort Collins, Colorado. https://doi.org/10.36967/nrr-2287254.
Meyer, Erik and Christopher DeMars. 2018. A Simplified Approach to Using Pesticide Use Reporting To Prioritize Pesticide Risk in California’s National Parks. https://doi.org/10.1021/bk-2018-1283.ch018
[NADP] National Atmospheric Deposition Program. 2018. NTN Data. Accessed January 20, 2022. Available at http://nadp.slh.wisc.edu/NADP/
[NPS] National Park Service. 2022. Fish Consumption Advisories. https://www.nps.gov/subjects/fishing/fish-consumption-advisories.htm
Porter, E., Blett, T., Potter, D.U., Huber, C. 2005. Protecting resources on federal lands: Implications of critical loads for atmospheric deposition of nitrogen and sulfur. BioScience 55(7): 603–612. https://doi.org/10.1641/0006-3568(2005)055[0603:PROFLI]2.0.CO;2
Rao L. E., Allen E. B., Meixner T. 2010. Risk-based determination of critical nitrogen deposition loads for fire spread in southern California deserts. Ecological Applications 20 (5): 1320–1335.
Sullivan TJ, Peterson DL, Blanchard CL, Tanenbaum SJ. 2001. Assessment of Air Quality and Air Pollutant Impacts in Class I National Parks of California. NPS D-1454. Air Resources Division, National Park Service. Denver, Colorado. https://irma.nps.gov/DataStore/Reference/Profile/561620
Sullivan TJ. 2016. Air quality related values (AQRVs) for Mojave Desert Network (MOJN) parks: Effects from ozone; visibility reducing particles; and atmospheric deposition of acids, nutrients and toxics. Natural Resource Report. NPS/MOJN/NRR—2016/1170. National Park Service. Fort Collins, Colorado. https://irma.nps.gov/DataStore/Reference/Profile/2228010
Sullivan T.J. 2016. Air quality related values (AQRVs) in national parks: Effects from ozone; visibility reducing particles; and atmospheric deposition of acids, nutrients and toxics. Natural Resource Report. NPS/NRSS/ARD/NRR—2016/1196. National Park Service. Fort Collins, Colorado. Available at https://www.nps.gov/articles/aqrv-assessment.htm
Temple PJ. 1989. Oxidant air pollution effects on plants of Joshua Tree National Monument. Environmental Pollution. 57(1):35–47. https://irma.nps.gov/DataStore/Reference/Profile/88874
Van Goethem TMWJ, Azevedo LB, van Zelm R, Hayes F, Ashmore MR, Huijbregts MAJ. 2013. Plant species sensitivity distributions for ozone exposure. Environmental Pollution 178:1-6. https://doi.org/10.1016/j.envpol.2013.02.023
Last updated: November 18, 2024