Part of a series of articles titled Park Air Profiles.
Article
Park Air Profiles - Grand Teton National Park
Air Quality at Grand Teton National Park
Most visitors expect clean air and clear views in parks. Grand Teton National Park (NP), Wyoming, is home to extraordinary wildlife, beautiful mountain lakes, and the dramatic alpine terrain of the Teton Range. The park has generally good air quality but is affected by air pollution from power plants, agricultural areas, industry, and oil and gas development. Pollutants emitted from these sources can harm the park’s natural and scenic resources such as surface waters, vegetation, fish, and visibility. The National Park Service works to address air pollution effects at Grand Teton NP, and in parks across the U.S., through science, policy and planning, and by doing our part.
Nitrogen and Sulfur

Nitrogen (N) and sulfur (S) compounds deposited from the air may have harmful effects on ecosystem processes. Healthy ecosystems can naturally buffer a certain amount of pollution, but once a threshold is passed the ecosystem may respond negatively. This threshold is the critical load, or the amount of pollution above which harmful changes in sensitive ecosystems occur (Porter 2005). N and S deposition change ecosystems through eutrophication (N deposition) and acidification (N + S deposition). Eutrophication increases soil and water nutrients which causes some species to grow more quickly and changes community composition. Ecosystem sensitivity to nutrient N enrichment at Grand Teton National Park (GRTE) relative to other national parks is very high (Sullivan et al. 2016); for a full list of N sensitive ecosystem components, see: NPS ARD 2019. Acidification leaches important cations from soils, lakes, ponds, and streams which decreases habitat quality. Ecosystem sensitivity to acidification at GRTE relative to other national parks is very high (Sullivan et al. 2016); to search for acid-sensitive plant species, see: NPSpecies.
From 2017-2019 total N deposition in GRTE ranged from 3.4 to 7.2 kg-N ha-1 yr-1 and total S deposition ranged from 0.9 to 2.0 kg-S ha-1 yr-1 based on the TDep model (NADP, 2018). GRTE has been monitoring atmospheric N and S deposition since 2011, see the conditions and trends website for park-specific information.
Alpine ecosystem effects
Alpine environments are particularly vulnerable to large inputs of reactive nitrogen because of the sparse cover of vegetation, short growing seasons, large areas of exposed bedrock and talus, and snowmelt nutrient releases (Williams et al., 1996; Nanus et al., 2012). Approximately 17% of the land area in GRTE is alpine (~328 km2 above 1550 m). McClung et al. (2020) compared the 2015 estimated total N deposition (TDep; NADP, 2018) to the critical load of N for an increase in alpine sedge growth (alpine plant critical load = 3 kg-N ha-1 yr-1) and the critical load of N for alpine soil nitrate leaching (alpine soil critical load = 10 kg-N ha-1 yr-1; Bowman et al., 2012). They found that deposition exceeded the alpine plant critical load in 100% of the park’s alpine area, but was below the alpine soil critical load throughout the park’s entire alpine area.
Epiphytic macrolichen community responses
Epiphytic macrolichens grow on tree trunks, branches, and boles. Since these lichens grow above the ground, they obtain all their nutrients directly from precipitation and the air. Many epiphytic lichen species have narrow environmental niches and are extremely sensitive to changes in air pollution. Geiser et al. (2019) used a U.S. Forest Service national survey to develop critical loads of nitrogen (N) and critical loads of sulfur (S) to prevent more than a 20% decline in four lichen community metrics: total species richness, pollution sensitive species richness, forage lichen abundance, and cyanolichen abundance.
McCoy et al. (2021) used forested area from the National Land Cover Database to estimate the impact of air pollution on epiphytic lichen communities. Forested area makes up 399 km2 (31.8%) of the land area of Grand Teton National Park.
- N deposition exceeded the 3.1 kg-N ha-1 yr-1 critical load to protect N-sensitive lichen species richness in every part of the forested area.
- S deposition exceeded the 2.7 kg-S ha-1 yr-1 critical load to protect S-sensitive lichen species richness in 71.5% of the forested area.
For exceedances of other lichen metrics and the predicted decline of lichen communities see Appendices A and B of McCoy et al. (2021).
Additional modeling was done on 459 lichen species to test the combined effects of air pollution and climate gradients (Geiser et al. 2021). A critical load indicative of initial shifts from pollution-sensitive toward pollution-tolerant species occurred at 1.5 kg-N ha-1 yr-1 and 2.7 kg-S ha-1 yr-1 even under changing climate regimes.
Plant species response
Plants vary in their tolerance of eutrophication and acidification, and some plant species respond to nitrogen (N) or sulfur (S) pollution with declines in growth, survival, or abundance on the landscape. Horn et al. (2018) used the U.S. Forest Service national forest survey to develop critical loads of N and critical loads of S to prevent declines in growth or survival of sensitive tree species. Clark et al. (2019) used a database of plant community surveys to develop critical loads of N and critical loads of S to prevent a decline in abundance of sensitive herbaceous plant species. According to NPSpecies, Grand Teton National Park contains:
- 4 N-sensitive tree species and 36 N-sensitive herbaceous species.
- 5 S-sensitive tree species and 33 S-sensitive herbaceous species.
Mycorrhizal fungi community response
Many plants have a symbiotic relationship with mycorrhizal fungi (MF). Through the roots, the plants supply the fungi with carbon from photosynthesis and in exchange the MF enhance nutrient availability within soils, increase drought tolerance, and provide physical resistance to soil erosion (George et al., 1995; Cheng et al., 2021; Burri et al., 2013). Anthropogenic Nitrogen (N) deposition can disrupt this symbiotic relationship resulting in a shift from N sensitive to N tolerant mycorrhizal fungi and plant communities.
With increased N deposition to the soil, MF become less important for nutrient uptake and many plants will cease the exchange of nutrients altogether making them more vulnerable to stressors such as drought (Lilleskov et al., 2019). The CL-N for the shift in mycorrhizal community is 5-6 kg-N ha-1 yr-1 in coniferous forests and 10-20 kg-N ha-1 yr-1 broadleaf forests.
Grand Teton National Park has 571.3 km2 of coniferous forests, 3.5 km2 of broadleaf forests, and 0.5 km2 of mixed forests. Using the range in critical loads above, the minimum CL is exceeded in 15.3% of forested area and the maximum CL is exceeded in 4.8% of forested area based on 2019-2021 TDep Total N deposition.
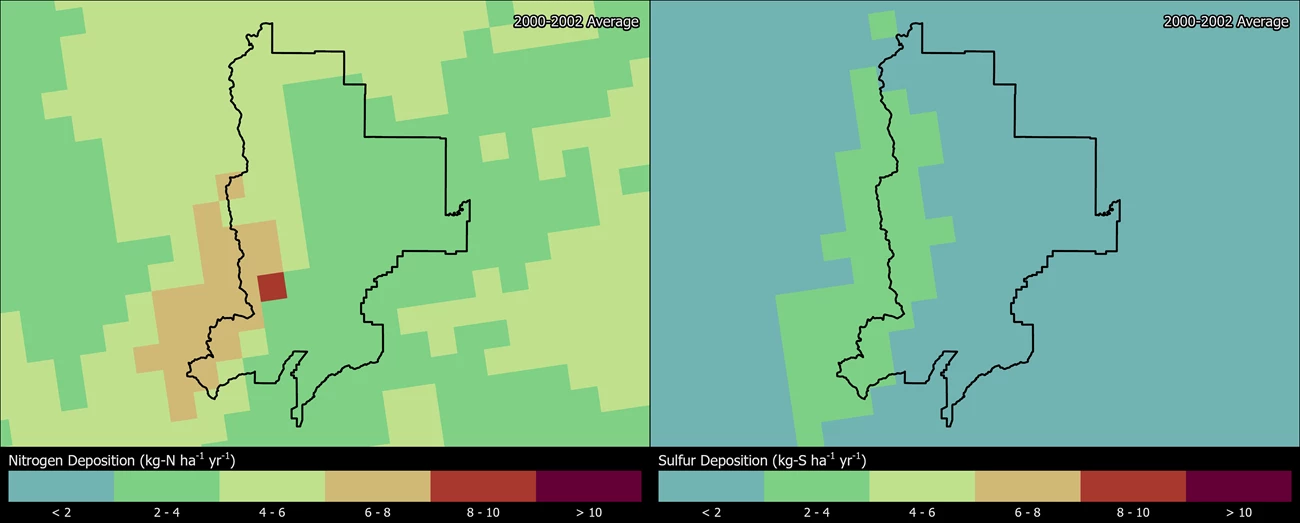
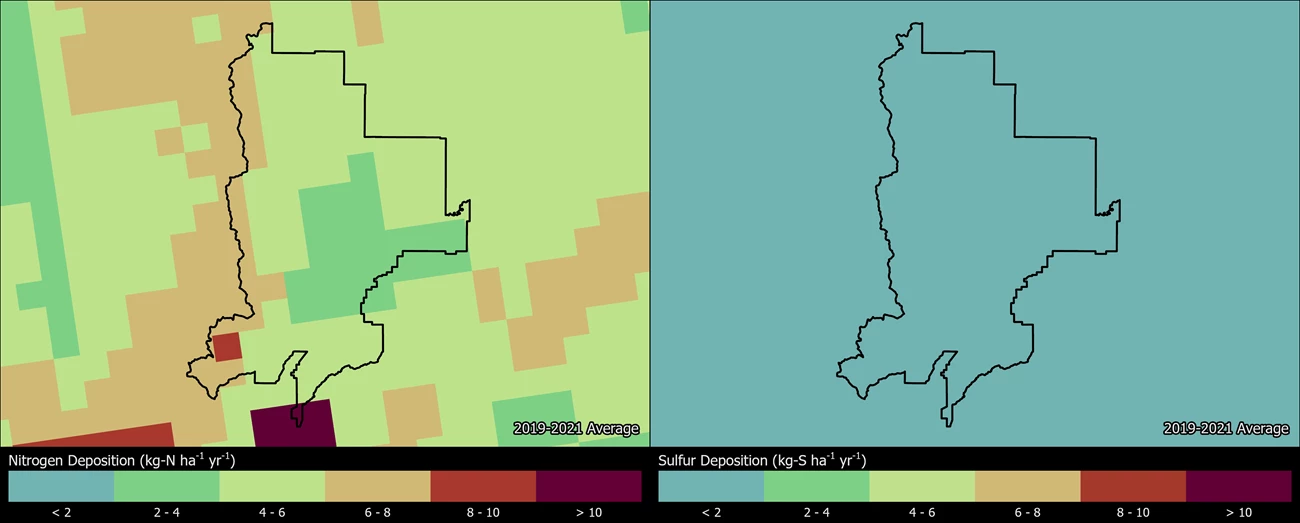
Change in N and S deposition from 2000 to 2021
The maps below show how the spatial distribution of estimated Total N and Total S deposition in GRTE has changed from 2000-2002 to 2019-2021 (TDep MMF version 2022.02). Slide the arrows in the middle of the image up and down to compare N and S deposition between the two years (Yearly Data).
- Minimum N deposition increased from 2.4 to 3.4 kg-N ha-1 yr-1 and maximum N deposition decreased from 8.2 to 8.0 kg-N ha-1 yr-1.
- Minimum S deposition decreased from 0.9 to 0.7 kg-S ha-1 yr-1 and maximum S deposition decreased from 3.5 to 1.5 kg-S ha-1 yr-1.
Persistent Pollutants
Pollutants like mercury and pesticides are concerning because they are persistent and toxic in the environment. These contaminants can travel in the air thousands of miles away from the source of pollution, even depositing in protected places like national parks. In addition, while some of these harmful pollutants may be banned from use, historically contaminated sites continue to endure negative environmental consequences.
When deposited, airborne mercury and other toxic air contaminants are known to harm wildlife like birds and fish, and cause human health concerns. Many of these substances enter the food chain and accumulate in the tissue of organisms causing reduced reproductive success, impaired growth and development, and decreased survival.
- Mercury concentrations in fish sampled at Grand Teton NP did not exceed any thresholds for fish toxicity, bird toxicity, or US EPA’s human consumption guidance. Fish were analyzed for mercury from three sites at the park and compared to data across 21 western parks. The average fish mercury concentration (32.6 ng/g ww) was lower than the study-wide mean (77.7 ng/g ww). However, the data may not reflect the risk at other unsampled locations in the park (Eagles-Smith et al. 2014).
- No fish sampled from the park were found to be intersex (Schreck and Kent 2013). Reproductive abnormalities such as intersex, the presence of both male and female reproductive structures in the same fish, can signify exposure to contaminants. Fish consumption advisories may be in effect for mercury and other contaminants (NPS 2022).
- Some dragonfly larvae sampled at Grand Teton NP had mercury concentrations at high impairment levels. Dragonfly larvae have been sampled and analyzed for mercury from three sites in the park; 33% of the data fall into the high (300-700 ng/g dw) impairment categories for potential mercury risk. An index of moderate impairment or higher suggests some fish species may exceed the US EPA benchmark for protection of human health (Eagles-Smith et al. 2020; Eagles-Smith et al. 2018).
- Mercury has been found in songbird blood samples from the park. No samples from Grand Teton NP had blood mercury levels that exceeded the currently known effect levels (0.35 ppm) in songbirds (Adams et al. 2013).
- Other studies also found mercury and other contaminants in park air, water, snow, and vegetation. In 2021, the average mercury concentration found in snowpack was 1.71 ng/L at Garnet Canyon, 1.71 ng/L at Rendezvous Mountain, and 10.1 ng/L at Teton Pass (Ingersoll et al. 2007; USGS 2021). Pesticides and other contaminants were found in high-elevation lakes at Grand Teton, but concentrations did not exceed any known benchmarks for aquatic life (Keteles 2011; Krabbenhoft et al. 2002). Other related studies found that concentrations of current-use pesticides in air and vegetation samples were elevated compared to other western national parks (Landers et al. 2010; Landers et al. 2008).
The NPS Air Resources Division reports on park conditions and trends for mercury. Visit the webpage to learn more.
Visibility

Visitors come to Grand Teton NP to enjoy spectacular views of the windswept peaks of the Teton Range, mountain lakes, and the Jackson Hole valley floor. Park vistas are sometimes obscured by haze, reducing how well and how far people can see. Visibility reducing haze is caused by tiny particles in the air, and these particles can also affect human health. Many of the same pollutants that ultimately fall out as nitrogen and sulfur deposition contribute to this haze. Organic compounds, soot, and dust reduce visibility as well. Significant improvements in visibility on clearest days have been documented since the late 1980’s. However, no significant trends have occurred on haziest days and regional visibility still needs improvement to reach the Clean Air Act goal of no human caused impairment.
In the region, average natural visual range is reduced from about 180 miles (without the effects of pollution) to about 140 miles because of pollution. The visual range is reduced to below 75 miles on high pollution days.
Check out the live air quality webcam and visit the NPS air quality conditions and trends website for park-specific visibility information. The NPS has been monitoring visibility at Yellowstone NP, Wyoming since 1988, these data are considered representative of regional visibility conditions for Grand Teton NP.
Ground-Level Ozone

At ground level, ozone is harmful to human health and the environment. Ground-level ozone does not come directly from smokestacks or vehicles, but instead is formed when other pollutants, mainly nitrogen oxides and volatile organic compounds, react in the presence of sunlight. Ozone levels in Grand Teton National Park are influenced by regional and local emissions (Nanus et al. 2022).
Over the course of a growing season, ozone can damage plant tissues making it harder for plants to grow and store carbon. Ozone causes leaf injuries like bleaching or dark spots on some sensitive plants. There are eight plants that may display ozone leaf injury at Grand Teton National Park. Search ozone-sensitive plant species found at Grand Teton National Park.
US Environmental Protection Agency and NPS found in ozone exposure experiments that ozone slowed tree seedling growth. NPS uses W126 values from averaged seedling responses in those experiments to describe park condition in terms of Vegetation Health. Ozone affects actively growing plants, so the W126 metric weights a sum of ozone concentrations during daylight hours over three months in the growing season. A recent study modeled plant ozone uptake and found that it has remained relatively steady in Grand Teton National Park since ozone measurements began in 2011 (Mao et al 2024).
A recent re-analysis of the seedling experiments established critical levels of ozone protective of each tree species tested (Lee et al. 2022). The ozone critical levels are W126 values that will prevent 5% or greater deficit in tree seedling biomass. Air Quality Conditions and Trends reports a 5-year average of W126 for each park. In 2018-2022, the average W126 value for Grand Teton National Park was 6 ppm-h. Based on this ozone level, trees present in the park (NPSpecies) are at low risk of the following ozone effects:
-
Tree species Douglas-fir (Psuedotsuga menziesii) and quaking aspen (Populus tremuloides) are at low risk from ozone despite their known sensitivity. Recent ozone levels in the park are below critical levels that protect these trees from 5% biomass deficit.
Ozone critical levels are for tree seedlings, which represent the regenerative capacity and long-term stability of sensitive species within a forest. These tree species are also known to be sensitive to ozone as adults (Bell et al. 2020), but critical values for seedling growth do not predict ozone effects on mature trees. Air Resources Division is currently working with collaborators to establish critical levels for mature trees using data from forest monitoring plots.
Visit the NPS air quality conditions and trends website for park-specific ozone information. Grand Teton National Park has been monitoring ozone levels since 2011. View live ozone and meteorology data.
Explore Other Park Air Profiles
There are 47 other Park Air Profiles covering parks across the United States and its territories.
References
Bell MD, Felker-Quinn E, Kohut R. 2020. Ozone sensitive plant species on National Park Service lands. Natural Resource Report. NPS/WASO/NRR—2020/2062. National Park Service. Fort Collins, Colorado. https://irma.nps.gov/DataStore/Reference/Profile/2271702
Bowman W, Murgel J, Blett T, Porter E. 2012. Nitrogen critical loads for alpine vegetation and soils in Rocky Mountain National Park. Journal of Environmental Management. 103:165-171
Burri, K., C. Gromke, and F. Graf. "Mycorrhizal fungi protect the soil from wind erosion: a wind tunnel study." Land Degradation & Development 24.4 (2013): 385-392.
Cheng, Shen, et al. "Elucidating the mechanisms underlying enhanced drought tolerance in plants mediated by arbuscular mycorrhizal fungi." Frontiers in Microbiology 12 (2021): 809473.
Clark, C.M., Simkin, S.M., Allen, E.B. et al. Potential vulnerability of 348 herbaceous species to atmospheric deposition of nitrogen and sulfur in the United States. Nat. Plants 5, 697–705 (2019). https://doi.org/10.1038/s41477-019-0442-8
Clow, D. W., Sickman, J. O., Striegl, R. G., Krabbenhoft, D. P., Elliott, J. G., Dornblaser, M., Roth, D.A., and Campbell, D. H. 2003. Changes in the chemistry of lakes and precipitation in high-elevation national parks in the western United States, 1985–1999. Water Resour. Res. 39(6): 1171.
Eagles-Smith, C.A., J.J. Willacker, and C.M.Flanagan Pritz. 2014. Mercury in fishes from 21 national parks in the Western United States—Inter and intra-park variation in concentrations and ecological risk: U.S. Geological Survey Open-File Report 2014-1051, 54 p. Available at: http://dx.doi.org/10.3133/ofr20141051
Eagles-Smith, C.A., J.J. Willacker, S.J. Nelson, C.M. Flanagan Pritz, D.P. Krabbenhoft, C.Y. Chen, J.T. Ackerman, E.H. Campbell Grant, and D.S. Pilliod. 2020. Dragonflies as biosentinels of mercury availability in aquatic food webs of national parks throughout the United States. Environmental Science and Technology 54(14):8779-8790. https://doi.org/10.1021/acs.est.0c01255
Eagles-Smith, C.A., S.J. Nelson., C.M. Flanagan Pritz, J.J. Willacker Jr., and A. Klemmer. 2018. Total Mercury Concentrations in Dragonfly Larvae from U.S. National Parks (ver. 6.0, June 2021): U.S. Geological Survey data release. https://doi.org/10.5066/P9TK6NPT
Geiser, Linda & Nelson, Peter & Jovan, Sarah & Root, Heather & Clark, Christopher. (2019). Assessing Ecological Risks from Atmospheric Deposition of Nitrogen and Sulfur to US Forests Using Epiphytic Macrolichens. Diversity. 11. 87. 10.3390/d11060087.
Geiser, Linda & Root, Heather & Smith, Robert & Jovan, Sarah & Clair, Larry & Dillman, Karen. (2021). Lichen-based critical loads for deposition of nitrogen and sulfur in US forests. Environmental Pollution. 291. 118187. 10.1016/j.envpol.2021.118187.
George, Eckhard, Horst Marschner, and Iver Jakobsen. "Role of arbuscular mycorrhizal fungi in uptake of phosphorus and nitrogen from soil." Critical reviews in biotechnology 15.3-4 (1995): 257-270.
Horn KJ, Thomas RQ, Clark CM, Pardo LH, Fenn ME, Lawrence GB, et al. (2018) Growth and survival relationships of 71 tree species with nitrogen and sulfur deposition across the conterminous U.S.. PLoS ONE 13(10): e0205296. https://doi.org/10.1371/journal.pone.0205296
Ingersoll, G. P., Mast, M. A., Nanus, L., Handran, H. H., Manthorne, D. J., and Hultstrand, D. M. 2007. Rocky Mountain snowpack chemistry at selected sites, 2004: U.S. Geological Survey Open-File Report 2007-1045, 15 p. Available at https://pubs.usgs.gov/of/2007/1045/
Ingersoll, G. P., Mast, M. A., Nanus, L., Handran, H. H., Manthorne, D. J., and Hultstrand, D. M. 2007. Rocky Mountain snowpack chemistry at selected sites, 2004: U.S. Geological Survey Open-File Report 2007-1045, 15 p. Available at https://pubs.usgs.gov/of/2007/1045/
Keteles, K. 2011. Screening for Pesticides in High Elevation Lakes in Federal Lands. EPA Final Report. Denver, CO. 11 pp. Available at https://irma.nps.gov/DataStore/Reference/Profile/2184330
Kohut, R. 2004. Assessing the Risk of Foliar Injury from Ozone on Vegetation in Parks in the Greater Yellowstone Network. Available at https://irma.nps.gov/DataStore/Reference/Profile/2181291.
Krabbenhoft, D. P., Olson, M. L., Dewild, J. F., Clow, D. W., Striegl, R. G., Dornblaser, M. M., and VanMetre, P. 2002. Mercury loading and methylmercury production and cycling in high-altitude lakes from the western United States. Water, Air, and Soil Pollution, Focus 2: 233–249. https://irma.nps.gov/DataStore/Reference/Profile/648386
Landers, D. H., S. L. Simonich, D. A. Jaffe, L. H. Geiser, D. H. Campbell, A. R. Schwindt, C. B. Schreck, M. L. Kent, W. D. Hafner, H. E. Taylor, K. J. Hageman, S. Usenko, L. K. Ackerman, J. E. Schrlau, N. L. Rose, T. F. Blett, and M. M. Erway. 2008. The Fate, Transport, and Ecological Impacts of Airborne Contaminants in Western National Parks (USA). EPA/600/R—07/138. U.S. Environmental Protection Agency, Office of Research and Development, NHEERL, Western Ecology Division, Corvallis, Oregon. Available at https://irma.nps.gov/DataStore/Reference/Profile/660829.
Landers, D. H., Simonich, S. M., Jaffe, D., Geiser, L., Campbell, D. H.,
Schwindt, A., Schreck, C., Kent, M., Hafner, W., Taylor, H. E., Hageman, K., Usenko, S., Ackerman, L., Schrlau, J., Rose, N., Blett, T., Erway, M. M. 2010. The Western Airborne Contaminant Assessment Project (WACAP): An Interdisciplinary Evaluation of the Impacts of Airborne Contaminants in Western U.S. National Parks. Environmental Science and Technology 44: 855–859.
Lee EH, Anderson CP, Beedlow PA, Tingey DT, Koike S, Dubois J, Kaylor SD, Novak K, Rice RB, Neufeld HS, Herrick JD. 2022. Ozone Exposure-Response Relationships Parametrized for Sixteen Tree Species with Varying Sensitivity in the United States. Atmospheric Environment. 284:1-16. https://irma.nps.gov/DataStore/Reference/Profile/2294221
Lilleskov, Erik A., et al. "Atmospheric nitrogen deposition impacts on the structure and function of forest mycorrhizal communities: a review." Environmental Pollution 246 (2019): 148-162.
Mao H, Felker-Quinn E, Sive B, Zhang L, Ye Z, Fang H. 2024. Examining indicators and methods for quantifying ozone exposure to vegetation. Atmospheric Environment 316: 120195. https://www.sciencedirect.com/science/article/pii/S1352231023006210?via%3Dihub
McClung JJ, Bell MD, Felker-Quinn E. 2021. Extrapolating critical loads of nitrogen for alpine vegetation and assessing exceedance in national parks based on TDep Total N from 2002–2016. Natural Resource Report. NPS/NRSS/ARD/NRR—2021/2240. National Park Service. Fort Collins, Colorado. https://doi.org/10.36967/nrr-2284914
McCoy K., M. D. Bell, and E. Felker-Quinn. 2021. Risk to epiphytic lichen communities in NPS units from atmospheric nitrogen and sulfur pollution: Changes in critical load exceedances from 2001‒2016. Natural Resource Report NPS/NRSS/ARD/NRR—2021/2299. National Park Service, Fort Collins, Colorado. https://doi.org/10.36967/nrr-2287254
[NADP] National Atmospheric Deposition Program. 2018. NTN Data. Accessed January 20, 2022. Available at http://nadp.slh.wisc.edu/NADP
Nanus L, Clow D, Saros J, Stephens V, Campbell D. 2012. Mapping Critical Loads of Nitrogen Deposition for Aquatic Ecosystems in the Rocky Mountains, USA.. Environmental Pollution. 166:125-135
Nanus L, McMurray JA, Blett TF. 2022. Environmental management of air quality issues in the Greater Yellowstone Area. Natural Resource Report. NPS/NRSS/ARD/NRR—2022/2441. National Park Service. Fort Collins, Colorado. https://doi.org/10.36967/2294111
Nanus, L., Williams, M. W., Campbell, D. H., Tonnessen, K. A., Blett, T., and Clow, D. W. 2009. Assessment of lake sensitivity to acidic deposition in national parks of the Rocky Mountains. Ecological Applications 19(4): 961–973.
[NPS] National Park Service. 2022. Fish Consumption Advisories. https://www.nps.gov/subjects/fishing/fish-consumption-advisories.htm
[NPS] National Park Service. 2010. Air Quality in National Parks: 2009 Annual Performance and Progress Report. Natural Resource Report NPS/NRPC/ARD/NRR—2010/266. National Park Service, Denver, Colorado. Available at https://irma.nps.gov/DataStore/Reference/Profile/2166247.
Peterson, D. L., Sullivan, T. J., Eilers, J. M., Brace, S., Horner, D., Savig, K., and Morse, D. 1998. Assessment of air quality and air pollutant impacts in national parks of the Rocky Mountains and Northern Great Plains. Report NPS/CCSOUW/NRTR—98/19. National Park Service, Air Resources Division, Denver, CO. Chapter 4: Grand Teton National Park. Available at https://irma.nps.gov/DataStore/Reference/Profile/11733
Porter, E. and Johnson, S. 2007. Translating science into policy: Using ecosystem thresholds to protect resources in Rocky Mountain National Park. Environmental Pollution 149: 268–280.
Porter, E., Blett, T., Potter, D.U., Huber, C. 2005. Protecting resources on federal lands: Implications of critical loads for atmospheric deposition of nitrogen and sulfur. BioScience 55(7): 603–612. https://doi.org/10.1641/0006-3568(2005)055[0603:PROFLI]2.0.CO;2
Saros, J. E., Clow, D. W., Blett, T., Wolfe, A. P. 2010. Critical nitrogen deposition loads in high-elevation lakes of the western U.S. inferred from paleolimnological records. Water, Air, and Soil Pollution 216(1–4): 193–202.
Schreck, C.B. and M. Kent. 2013. Extent of Endocrine Disruption in Fish of Western and Alaskan National Parks. NPS-OSU Task Agreement J8W07080024. NPS Final Report, 72 pp. https://irma.nps.gov/DataStore/DownloadFile/469831
Schwindt, A. R., Kent, M. L., Ackerman, L. K., Massey Simonich, S. L., Landers, D. H., Blett, T., Schreck, C. B. 2009.Reproductive Abnormalities in Trout from Western U.S. National Parks. Transactions of the American Fisheries Society 138: 522–531.
Spaulding, S. A., Baron, J. S., Wolfe, A. P., O’Ney, S., Blett, T. 2009. Atmospheric deposition of inorganic nitrogen in Grand Teton NP: determining biological effects on algal communities in alpine lakes. NPS Final Implementation Plan.
Sullivan, T. J. 2016. Air quality related values (AQRVs) in national parks: Effects from ozone; visibility reducing particles; and atmospheric deposition of acids, nutrients and toxics. Natural Resource Report NPS/NRSS/ARD/NRR—2016/1196. National Park Service, Fort Collins, CO.
U.S. Geological Survey (USGS). 2021. Rocky Mountain Regional Snowpack Chemistry Monitoring Study. USGS data available at https://www.usgs.gov/centers/colorado-water-science-center/science/rocky-mountain-regional-snowpack-chemistry-monitoring#overview
Van Miegroet, H. 2010. Assessment of nitrogen deposition and its possible effects on alpine vegetation in Grand Teton National Park. NPS Final Report.
Williams MW, Baron JS, Caine N, Sommerfeld R, Sanford R. 1996. Nitrogen saturation in the Rocky Mountains. Environmental Science & Technology. 30(2):640-646
Last updated: September 30, 2024