Part of a series of articles titled Park Air Profiles.
Article
Park Air Profiles - Everglades National Park
Air Quality at Everglades National Park
Most visitors expect clean air and clear views in parks. Everglades National Park (NP), Florida, the “River of Grass” and home to the only subtropical preserve in North America, often experiences relatively poor air quality. The park is affected by many sources of air pollution, including power plants, urban areas, agriculture, and industry. Pollutants from these sources can harm the park’s natural and scenic resources such as surface waters, vegetation, birds, fish, and visibility. The National Park Service works to address air pollution effects at Everglades NP, and in parks across the U.S., through science, policy and planning, and by doing our part.
Nitrogen and Sulfur

Nitrogen (N) and sulfur (S) compounds deposited from the air may have harmful effects on ecosystem processes. Healthy ecosystems can naturally buffer a certain amount of pollution, but once a threshold is passed the ecosystem may respond negatively. This threshold is the critical load, or the amount of pollution above which harmful changes in sensitive ecosystems occur (Porter 2005). N and S deposition change ecosystems through eutrophication (N deposition) and acidification (N + S deposition). Eutrophication increases soil and water nutrients which causes some species to grow more quickly and changes community composition. Ecosystem sensitivity to nutrient N enrichment at Everglades National Park (EVER) relative to other national parks is very high (Sullivan et al. 2016); for a full list of N sensitive ecosystem components, see: NPS ARD 2019. Acidification leaches important cations from soils, lakes, ponds, and streams which decreases habitat quality. Ecosystem sensitivity to acidification at EVER relative to other national parks is low (Sullivan et al. 2016); to search for acid-sensitive plant species, see: NPSpecies.
From 2017-2019 total N deposition in EVER ranged from 4.8 to 10.1 kg-N ha-1 yr-1 and total S deposition ranged from 3.1 to 5.7 kg-S ha-1 yr-1 based on the TDep model (NADP, 2018). EVER has been monitoring atmospheric N and S deposition since 1980, see the conditions and trends website for park-specific information.
At EVER, emissions of ammonium from nearby agricultural sources contribute to increased N deposition in the park (NPS 2010). These nutrient inputs can cause changes to soil nutrient cycling (Sullivan et al. 2016). Wetland plant species adapted to low N environments are sensitive to the effects of nutrient N enrichment because species relationships are altered, which sometimes increases numbers of non-native species at the expense of rare species.
The freshwater and saltwater ecosystems at EVER are well-buffered from the effects of acidification (Sullivan et al. 2016). Of note for EVER is the essential role of S in the methylation of mercury. A process that leads to toxic accumulation of mercury in fish and wildlife. Although the main source of S is runoff from agriculture north of the park, local emissions from coal-burning power plants might contribute to this problem.
Epiphytic macrolichen community responses
Epiphytic macrolichens grow on tree trunks, branches, and boles. Since these lichens grow above the ground, they obtain all their nutrients directly from precipitation and the air. Many epiphytic lichen species have narrow environmental niches and are extremely sensitive to changes in air pollution. Geiser et al. (2019) used a U.S. Forest Service national survey to develop critical loads of nitrogen (N) and critical loads of sulfur (S) to prevent more than a 20% decline in four lichen community metrics: total species richness, pollution sensitive species richness, forage lichen abundance, and cyanolichen abundance.
McCoy et al. (2021) used forested area from the National Land Cover Database to estimate the impact of air pollution on epiphytic lichen communities. Forested area makes up only 18.6 km2 (0.3%) of the land area of Everglades National Park as this analysis did not include woody wetlands.
- N deposition exceeded the 3.1 kg-N ha-1 yr-1 critical load to protect N-sensitive lichen species richness in 100% of the forested area.
- S deposition exceeded the 2.7 kg-S ha-1 yr-1 critical load to protect S-sensitive lichen species richness in 100% of the forested area.
For exceedances of other lichen metrics and the predicted decline of lichen communities see Appendices A and B of McCoy et al. (2021).
Additional modeling was done on 459 lichen species to test the combined effects of air pollution and climate gradients (Geiser et al. 2021). A critical load indicative of initial shifts from pollution-sensitive toward pollution-tolerant species occurred at 1.5 kg-N ha-1 yr-1 and 2.7 kg-S ha-1 yr-1 even under changing climate regimes.
Plant species response
Plants vary in their tolerance of eutrophication and acidification, and some plant species respond to nitrogen (N) or sulfur (S) pollution with declines in growth, survival, or abundance on the landscape. Horn et al. (2018) used the U.S. Forest Service national forest survey to develop critical loads of N and critical loads of S to prevent declines in growth or survival of sensitive tree species. Clark et al. (2019) used a database of plant community surveys to develop critical loads of N and critical loads of S to prevent a decline in abundance of sensitive herbaceous plant species. According to NPSpecies, Everglades National Park contains:
- 3 N-sensitive tree species and 9 N-sensitive herbaceous species.
- 5 S-sensitive tree species and 8 S-sensitive herbaceous species.
Mycorrhizal fungi community response
Many plants have a symbiotic relationship with mycorrhizal fungi (MF). Through the roots, the plants supply the fungi with carbon from photosynthesis and in exchange the MF enhance nutrient availability within soils, increase drought tolerance, and provide physical resistance to soil erosion (George et al., 1995; Cheng et al., 2021; Burri et al., 2013). Anthropogenic Nitrogen (N) deposition can disrupt this symbiotic relationship resulting in a shift from N sensitive to N tolerant mycorrhizal fungi and plant communities.
With increased N deposition to the soil, MF become less important for nutrient uptake and many plants will cease the exchange of nutrients altogether making them more vulnerable to stressors such as drought (Lilleskov et al., 2019). The CL-N for the shift in mycorrhizal community is 5-6 kg-N ha-1 yr-1 in coniferous forests and 10-20 kg-N ha-1 yr-1 broadleaf forests.
Everglades National Park has 7.2 km2 of coniferous forests, 0.9 km2 of broadleaf forests, and 25.2 km2 of mixed forests. Using the range in critical loads above, the minimum CL is exceeded in 97.2% of forested area and the maximum CL is exceeded in 18.8% of forested area based on 2019-2021 TDep Total N deposition.
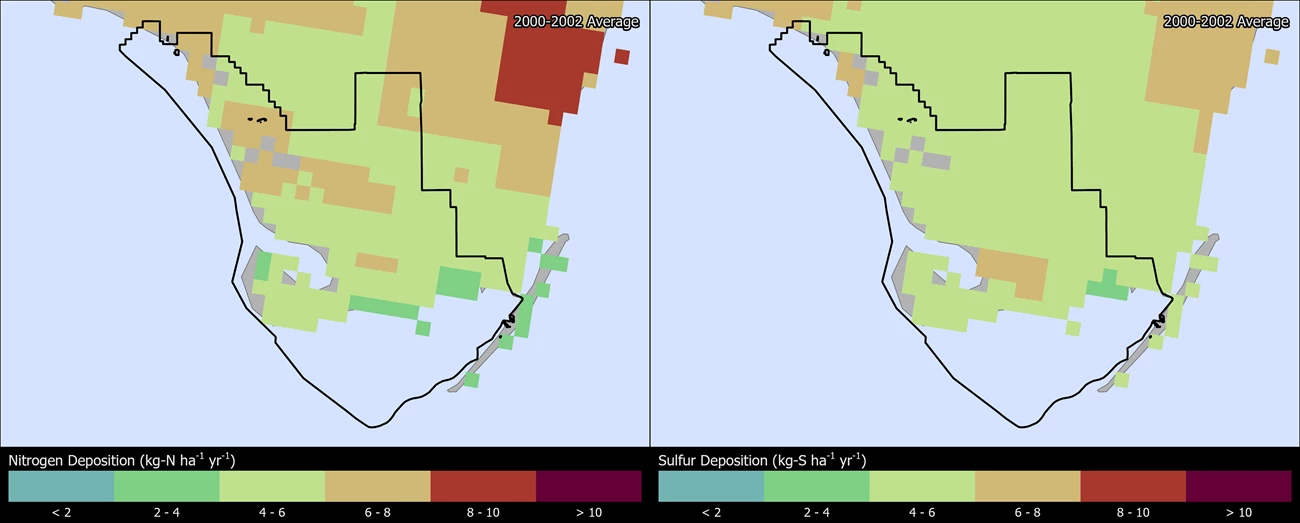
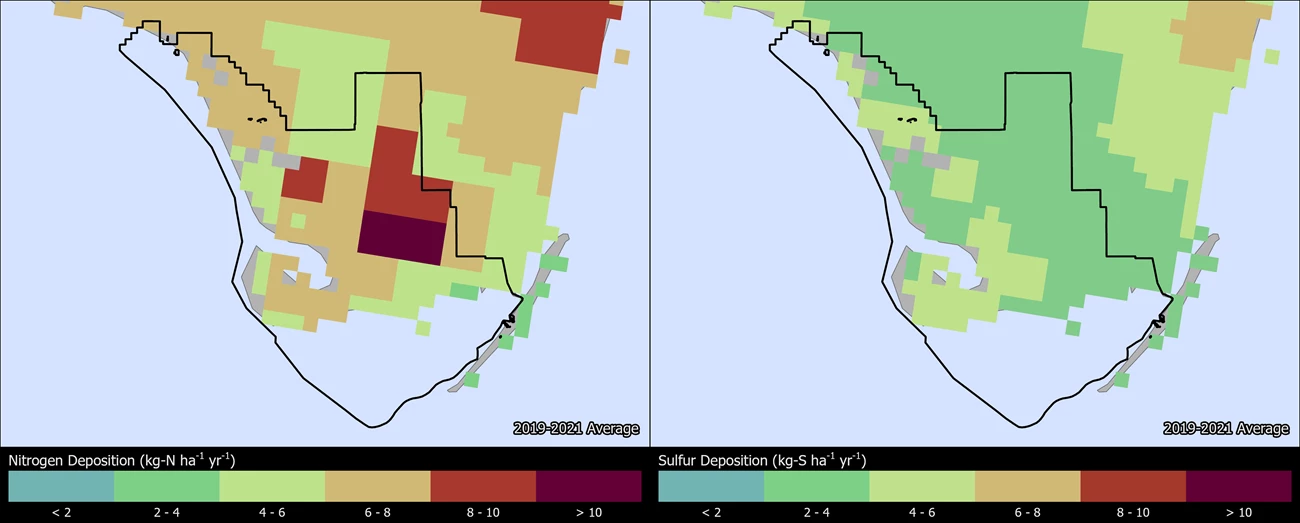
Change in N and S deposition from 2000 to 2021
The maps below show how the spatial distribution of estimated Total N and Total S deposition in EVER has changed from 2000-2002 to 2019-2021 (TDep MMF version 2022.02). Slide the arrows in the middle of the image up and down to compare N and S deposition between the two years (Yearly Data).
- Minimum N deposition increased from 2.8 to 4.1 kg-N ha-1 yr-1 and maximum N deposition increased from 6.8 to 27.1 kg-N ha-1 yr-1.
- Minimum S deposition decreased from 4.1 to 3.3 kg-S ha-1 yr-1 and maximum S deposition decreased from 6.5 to 4.7 kg-S ha-1 yr-1.
Persistent Pollutants
Pollutants like mercury and pesticides are concerning because they are persistent and toxic in the environment. These contaminants can travel in the air thousands of miles away from the source of pollution, even depositing in protected places like national parks. In addition, while some of these harmful pollutants may be banned from use, historically contaminated sites continue to endure negative environmental consequences.
When deposited, airborne mercury and other toxic air contaminants are known to harm wildlife like birds and fish, and cause human health concerns. Many of these substances enter the food chain and accumulate in the tissue of organisms causing reduced reproductive success, impaired growth and development, and decreased survival.
- Mercury concentrations in some fish sampled at Everglades NP exceeded the EPA threshold for human consumption. Preliminary data from three sites in the park indicate an average fish mercury concentration of 0.407 ppm ww. Mercury concentrations in 48% of the fish sampled (n=50) exceeded the EPA health benchmark established for human consumption (0.3 ppm ww) (Eagles-Smith et al. 2019). However, the data may not reflect the risk at other unsampled locations in the park. Fish consumption advisories may be in effect for mercury and other contaminants (NPS 2022).
- Some dragonfly larvae sampled at Everglades NP had mercury concentrations at moderate or high impairment levels. Dragonfly larvae have been sampled and analyzed for mercury from three sites in the park; 75% of the data fall into the moderate (100-300 ng/g dw) and 17% fall into the high/severe (300-700 ng/g dw) impairment categories for potential mercury risk. An index of moderate impairment or higher suggests some fish may exceed the US EPA benchmark for protection of human health (Eagles-Smith et al. 2018; Eagles-Smith et al. 2020).
- High mercury levels have been found in Florida panthers, an endangered species, in Everglades NP (Roelke et al. 1991; Newman et al. 2004; Brandon et al. 2009). A study in the early 2000s found that risks of mercury exposure to panthers had decreased somewhat from the 1990s (Barron et al. 2004). However, Everglades NP continues to have the highest concentrations of mercury in panther hair and blood in South Florida regions (SFER 2011). This might be related to a diet favoring fish-eating wildlife like raccoons and alligators. Read more about the Florida panther and mercury.
- Older studies also found elevated mercury levels in park sediment, vegetation, and all levels of the food chain, including frogs, fish, birds such as the great egret and the bald eagle, pythons, alligators, and the endangered Florida panther (Sundlof et al. 1994; Guentzel et al. 1998; Rumbold et al. 2002; Rumbold 2005). Mercury levels in frogs and pythons were above human health thresholds (Ugarte et al. 2005; Hart et al. 2010).
- Elevated concentrations of pesticides, particularly endosulfan, were found in park sediment, surface waters, and fish (Carriger et al. 2006; Carriger and Rand 2008a and 2008b; Rand et al. In Prep). Elevated levels of this agricultural pesticide in sediment, surface waters, and native fish in the Everglades, nearby Biscayne Bay, and several western national parks, led to a ban on endosulfan.
Visibility
Visitors come to Everglades NP to enjoy sights of some of the most rare and endangered species in the U.S., including the manatee and American crocodile, as well as plant communities such as mangrove and cypress swamps. Park views are sometimes obscured by haze, reducing how well and how far people can see. Visibility reducing haze is caused by tiny particles in the air, and these particles can also affect human health. Many of the same pollutants that ultimately fall out as nitrogen and sulfur deposition contribute to this haze. Organic compounds, soot, and dust reduce visibility as well. Significant improvements in park visibility on clearest days have been documented since the 1990’s. Still, visibility in the park is a long way from the Clean Air Act goal of no human caused impairment.
Visibility effects:
- Reduction of the average natural visual range from about 110 miles (without the effects of pollution) to about 65 miles because of pollution at the park
- Reduction of the visual range to below 40 miles on high pollution days.
Visit the NPS air quality conditions and trends website for park-specific visibility information. Everglades NP has been monitoring visibility since 1988. Explore air monitoring »
Ground-Level Ozone

At ground level, ozone is harmful to human health and the environment. Ground-level ozone does not come directly from smokestacks or vehicles, but instead is formed when other pollutants, mainly nitrogen oxides and volatile organic compounds, react in the presence of sunlight.
Over the course of a growing season, ozone can damage plant tissues making it harder for plants to grow and store carbon. Ozone causes leaf injuries like bleaching or dark spots on some sensitive plants. There is one plant that may display ozone leaf injury at Everglades National Park. Search ozone-sensitive plant species found at Everglades National Park.
US Environmental Protection Agency and NPS found in ozone exposure experiments that ozone slowed tree seedling growth. NPS uses W126 values from averaged seedling responses in those experiments to describe park condition in terms of Vegetation Health. Ozone affects actively growing plants, so the W126 metric weights a sum of ozone concentrations during daylight hours over three months in the growing season.
A recent re-analysis of the seedling experiments established critical levels of ozone protective of each tree species tested (Lee et al. 2022). The ozone critical levels are W126 values that will prevent 5% or greater deficit in tree seedling biomass. Air Quality Conditions and Trends reports a 5-year average of W126 for each park. In 2018-2022, the average W126 value for Everglades National Park was 3.8 ppm-h. Based on this ozone level, trees present in the park (NPSpecies) are at low risk of ozone effects:
-
Tree species winged sumac (Rhus copallinum) and red maple (Acer rubrum) are at low risk from ozone despite their known sensitivity. Recent ozone levels in the park are below critical levels that protect these trees from 5% biomass deficit.
Ozone critical levels are for tree seedlings, which represent the regenerative capacity and long-term stability of sensitive species within a forest. These tree species are also known to be sensitive to ozone as adults (Bell et al. 2020), but critical values for seedling growth do not predict ozone effects on mature trees. Air Resources Division is currently working with collaborators to establish critical levels for mature trees using data from forest monitoring plots.
Visit the NPS air quality conditions and trends website for park-specific ozone information.
Explore Other Park Air Profiles
There are 47 other Park Air Profiles covering parks across the United States and its territories.
References
Barron, M. G., Duvall, S. E., Barron, K. J. 2004. Retrospective and Current Risks of Mercury to Panthers in the Florida Everglades. Ecotox. 13: 233–229. https://irma.nps.gov/DataStore/Reference/Profile/2171802
Bell MD, Felker-Quinn E, Kohut R. 2020. Ozone sensitive plant species on National Park Service lands. Natural Resource Report. NPS/WASO/NRR—2020/2062. National Park Service. Fort Collins, Colorado. https://irma.nps.gov/DataStore/Reference/Profile/2271702
Brandon, A., Cunningham, M., Onorato, D., Jansen D., Rumbold, D. G. 2009. Spatial and Temporal Patterns in Mercury Concentrations in Blood and Hair of Florida Panthers (Puma concolor coryi): 1978–2008. 30th Annual Meeting of Society of Environmental Toxicology and Chemistry, New Orleans, ar. https://irma.nps.gov/DataStore/Reference/Profile/2171806
Burri, K., C. Gromke, and F. Graf. "Mycorrhizal fungi protect the soil from wind erosion: a wind tunnel study." Land Degradation & Development 24.4 (2013): 385-392.
Carriger, J. F. and Rand, G. M. 2008a. Aquatic Risk Assessment of Pesticides in Surface Waters in and Adjacent to the Everglades and Biscayne National Parks: I. Hazard Assessment and Problem Formulation. Ecotoxicology 17 (7): 660–679. https://doi.org/10.1007/s10646-008-0230-0
Carriger, J. F. and Rand, G. M. 2008b. Aquatic Risk Assessment of Pesticides in Surface Waters in and Adjacent to the Everglades and Biscayne National Parks: II. Probabilistic Analyses. Ecotoxicology 17 (7): 680–696. https://doi.org/10.1007/s10646-008-0231-z
Carriger, J. F., Rand, G. M., Gardinali, P. R., Perry, W. B., Tompkins, M. S., Fernandez, A. M. 2006. Pesticides of Potential Ecological Concern in Sediment from South Florida Canals: An Ecological Risk Prioritization for Aquatic Arthropods. Soil and Sediment Contamination 15 (1): 21–45.
Cheng, Shen, et al. "Elucidating the mechanisms underlying enhanced drought tolerance in plants mediated by arbuscular mycorrhizal fungi." Frontiers in Microbiology 12 (2021): 809473.
Clark, C.M., Simkin, S.M., Allen, E.B. et al. Potential vulnerability of 348 herbaceous species to atmospheric deposition of nitrogen and sulfur in the United States. Nat. Plants 5, 697–705 (2019). https://doi.org/10.1038/s41477-019-0442-8
Eagles-Smith, C.A., S.J. Nelson., C.M. Flanagan Pritz, J.J. Willacker Jr., and A. Klemmer. 2018. Total Mercury Concentrations in Dragonfly Larvae from U.S. National Parks (ver. 6.0, June 2021): U.S. Geological Survey data release. https://doi.org/10.5066/P9TK6NPT
Eagles-Smith, CA, JJ Willacker, CM Flanagan Pritz, AC Ellsworth. 2019. Total Mercury Concentrations in Fish from 31 National Parks, USA, 2015-2016. USGS Sensitive Data Release. https://irma.nps.gov/DataStore/Reference/Profile/2260288
Eagles-Smith, C.A., J.J. Willacker, S.J. Nelson, C.M. Flanagan Pritz, D.P. Krabbenhoft, C.Y. Chen, J.T. Ackerman, E.H. Campbell Grant, and D.S. Pilliod. 2020. Dragonflies as biosentinels of mercury availability in aquatic food webs of national parks throughout the United States. Environmental Science and Technology 54(14):8779-8790. https://doi.org/10.1021/acs.est.0c01255
[EPA] U.S. Environmental Protection Agency. 2008. The National Listing of Fish Advisories. Available at https://www.epa.gov/choose-fish-and-shellfish-wisely/fish-and-shellfish-advisories-and-safe-eating-guidelines
Florida [DOH] Department of Health. 2016. Your Guide To Eating Fish Caught In Florida. Available at https://irma.nps.gov/DataStore/Reference/Profile/2227753
Geiser, Linda & Nelson, Peter & Jovan, Sarah & Root, Heather & Clark, Christopher. (2019). Assessing Ecological Risks from Atmospheric Deposition of Nitrogen and Sulfur to US Forests Using Epiphytic Macrolichens. Diversity. 11. 87. 10.3390/d11060087.
Geiser, Linda & Root, Heather & Smith, Robert & Jovan, Sarah & Clair, Larry & Dillman, Karen. (2021). Lichen-based critical loads for deposition of nitrogen and sulfur in US forests. Environmental Pollution. 291. 118187. 10.1016/j.envpol.2021.118187.
George, Eckhard, Horst Marschner, and Iver Jakobsen. "Role of arbuscular mycorrhizal fungi in uptake of phosphorus and nitrogen from soil." Critical reviews in biotechnology 15.3-4 (1995): 257-270.
Guentzel, J. L., Landing, W. M., Gill, G. A., Pollman, C. D. 1998. Mercury and major ions in rainfall, throughfall, and foliage from the Florida Everglades. The Science of the Total Environment 213: 43–51. https://irma.nps.gov/DataStore/Reference/Profile/664056
Hart, K., D. Krabbenhoft, and S. Snow. 2010. Mercury Bioaccumulation in Everglades Pythons. Poster, Greater Everglades Ecosystem Restoration Conference: July 12–16, 2010. Naples, FL. https://irma.nps.gov/DataStore/Reference/Profile/2172138
Horn KJ, Thomas RQ, Clark CM, Pardo LH, Fenn ME, Lawrence GB, et al. (2018) Growth and survival relationships of 71 tree species with nitrogen and sulfur deposition across the conterminous U.S.. PLoS ONE 13(10): e0205296. https://doi.org/10.1371/journal.pone.0205296
Kohut, B. 2004. Assessing the Risk of Foliar Injury from Ozone on Vegetation in Parks in the South Florida / Caribbean Network. Available at https://irma.nps.gov/DataStore/Reference/Profile/2181551
Krabbenhoft, D. P. 2010. Mercury Bioaccumulation in Everglades Pythons. Poster, Greater Everglades Ecosystem Restoration Conference: July 12–16, 2010. Naples, FL.
Lee EH, Anderson CP, Beedlow PA, Tingey DT, Koike S, Dubois J, Kaylor SD, Novak K, Rice RB, Neufeld HS, Herrick JD. 2022. Ozone Exposure-Response Relationships Parametrized for Sixteen Tree Species with Varying Sensitivity in the United States. Atmospheric Environment. 284:1-16. https://irma.nps.gov/DataStore/Reference/Profile/2294221
Lilleskov, Erik A., et al. "Atmospheric nitrogen deposition impacts on the structure and function of forest mycorrhizal communities: a review." Environmental Pollution 246 (2019): 148-162.
McCoy K., M. D. Bell, and E. Felker-Quinn. 2021. Risk to epiphytic lichen communities in NPS units from atmospheric nitrogen and sulfur pollution: Changes in critical load exceedances from 2001‒2016. Natural Resource Report NPS/NRSS/ARD/NRR—2021/2299. National Park Service, Fort Collins, Colorado. https://doi.org/10.36967/nrr-2287254.
[NADP] National Atmospheric Deposition Program. 2018. NTN Data. Accessed January 20, 2022. Available at http://nadp.slh.wisc.edu/NADP/
Newman, J., Zillioux, E., Rich, E., Liang, L., Newman, C. 2004. Historical and Other Patterns of Monomethyl and Inorganic Mercury in the Florida Panther (Puma concolor coryi). Arch. Environ. Contam. Toxicol. 48: 75–80. https://irma.nps.gov/DataStore/Reference/Profile/2171915
[NPS] National Park Service. 2010. Air Quality in National Parks: 2009 Annual Performance and Progress Report. Natural Resource Report NPS/NRPC/ARD/NRR—2010/266. National Park Service, Denver, Colorado. Available at https://irma.nps.gov/DataStore/Reference/Profile/2166247
[NPS] National Park Service. 2022. Fish Consumption Advisories. https://www.nps.gov/subjects/fishing/fish-consumption-advisories.htm
Porter, E., Blett, T., Potter, D.U., Huber, C. 2005. Protecting resources on federal lands: Implications of critical loads for atmospheric deposition of nitrogen and sulfur. BioScience 55(7): 603–612. https://doi.org/10.1641/0006-3568(2005)055[0603:PROFLI]2.0.CO;2
Rand, G. M. and Carriger, J. F. 2004. Screening Level Ecological Risk Assessment (SERA): Canal-111 and Adjacent Coastal Areas. Report submitted to Everglades National Park.
Rand, G.M. et al. South Florida Freshwater Ecological Risk Assessment: 1990–2007. In Prep.
Roelke, M. E., Schultz, D. P., Facemire, C. F., Sundlof, S. F., Royals, H. E. 1991. Mercury Contamination in Florida Panthers. Report of the Florida Panther Technical Subcommittee to the Florida Panther Interagency Committee. https://irma.nps.gov/DataStore/Reference/Profile/604674
Rumbold, D. G. 2005. A probabilistic risk assessment of the effects of methylmercury on great egrets and bald eagles foraging at a constructed wetland in South Florida relative to the Everglades. Human and Ecological Risk Assessment 11 (2): 365–388. https://irma.nps.gov/DataStore/Reference/Profile/664106
Rumbold, D. G., Fink, L. E., Laine, K. A., Niemczyk, S. L., Chandrasekhar, T., Wankel, S. D., Kendall, C. 2002. Levels of mercury in alligators (Alligator mississippiensis) collected along a transect through the Florida Everglades. Science of the Total Environment 297 (1–3): 239–252. https://irma.nps.gov/DataStore/Reference/Profile/664107
[SFER] South Florida Environmental Report. 2011. Volume I The South Florida Environment. South Florida Water Management District, West Palm Beach, Florida.
Sullivan, T. J. 2016. Air quality related values (AQRVs) in national parks: Effects from ozone; visibility reducing particles; and atmospheric deposition of acids, nutrients and toxics. Natural Resource Report NPS/NRSS/ARD/NRR—2016/1196. National Park Service, Fort Collins, CO.
Sundlof, S. F., Spalding, M. G., Wentworth, J. D., Steible, C. K. 1994. Mercury in Livers of Wading Birds (Ciconiiformes) in Southern Florida. Archives of Environmental Contamination and Toxicology 27 (3): 299–305. https://doi.org/10.1007/BF00213163
Ugarte, C. A., Rice, K. G., Donnelly, M. A. 2005. Variation of total mercury concentrations in pig frogs (Rana grylio) across the Florida Everglades, USA. Science of the Total Environment 345 (1–3): 51–59. https://irma.nps.gov/DataStore/Reference/Profile/664123
Last updated: September 23, 2024