Part of a series of articles titled Park Air Profiles.
Article
Park Air Profiles - Craters of the Moon National Monument & Preserve
Air Quality at Craters of the Moon National Monument & Preserve
Most visitors expect clean air and clear views in parks. Craters of the Moon National Monument & Preserve (NM & Pres), Idaho, is a volcanic landscape of lava fields and sagebrush steppe. Some nearby and regional sources of air pollution, including industrial facilities, agricultural activities, and mining operations can affect the park. Air pollutants blown into the park can harm natural and scenic resources such as soils, surface waters, plants, wildlife, and visibility. The National Park Service works to address air pollution effects at Craters of the Moon NM & Pres, and in parks across the U.S., through science, policy and planning, and by doing our part.
Nitrogen and Sulfur

Nitrogen (N) and sulfur (S) compounds deposited from the air may have harmful effects on ecosystem processes. Healthy ecosystems can naturally buffer a certain amount of pollution, but once a threshold is passed the ecosystem may respond negatively. This threshold is the critical load, or the amount of pollution above which harmful changes in sensitive ecosystems occur (Porter 2005). N and S deposition change ecosystems through eutrophication (N deposition) and acidification (N + S deposition). Eutrophication increases soil and water nutrients which causes some species to grow more quickly and changes community composition. Ecosystem sensitivity to nutrient N enrichment at Craters of the Moon National Monument (CRMO) relative to other national parks is moderate (Sullivan et al. 2016); for a full list of N sensitive ecosystem components, see: NPS ARD 2019. Acidification leaches important cations from soils, lakes, ponds, and streams which decreases habitat quality. Ecosystem sensitivity to acidification at CRMO relative to other national parks is very low (Sullivan et al. 2016); to search for acid-sensitive plant species, see: NPSpecies.
From 2017-2019 total N deposition in CRMO ranged from 2.2 to 3.9 kg-N ha-1 yr-1 and total S deposition ranged from 0.4 to 0.7 kg-S ha-1 yr-1 based on the TDep model (NADP, 2018). CRMO has been monitoring atmospheric N and S deposition since 1980, see the conditions and trends website for park-specific information.
Fast growing exotic annual grasses (i.e., cheatgrass) and forbs (I.e., Russian thistle) tend to thrive in areas with high N deposition at the expense of native plants adapted to low N conditions (Brooks 2003; Allen et al. 2009; Schwinning et al. 2005). Cheatgrass is now found even in isolated and undisturbed areas of CRMO. A study of sagebrush steppe ecosystems in CRMO and nearby parks saw decreases of native plants in areas with high N deposition while the cover of invasive grasses increased (Allen 2013).
Epiphytic macrolichen community responses
Epiphytic macrolichens grow on tree trunks, branches, and boles. Since these lichens grow above the ground, they obtain all their nutrients directly from precipitation and the air. Many epiphytic lichen species have narrow environmental niches and are extremely sensitive to changes in air pollution. Epiphytic lichen communities are less diverse in arid areas, but are still impacted by air pollution. Geiser et al. (2019) used a U.S. Forest Service national survey to develop critical loads of nitrogen (N) and critical loads of sulfur (S) to prevent more than a 20% decline in four lichen community metrics: total species richness, pollution sensitive species richness, forage lichen abundance, and cyanolichen abundance.
McCoy et al. (2021) used forested area from the National Land Cover Database to estimate the impact of air pollution on epiphytic lichen communities. Forested area makes up 2.9 km2 (0.15%) of the land area of Craters of the Moon National Monument.
- N deposition was below the 3.1 kg-N ha-1 yr-1 critical load to protect N-sensitive lichen species richness in every part of the forested area.
- S deposition was below the 2.7 kg-S ha-1 yr-1 critical load to protect S-sensitive lichen species richness in every part of the forested area.
For exceedances of other lichen metrics and the predicted decline of lichen communities see Appendices A and B of McCoy et al. (2021).
Additional modeling was done on 459 lichen species to test the combined effects of air pollution and climate gradients (Geiser et al. 2021). A critical load indicative of initial shifts from pollution-sensitive toward pollution-tolerant species occurred at 1.5 kg-N ha-1 yr-1 and 2.7 kg-S ha-1 yr-1 even under changing climate regimes.
Plant species response
Plants vary in their tolerance of eutrophication and acidification, and some plant species respond to nitrogen (N) or sulfur (S) pollution with declines in growth, survival, or abundance on the landscape. Horn et al. (2018) used the U.S. Forest Service national forest survey to develop critical loads of N and critical loads of S to prevent declines in growth or survival of sensitive tree species. Clark et al. (2019) used a database of plant community surveys to develop critical loads of N and critical loads of S to prevent a decline in abundance of sensitive herbaceous plant species. According to NPSpecies, Craters of the Moon National Monument contains:
- 4 N-sensitive tree species and 18 N-sensitive herbaceous species.
- 5 S-sensitive tree species and 16 S-sensitive herbaceous species.
Mycorrhizal fungi community response
Many plants have a symbiotic relationship with mycorrhizal fungi (MF). Through the roots, the plants supply the fungi with carbon from photosynthesis and in exchange the MF enhance nutrient availability within soils, increase drought tolerance, and provide physical resistance to soil erosion (George et al., 1995; Cheng et al., 2021; Burri et al., 2013). Anthropogenic Nitrogen (N) deposition can disrupt this symbiotic relationship resulting in a shift from N sensitive to N tolerant mycorrhizal fungi and plant communities.
With increased N deposition to the soil, MF become less important for nutrient uptake and many plants will cease the exchange of nutrients altogether making them more vulnerable to stressors such as drought (Lilleskov et al., 2019). The CL-N for the shift in mycorrhizal community is 5-6 kg-N ha-1 yr-1 in coniferous forests and 10-20 kg-N ha-1 yr-1 broadleaf forests.
Craters of the Moon National Monument has 11.2 km2 of coniferous forests, 0.1 km2 of broadleaf forests, and 0.2 km2 of mixed forests. Using the range in critical loads above, the minimum CL is exceeded in 0% of forested area and the maximum CL is exceeded in 0% of forested area based on 2019-2021 TDep Total N deposition.
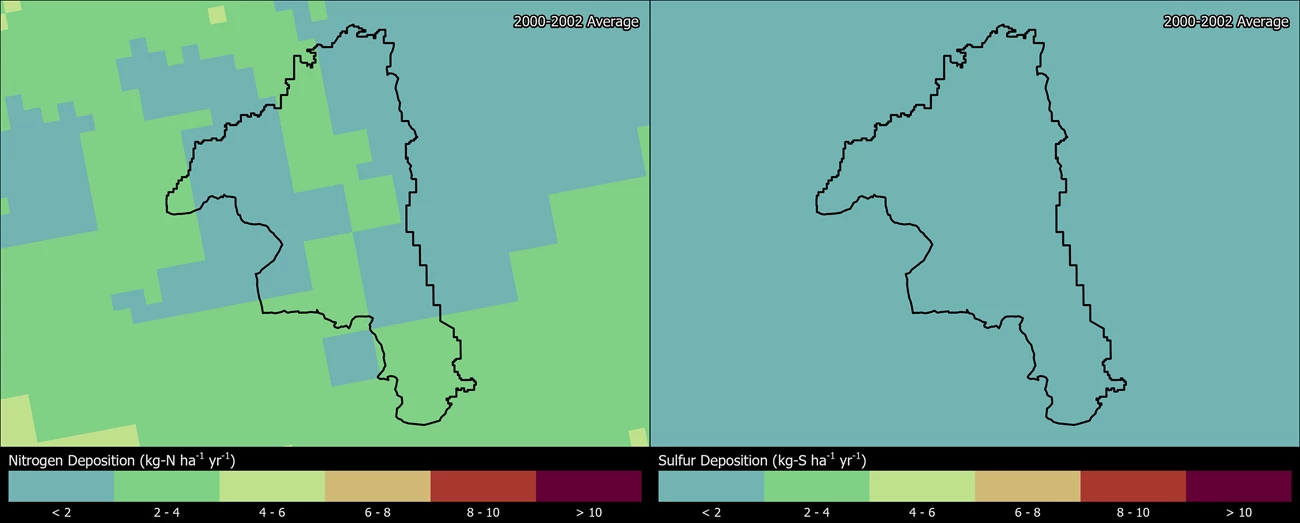
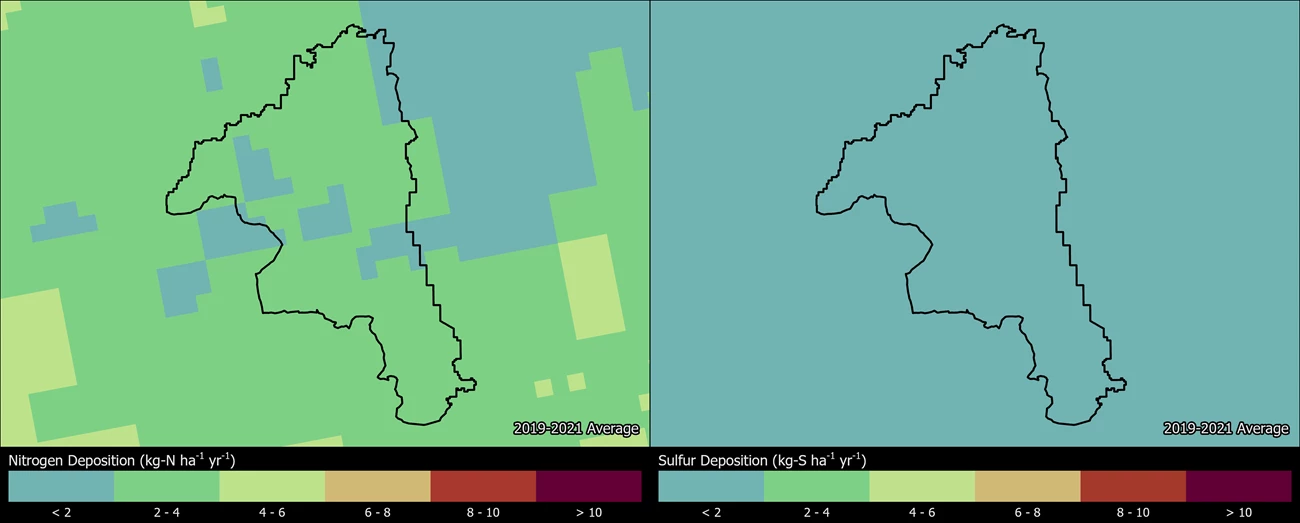
Change in N and S deposition from 2000 to 2021
The maps below show how the spatial distribution of estimated Total N and Total S deposition in CRMO has changed from 2000-2002 to 2019-2021 (TDep MMF version 2022.02). Slide the arrows in the middle of the image up and down to compare N and S deposition between the two years (Yearly Data).
- Minimum N deposition increased from 1.6 to 1.7 kg-N ha-1 yr-1 and maximum N deposition increased from 3.3 to 3.8 kg-N ha-1 yr-1.
- Minimum S deposition decreased from 0.4 to 0.3 kg-S ha-1 yr-1 and maximum S deposition remained at 0.5 kg-S ha-1 yr-1.
Persistent Pollutants
Pollutants like mercury and pesticides are concerning because they are persistent and toxic in the environment. These contaminants can travel in the air thousands of miles away from the source of pollution, even depositing in protected places like national parks. In addition, while some of these harmful pollutants may be banned from use, historically contaminated sites continue to endure negative environmental consequences.
When deposited, airborne mercury and other toxic air contaminants are known to harm wildlife like birds and fish, and cause human health concerns. Many of these substances enter the food chain and accumulate in the tissues of organisms causing reduced reproductive success, impaired growth and development, and decreased survival.
- Dragonfly larvae sampled at Craters of the Moon had mercury concentrations at moderate impairment levels. Dragonfly larvae have been sampled and analyzed for mercury from one site in the park; 100% of the data fall into the moderate (100-300 ng/g dw) impairment category for potential mercury risk. An index of moderate impairment or higher suggests some fish may exceed the US EPA benchmark for protection of human health (Eagles-Smith et al. 2020; Eagles-Smith et al. 2018). However, the data may not reflect the risk at other unsampled locations in the park.
- Microplastics, thought to be distributed by atmospheric transport, were found in precipitation samples taken from the park. Craters of the Moon NM is estimated to have an annual deposition rate of 7.7-8.8 metric tons of plastic per year (Brahney et al. 2020).
- Elevated mercury levels in snowpack were also found in samples near the park in Southeastern Idaho and the surrounding region (Ingersoll et al. 2011; Susong et al. 2003).
- Fish consumption advisories may be in effect for mercury and other contaminants (NPS 2022).
The NPS Air Resources Division reports on park conditions and trends for mercury. Visit the webpage to learn more.
Visibility

Many visitors come to Craters of the Moon NM & Pres to view a volcanic landscape of cinder cones, lava flows, and vents. Park vistas are sometimes obscured by haze, reducing how well and how far people can see. Visibility reducing haze is caused by tiny particles in the air, and these particles can also affect human health. Many of the same pollutants that ultimately fall out as nitrogen and sulfur deposition contribute to this haze. Organic compounds, soot, dust, and wood smoke reduce visibility as well. Significant improvements in park visibility on the clearest days have been documented since the 2000’s. Still, visibility in the park is a long way from the Clean Air Act goal of no human caused impairment.
Visibility effects:
- Reduced visibility, at times, due to human-caused haze and fine particles of air pollution, including dust;
- Reduction of the average natural visual range from about 160 miles (without pollution) to about 125 miles because of pollution at the park;
- Reduction of the visual range to below 70 miles on high pollution days.
Visit the NPS air quality conditions and trends website for park-specific visibility information. Craters of the Moon NM & Pres has been monitoring visibility since 2001. Explore air monitoring »
Ground-Level Ozone

At ground level, ozone is harmful to human health and the environment. Ground-level ozone does not come directly from smokestacks or vehicles, but instead is formed when other pollutants, mainly nitrogen oxides and volatile organic compounds, react in the presence of sunlight.
Over the course of a growing season, ozone can damage plant tissues making it harder for plants to grow and store carbon. Ozone causes leaf injuries like bleaching or dark spots on some sensitive plants. An ozone risk assessment concluded that plants in Craters of the Moon NM & Preserve were at low risk of foliar ozone injury as dry conditions during peak ozone concentrations are likely to limit ozone uptake by plants (Kohut 2007; Kohut 2004). However, plants growing in moist areas along streams and seeps can have higher ozone uptake and leaf injury (Kohut et al. 2012).There are four plants that may display ozone leaf injury at Craters of the Moon National Monument and Preserve. Search ozone-sensitive plant species found at Craters of the Moon National Monument & Preserve.
US Environmental Protection Agency and NPS found in ozone exposure experiments that ozone slowed tree seedling growth. NPS uses W126 values from averaged seedling responses in those experiments to describe park condition in terms of Vegetation Health. Ozone affects actively growing plants, so the W126 metric weights a sum of ozone concentrations during daylight hours over three months in the growing season.
A recent re-analysis of the seedling experiments established critical levels of ozone protective of each tree species tested (Lee et al. 2022). The ozone critical levels are W126 values that will prevent 5% or greater deficit in tree seedling biomass. Air Quality Conditions and Trends reports a 5-year average of W126 for each park. In 2018-2022, the average W126 value for Craters of the Moon National Monument & Preserve was 8.1 ppm-h. Based on this ozone level, trees present in the park (NPSpecies) are at low risk of ozone effects:
-
Tree species Douglas-fir (Pseudotsuga menziesii) and quaking aspen (Populous tremuloides) are at low risk from ozone despite their known sensitivity. Recent ozone levels in the park are below critical levels that protect these trees from 5% biomass deficit.
Ozone critical levels are for tree seedlings, which represent the regenerative capacity and long-term stability of sensitive species within a forest. These tree species are also known to be sensitive to ozone as adults (Bell et al. 2020), but critical values for seedling growth do not predict ozone effects on mature trees. Air Resources Division is currently working with collaborators to establish critical levels for mature trees using data from forest monitoring plots.
Visit the NPS air quality conditions and trends website for park-specific ozone information. Craters of the Moon NP & Preserve have been monitoring ozone levels since 1993.
Explore Other Park Air Profiles
There are 47 other Park Air Profiles covering parks across the United States and its territories.
References
Allen, E. B. 2013. Alien Invasion: Effects of Atmospheric Nitrogen Deposition on Sagebrush Steppe Vegetation Dynamics at Upper Columbia Basin Network Parks. NPS Annual Report: 2012, PMIS #144709.
Allen, E. B., L. E. Rao, R. J. Steers, A. Bytnerowicz, and M. E. Fenn. 2009. Impacts of atmospheric nitrogen deposition on vegetation and soils in Joshua Tree National Park. Pages 78–100 in R. H. Webb, L. F. Fenstermaker, J. S. Heaton, D. L. Hughson, E. V. McDonald, and D. M. Miller, editors. The Mojave Desert: ecosystem processes and sustainability. University of Nevada Press, Las Vegas, Nevada, USA.
Bell MD, Felker-Quinn E, Kohut R. 2020. Ozone sensitive plant species on National Park Service lands. Natural Resource Report. NPS/WASO/NRR—2020/2062. National Park Service. Fort Collins, Colorado. https://irma.nps.gov/DataStore/Reference/Profile/2271702
Brahney, J., M. Hallerud, E. Heim, M. Hahnenberger, and S. Sukumaran. 2020. Plastic rain in protected areas of the United States. Science 368(6496): 1257-1260. https://www.science.org/doi/10.1126/science.aaz5819
Brooks, M. L. 2003. Effects of increased soil nitrogen on the dominance of alien annual plants in the Mojave Desert. Journal of Applied Ecology. 40:344–353.
Burri, K., C. Gromke, and F. Graf. "Mycorrhizal fungi protect the soil from wind erosion: a wind tunnel study." Land Degradation & Development 24.4 (2013): 385-392.
Cheng, Shen, et al. "Elucidating the mechanisms underlying enhanced drought tolerance in plants mediated by arbuscular mycorrhizal fungi." Frontiers in Microbiology 12 (2021): 809473.
Clark, C.M., Simkin, S.M., Allen, E.B. et al. Potential vulnerability of 348 herbaceous species to atmospheric deposition of nitrogen and sulfur in the United States. Nat. Plants 5, 697–705 (2019). https://doi.org/10.1038/s41477-019-0442-8
Eagles-Smith, C.A., J.J. Willacker, S.J. Nelson, C.M. Flanagan Pritz, D.P. Krabbenhoft, C.Y. Chen, J.T. Ackerman, E.H. Campbell Grant, and D.S. Pilliod. 2020. Dragonflies as biosentinels of mercury availability in aquatic food webs of national parks throughout the United States. Environmental Science and Technology 54(14):8779-8790. https://doi.org/10.1021/acs.est.0c01255
Eagles-Smith, C.A., S.J. Nelson., C.M. Flanagan Pritz, J.J. Willacker Jr., and A. Klemmer. 2018. Total Mercury Concentrations in Dragonfly Larvae from U.S. National Parks (ver. 6.0, June 2021): U.S. Geological Survey data release. https://doi.org/10.5066/P9TK6NPT
Geiser, Linda & Nelson, Peter & Jovan, Sarah & Root, Heather & Clark, Christopher. (2019). Assessing Ecological Risks from Atmospheric Deposition of Nitrogen and Sulfur to US Forests Using Epiphytic Macrolichens. Diversity. 11. 87. 10.3390/d11060087.
Geiser, Linda & Root, Heather & Smith, Robert & Jovan, Sarah & Clair, Larry & Dillman, Karen. (2021). Lichen-based critical loads for deposition of nitrogen and sulfur in US forests. Environmental Pollution. 291. 118187. 10.1016/j.envpol.2021.118187.
George, Eckhard, Horst Marschner, and Iver Jakobsen. "Role of arbuscular mycorrhizal fungi in uptake of phosphorus and nitrogen from soil." Critical reviews in biotechnology 15.3-4 (1995): 257-270.
Horn KJ, Thomas RQ, Clark CM, Pardo LH, Fenn ME, Lawrence GB, et al. (2018) Growth and survival relationships of 71 tree species with nitrogen and sulfur deposition across the conterminous U.S.. PLoS ONE 13(10): e0205296. https://doi.org/10.1371/journal.pone.0205296
Ingersoll, G. P., M. A. Mast, J. M. Swank, C. D. Campbell. 2011. Rocky Mountain snowpack physical and chemical data for selected sites, 2010: U.S. Geological Survey Data Series 570, 12 p. Available at https://pubs.usgs.gov/ds/570/.
Kohut, B. 2004. Assessing the Risk of Foliar Injury from Ozone on Vegetation in Parks in the Upper Columbia Basin Network. Available at https://irma.nps.gov/DataStore/Reference/Profile/2181576.
Kohut, B., C. Flanagan, E. Porter, J. Cheatham. 2012. Foliar Ozone Injury on Cutleaf Coneflower at Rocky Mountain National Park, Colorado. Western North American Naturalist 72(1): 32–42.
Lee EH, Anderson CP, Beedlow PA, Tingey DT, Koike S, Dubois J, Kaylor SD, Novak K, Rice RB, Neufeld HS, Herrick JD. 2022. Ozone Exposure-Response Relationships Parametrized for Sixteen Tree Species with Varying Sensitivity in the United States. Atmospheric Environment. 284:1-16. https://irma.nps.gov/DataStore/Reference/Profile/2294221
Lilleskov, Erik A., et al. "Atmospheric nitrogen deposition impacts on the structure and function of forest mycorrhizal communities: a review." Environmental Pollution 246 (2019): 148-162.
McCoy K., M. D. Bell, and E. Felker-Quinn. 2021. Risk to epiphytic lichen communities in NPS units from atmospheric nitrogen and sulfur pollution: Changes in critical load exceedances from 2001‒2016. Natural Resource Report NPS/NRSS/ARD/NRR—2021/2299. National Park Service, Fort Collins, Colorado. https://doi.org/10.36967/nrr-2287254.
[NADP] National Atmospheric Deposition Program. 2018. NTN Data. Accessed January 20, 2022. Available at http://nadp.slh.wisc.edu/NADP/
[NPS] National Park Service. 2022. Fish Consumption Advisories. https://www.nps.gov/subjects/fishing/fish-consumption-advisories.htm
Porter, E., Blett, T., Potter, D.U., Huber, C. 2005. Protecting resources on federal lands: Implications of critical loads for atmospheric deposition of nitrogen and sulfur. BioScience 55(7): 603–612. https://doi.org/10.1641/0006-3568(2005)055[0603:PROFLI]2.0.CO;2
Schwinning, S., B. I. Starr, N. J. Wojcik, M. E. Miller, J. E. Ehleringer, R. L. Sanford. 2005. Effects of nitrogen deposition on an arid grassland in the Colorado plateau cold desert. Rangeland Ecology and Management. 58: 565–574.
Sullivan, T. J. 2016. Air quality related values (AQRVs) in national parks: Effects from ozone; visibility reducing particles; and atmospheric deposition of acids, nutrients and toxics. Natural Resource Report NPS/NRSS/ARD/NRR—2016/1196. National Park Service, Fort Collins, CO.
Susong, D. D., M. L. Abbott, D. P. Krabbenhoft. 2003. Mercury accumulation in snow on the Idaho National Engineering and Environmental Laboratory and surrounding region, southeast Idaho, USA. Environmental Geology 43: 357–363. https://irma.nps.gov/DataStore/Reference/Profile/573799
Tags
- craters of the moon national monument & preserve
- air
- air quality
- air pollution
- park air profiles
- craters of the moon national monument and preserve
- nitrogen deposition
- sulfur deposition
- enrichment
- acidification
- visibility
- mercury
- toxics
- ozone
- ground level ozone
- science
- research
- monitoring
- class i areas
Last updated: September 23, 2024