Part of a series of articles titled Park Air Profiles.
Article
Park Air Profiles - Big Bend National Park
Air Quality at Big Bend National Park
Most visitors expect clean air and clear views in parks. Big Bend National Park (NP), Texas, home to mountain, desert, and river environments, lies downwind of major pollution sources in eastern Texas, other U.S. states, and Mexico. The National Park Service works to address air pollution effects at Big Bend NP, and in parks across the U.S., through science, policy and planning, and by doing our part.
Nitrogen and Sulfur

Nitrogen (N) and sulfur (S) compounds deposited from the air may have harmful effects on ecosystem processes. Healthy ecosystems can naturally buffer a certain amount of pollution, but once a threshold is passed the ecosystem may respond negatively. This threshold is the critical load, or the amount of pollution above which harmful changes in sensitive ecosystems occur (Porter 2005). N and S deposition change ecosystems through eutrophication (N deposition) and acidification (N + S deposition). Eutrophication increases soil and water nutrients which causes some species to grow more quickly and changes community composition. Ecosystem sensitivity to nutrient N enrichment at Big Bend National Park (BIBE) relative to other national parks is very high (Sullivan et al. 2016); for a full list of N sensitive ecosystem components, see: NPS ARD 2019. Acidification leaches important cations from soils, lakes, ponds, and streams which decreases habitat quality. Ecosystem sensitivity to acidification at BIBE relative to other national parks is high (Sullivan et al. 2016); to search for acid-sensitive plant species, see: NPSpecies.
From 2017-2019 total N deposition in BIBE ranged from 3.0 to 5.0 kg-N ha-1 yr-1 and total S deposition ranged from 1.0 to 1.6 kg-S ha-1 yr-1 based on the TDep model (NADP, 2018). BIBE has been monitoring atmospheric N and S deposition since 1980, see the conditions and trends website for park-specific information.
Arid, upland areas in BIBE have shown variable response to excess N. The sparse native vegetation in the park is not adapted to higher N levels and may be displaced by invasive species like cheatgrass. Such non-native species can readily take up N and spread quickly. Research on cheatgrass response to N in this area has not been completed, but deposition is at a level that has increased grass cover in other parks. Surface waters at BIBE are likely to be well-buffered from acidification because of an abundance of base cations like calcium in the soils and rocks.
Additional N and S Research:
- A decrease in soil microbe diversity as nitrogen increases, evidenced by fertilization experiments in the high elevation oak and pine forest (Zak 2006)
- Increased fire risk in the park, as the interaction of climate change and increased nitrogen enhances vegetation coverage and provides fuel (Zak 2006)
- Higher concentrations of nitrates in grasslands soil samples and changing soil pH (Zak 2006)
Epiphytic macrolichen community responses
Epiphytic macrolichens grow on tree trunks, branches, and boles. Since these lichens grow above the ground, they obtain all their nutrients directly from precipitation and the air. Many epiphytic lichen species have narrow environmental niches and are extremely sensitive to changes in air pollution. Epiphytic lichen communities are less diverse in arid areas, but are still impacted by air pollution. Geiser et al. (2019) used a U.S. Forest Service national survey to develop critical loads of nitrogen (N) and critical loads of sulfur (S) to prevent more than a 20% decline in four lichen community metrics: total species richness, pollution sensitive species richness, forage lichen abundance, and cyanolichen abundance.
McCoy et al. (2021) used forested area from the National Land Cover Database to estimate the impact of air pollution on epiphytic lichen communities. Forested area makes up 54 km2 (1.6%) of the land area of Big Bend National Park.
- N deposition exceeded the 3.1 kg-N ha-1 yr-1 critical load to protect N-sensitive lichen species richness in 83.8% of the forested area.
- S deposition was below the 2.7 kg-S ha-1 yr-1 critical load to protect S-sensitive lichen species richness in every part of the forested area.
For exceedances of other lichen metrics and the predicted decline of lichen communities see Appendices A and B of McCoy et al. (2021).
Additional modeling was done on 459 lichen species to test the combined effects of air pollution and climate gradients (Geiser et al. 2021). A critical load indicative of initial shifts from pollution-sensitive toward pollution-tolerant species occurred at 1.5 kg-N ha-1 yr-1 and 2.7 kg-S ha-1 yr-1 even under changing climate regimes.
Plant species response
Plants vary in their tolerance of eutrophication and acidification, and some plant species respond to nitrogen (N) or sulfur (S) pollution with declines in growth, survival, or abundance on the landscape. Horn et al. (2018) used the U.S. Forest Service national forest survey to develop critical loads of N and critical loads of S to prevent declines in growth or survival of sensitive tree species. Clark et al. (2019) used a database of plant community surveys to develop critical loads of N and critical loads of S to prevent a decline in abundance of sensitive herbaceous plant species. According to NPSpecies, Big Bend National Park contains:
- 5 N-sensitive tree species and 11 N-sensitive herbaceous species.
- 6 S-sensitive tree species and 9 S-sensitive herbaceous species.
Mycorrhizal fungi community response
Many plants have a symbiotic relationship with mycorrhizal fungi (MF). Through the roots, the plants supply the fungi with carbon from photosynthesis and in exchange the MF enhance nutrient availability within soils, increase drought tolerance, and provide physical resistance to soil erosion (George et al., 1995; Cheng et al., 2021; Burri et al., 2013). Anthropogenic Nitrogen (N) deposition can disrupt this symbiotic relationship resulting in a shift from N sensitive to N tolerant mycorrhizal fungi and plant communities.
With increased N deposition to the soil, MF become less important for nutrient uptake and many plants will cease the exchange of nutrients altogether making them more vulnerable to stressors such as drought (Lilleskov et al., 2019). The CL-N for the shift in mycorrhizal community is 5-6 kg-N ha-1 yr-1 in coniferous forests and 10-20 kg-N ha-1 yr-1 broadleaf forests.
Big Bend National Park has 82.5 km2 of coniferous forests, 4.8 km2 of broadleaf forests. Using the range in critical loads above, the minimum CL is exceeded in 0% of forested area and the maximum CL is exceeded in 0% of forested area based on 2019-2021 TDep Total N deposition.
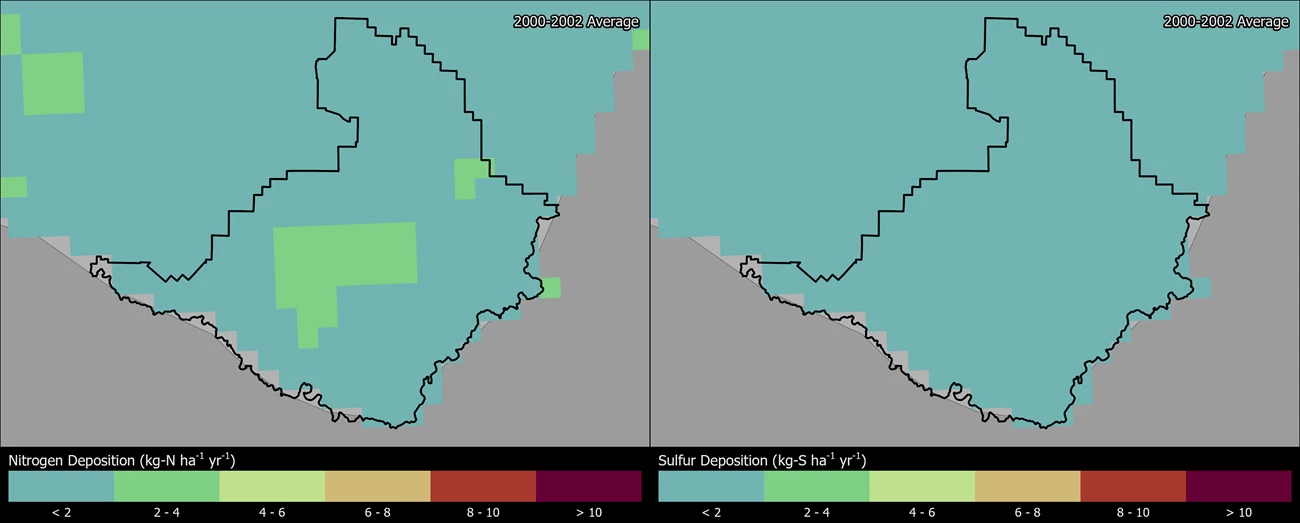
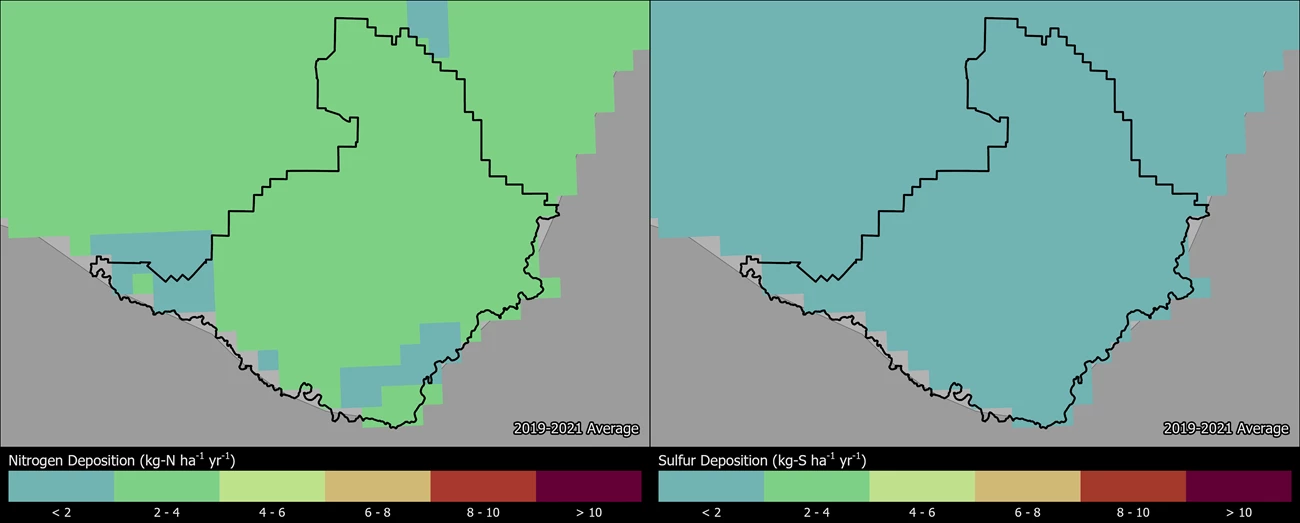
Change in N and S deposition from 2000 to 2021
The maps below show how the spatial distribution of estimated Total N and Total S deposition in BIBE has changed from 2000-2002 to 2019-2021 (TDep MMF version 2022.02). Slide the arrows in the middle of the image up and down to compare N and S deposition between the two years (Yearly Data).
- Minimum N deposition increased from 1.4 to 1.9 kg-N ha-1 yr-1 and maximum N deposition increased from 2.8 to 3.4 kg-N ha-1 yr-1.
- Minimum S deposition decreased from 0.9 to 0.8 kg-S ha-1 yr-1 and maximum S deposition decreased from 1.7 to 1.3 kg-S ha-1 yr-1.
Persistent Pollutants
Pollutants like mercury and pesticides are concerning because they are persistent and toxic in the environment. These contaminants can travel in the air thousands of miles away from the source of pollution, even depositing in protected places like national parks. In addition, while some of these harmful pollutants may be banned from use, historically contaminated sites continue to endure negative environmental consequences.
When deposited, airborne mercury and other toxic air contaminants are known to harm wildlife like birds and fish, and cause human health concerns. Many of these substances enter the food chain and accumulate in the tissue of organisms causing reduced reproductive success, impaired growth and development, and decreased survival.
- Some dragonfly larvae sampled at Big Bend NP had mercury concentrations at moderate or higher impairment levels. Dragonfly larvae have been sampled and analyzed for mercury from five sites in the park; 57% of the data fall into the moderate (100-300 ng/g dw) and 29% fall into the high (300-700 ng/g dw) impairment categories for potential mercury risk. An index of moderate impairment or higher suggests some fish may exceed the US EPA benchmark for protection of human health (Eagles-Smith et al. 2020; Eagles-Smith et al. 2018). However, the data may not reflect the risk at other unsampled locations in the park.
- Mercury and other toxic contaminants were found in park air, vegetation, and birds. Elevated concentrations of current-use pesticides (chlorpyrifos, endosulfans, dacthal, and lindane) were found in vegetation (Landers et al. 2010; Landers et al. 2008). Dioxins, PCBs, and related compounds were found in park air samples, which could harm wildlife in the park (Cleverly et al. 2000). High levels of DDE (a breakdown product of DDT) and mercury were found in birds of prey, such as peregrine falcons, which may correspond to impaired peregrine falcon reproduction (Mora et al. 2002). Fish consumption advisories may be in effect for mercury and other contaminants (NPS 2022).
The NPS Air Resources Division reports on park conditions and trends for mercury. Visit the webpage to learn more.
Visibility

Many visitors come to Big Bend NP to enjoy panoramic vistas of the ribbon-like Rio Grande, or seemingly endless miles of Chihuahuan Desert. Unfortunately, park vistas are often obscured by haze, reducing how well and how far people can see. Visibility reducing haze is caused by tiny particles in the air, and these particles can also affect human health. Many of the same pollutants that ultimately fall out as nitrogen and sulfur deposition contribute to this haze. Organic compounds, soot, and dust reduce visibility as well.
The NPS and the Environmental Protection Agency (EPA) conducted the Big Bend Regional Aerosol and Visibility Observational (BRAVO) study to explore haze in the park (NPS 2004; BRAVO). The BRAVO study found that sulfate particles are the single largest contributor to haze in the park. Sulfate emission sources include coal-fired power plants, metal smelters, refineries, other industrial sources, and volcanoes. Emission sources from eastern Texas and eastern states in the U.S. on average contribute 55% to the haziest days at Big Bend NP (Pitchford et al. 2004). Federal regulations that reduce sulfur dioxide emissions should make progress toward improving visibility at the park. Sources in Mexico were also shown to contribute to visibility impairment at Big Bend NP, and partnerships between agencies in Mexico and the U.S., such as Border 2020, have been established to address the transport of pollution.
Significant improvements in park visibility on clearest days have been documented since the late 1980’s. There is no significant trend on haziest days over the same time period and visibility in the park remains a long way from the Clean Air Act goal of no human caused impairment.
Visibility effects:
- Reduction of the average natural visual range from about 165 miles (without the effects of pollution) to about 90 miles because of pollution at the park
- Reduction of the visual range from about 120 miles to below 55 miles on high pollution days
Visit the NPS air quality conditions and trends website for park-specific visibility information. Big Bend NP has been monitoring visibility since 1988. Check out the live air quality webcam and explore air monitoring »
Ground-Level Ozone

At ground level, ozone is harmful to human health and the environment. Ground-level ozone does not come directly from smokestacks or vehicles, but instead is formed when other pollutants, mainly nitrogen oxides and volatile organic compounds, react in the presence of sunlight.
Over the course of a growing season, ozone can damage plant tissues making it harder for plants to grow and store carbon. Ozone causes leaf injuries like bleaching or dark spots on some sensitive plants. There are 3 plants that may display ozone leaf injury at Big Bend National Park. Search ozone-sensitive plant species found at Big Bend National Park.
US Environmental Protection Agency and NPS found in ozone exposure experiments that ozone slowed tree seedling growth. NPS uses W126 values from averaged seedling responses in those experiments to describe park condition in terms of Vegetation Health. Ozone affects actively growing plants, so the W126 metric weights a sum of ozone concentrations during daylight hours over three months in the growing season.
A recent re-analysis of the seedling experiments established critical levels of ozone protective of each tree species tested (Lee et al. 2022). The ozone critical levels are W126 values that will prevent 5% or greater deficit in tree seedling biomass. Air Quality Conditions and Trends reports a 5-year average of W126 for each park. In 2018-2022, the average W126 value for Big Bend National Park was 6.6 ppm-h. Based on this ozone level, trees present in the park (NPSpecies) are at risk of the following ozone effects:
-
The tree species black cherry (Prunus serotina), with an ozone critical level of 2.5 ppm-h, is at risk of 13% biomass deficit in seedlings. Recent ozone levels in the park exceed critical levels that protect this species.
-
Tree species Douglas-fir (Pseudotsuga menziesii) and quaking aspen (Populus tremuloides) are at low risk from ozone despite their known sensitivity. Recent ozone levels in the park are below critical levels that protect these trees from 5% biomass deficit.
Ozone critical levels are for tree seedlings, which represent the regenerative capacity and long-term stability of sensitive species within a forest. These tree species are also known to be sensitive to ozone as adults (Bell et al. 2020), but critical values for seedling growth do not predict ozone effects on mature trees. Air Resources Division is currently working with collaborators to establish critical levels for mature trees using data from forest monitoring plots.
Visit the NPS air quality conditions and trends website for park-specific ozone information. Big Bend NP has been monitoring ozone since 1990. View live ozone and meteorology data.
Explore Other Park Air Profiles
There are 47 other Park Air Profiles covering parks across the United States and its territories.
References
Bell MD, Felker-Quinn E, Kohut R. 2020. Ozone sensitive plant species on National Park Service lands. Natural Resource Report. NPS/WASO/NRR—2020/2062. National Park Service. Fort Collins, Colorado. https://irma.nps.gov/DataStore/Reference/Profile/2271702
Burri, K., C. Gromke, and F. Graf. "Mycorrhizal fungi protect the soil from wind erosion: a wind tunnel study." Land Degradation & Development 24.4 (2013): 385-392.
Cheng, Shen, et al. "Elucidating the mechanisms underlying enhanced drought tolerance in plants mediated by arbuscular mycorrhizal fungi." Frontiers in Microbiology 12 (2021): 809473.
Clark, C.M., Simkin, S.M., Allen, E.B. et al. Potential vulnerability of 348 herbaceous species to atmospheric deposition of nitrogen and sulfur in the United States. Nat. Plants 5, 697–705 (2019). https://doi.org/10.1038/s41477-019-0442-8
Cleverly, D. H., D. Winters, J. Ferrario, J. Schaum, G. Schweer, J. Buchert, C. Greene, A. Dupuy, C. Byrne. 2000. The National Dioxin Air Monitoring Network (NDAMN): Results of the First Year of Atmospheric Measurements of CDDs, CDFs, and Dioxin-Like PCBs in Rural and Agricultural Areas of the United States: June 1998–June 1999. Presented at Dioxin ’00, 20th International Symposium on Halogenated Environmental Organic Pollutants & POPS, held Aug 13–17 at Monterey, CA. Short paper in, Organohalogen Compounds 45: 248–251.
Eagles-Smith, C.A., S.J. Nelson., C.M. Flanagan Pritz, J.J. Willacker Jr., and A. Klemmer. 2018. Total Mercury Concentrations in Dragonfly Larvae from U.S. National Parks (ver. 6.0, June 2021): U.S. Geological Survey data release. https://doi.org/10.5066/P9TK6NPT
Eagles-Smith, C.A., J.J. Willacker, S.J. Nelson, C.M. Flanagan Pritz, D.P. Krabbenhoft, C.Y. Chen, J.T. Ackerman, E.H. Campbell Grant, and D.S. Pilliod. 2020. Dragonflies as biosentinels of mercury availability in aquatic food webs of national parks throughout the United States. Environmental Science and Technology 54(14):8779-8790. https://doi.org/10.1021/acs.est.0c01255
Geiser, Linda & Nelson, Peter & Jovan, Sarah & Root, Heather & Clark, Christopher. (2019). Assessing Ecological Risks from Atmospheric Deposition of Nitrogen and Sulfur to US Forests Using Epiphytic Macrolichens. Diversity. 11. 87. 10.3390/d11060087.
Geiser, Linda & Root, Heather & Smith, Robert & Jovan, Sarah & Clair, Larry & Dillman, Karen. (2021). Lichen-based critical loads for deposition of nitrogen and sulfur in US forests. Environmental Pollution. 291. 118187. 10.1016/j.envpol.2021.118187.
George, Eckhard, Horst Marschner, and Iver Jakobsen. "Role of arbuscular mycorrhizal fungi in uptake of phosphorus and nitrogen from soil." Critical reviews in biotechnology 15.3-4 (1995): 257-270.
Horn KJ, Thomas RQ, Clark CM, Pardo LH, Fenn ME, Lawrence GB, et al. (2018) Growth and survival relationships of 71 tree species with nitrogen and sulfur deposition across the conterminous U.S.. PLoS ONE 13(10): e0205296. https://doi.org/10.1371/journal.pone.0205296
Landers, D. H., S. L. Simonich, D. A. Jaffe, L. H. Geiser, D. H. Campbell, A. R. Schwindt, C. B. Schreck, M. L. Kent, W. D. Hafner, H. E. Taylor, K. J. Hageman, S. Usenko, L. K. Ackerman, J. E. Schrlau, N. L. Rose, T. F. Blett, and M. M. Erway. 2008. The Fate, Transport, and Ecological Impacts of Airborne Contaminants in Western National Parks (USA). EPA/600/R—07/138. U.S. Environmental Protection Agency, Office of Research and Development, NHEERL, Western Ecology Division, Corvallis, Oregon. Available at https://irma.nps.gov/DataStore/Reference/Profile/660829.
Landers, D. H., Simonich, S. M., Jaffe, D., Geiser, L., Campbell, D. H., Schwindt, A., Schreck, C., Kent, M., Hafner, W., Taylor, H. E., Hageman, K., Usenko, S., Ackerman, L., Schrlau, J., Rose, N., Blett, T., Erway, M. M. 2010. The Western Airborne Contaminant Assessment Project (WACAP): An Interdisciplinary Evaluation of the Impacts of Airborne Contaminants in Western U.S. National Parks. Environmental Science and Technology 44: 855–859. Available at https://pubs.acs.org/doi/10.1021/es901866e
Lee EH, Anderson CP, Beedlow PA, Tingey DT, Koike S, Dubois J, Kaylor SD, Novak K, Rice RB, Neufeld HS, Herrick JD. 2022. Ozone Exposure-Response Relationships Parametrized for Sixteen Tree Species with Varying Sensitivity in the United States. Atmospheric Environment. 284:1-16. https://irma.nps.gov/DataStore/Reference/Profile/2294221
Lilleskov, Erik A., et al. "Atmospheric nitrogen deposition impacts on the structure and function of forest mycorrhizal communities: a review." Environmental Pollution 246 (2019): 148-162.
McCoy K., M. D. Bell, and E. Felker-Quinn. 2021. Risk to epiphytic lichen communities in NPS units from atmospheric nitrogen and sulfur pollution: Changes in critical load exceedances from 2001‒2016. Natural Resource Report NPS/NRSS/ARD/NRR—2021/2299. National Park Service, Fort Collins, Colorado. https://doi.org/10.36967/nrr-2287254.
Mora, M., Skiles, R., McKinney, B., Paredes, M., Buckler, D., Papoulias, D., Klein, D. 2002. Environmental contaminants in prey and tissues of the peregrine falcon in the Big Bend Region, Texas, USA. Environ Pollut. 116 (1): 169–176. https://irma.nps.gov/DataStore/Reference/Profile/664091
[NADP] National Atmospheric Deposition Program. 2018. NTN Data. Accessed January 20, 2022. Available at http://nadp.slh.wisc.edu/NADP/
[NPS] National Park Service. 2022. Fish Consumption Advisories. https://www.nps.gov/subjects/fishing/fish-consumption-advisories.htm
[NPS] National Park Service. 2004. Understanding Haze in Big Bend National Park—Big Bend Regional Aerosol and Visibility Observational (BRAVO) Study. Fact sheet. Available at http://vista.cira.colostate.edu/Improve/big-bend-regional-aerosol-and-visibility-observational-bravo/
Pitchford, M. L., Tombach, I., Barna, M., Gebhart, K. A., Green, M. C., Knipping, E., Kumar, N., Malm, W. C., Pun, B., Schichtel, B. A., Seigneur, C. 2004. Big Bend Regional Aerosol and Visibility Observational Study Final Report. Available at http://vista.cira.colostate.edu/Improve/final-report-bravo/
Porter, E., Blett, T., Potter, D.U., Huber, C. 2005. Protecting resources on federal lands: Implications of critical loads for atmospheric deposition of nitrogen and sulfur. BioScience 55(7): 603–612. https://doi.org/10.1641/0006-3568(2005)055[0603:PROFLI]2.0.CO;2
Sullivan, T. J. 2016. Air quality related values (AQRVs) in national parks: Effects from ozone; visibility reducing particles; and atmospheric deposition of acids, nutrients and toxics. Natural Resource Report NPS/NRSS/ARD/NRR—2016/1196. National Park Service, Fort Collins, CO.
Zak, J. 2006. Impacts of Atmospheric Nitrogen Deposition and Climate Change on Desert Ecosystems. Big Bend National Park. NPS Final Report. 15 pp.
Last updated: September 6, 2024