Part of a series of articles titled Park Air Profiles.
Article
Park Air Profiles - Arches National Park

Air Quality at Arches National Park
Most visitors expect clean air and clear views in parks. Arches National Park (NP), Utah, a red rock wonderland known for sandstone arches, soaring pinnacles, massive fins, and balanced rocks, has moderately good air quality. Upwind emissions from disturbed dry lands, oil and gas development, and regional wildfires, as well as urban and industrial sources contribute to air pollution in the park. Airborne pollutants can harm the park’s natural and scenic resources such as soils, vegetation, and visibility. The National Park Service works to address air pollution effects at Arches NP, and in parks across the U.S., through science, policy and planning, and by doing our part. Air quality studies and monitoring programs at Arches NP focus on dust emissions and effects of nitrogen deposition on soil, nutrient cycling, and vegetation.
Nitrogen and Sulfur

Nitrogen (N) and sulfur (S) compounds deposited from the air may have harmful effects on ecosystem processes. Healthy ecosystems can naturally buffer a certain amount of pollution, but once a threshold is passed the ecosystem may respond negatively. This threshold is the critical load, or the amount of pollution above which harmful changes in sensitive ecosystems occur (Porter 2005). N and S deposition changes ecosystems through eutrophication (N deposition) and acidification (N + S deposition). Eutrophication increases soil and water nutrients which causes some species to grow more quickly and change community composition. Ecosystem sensitivity to nutrient N enrichment at Arches National Park (ARCH) relative to other national parks is very high (Sullivan et al. 2016); for a full list of N sensitive ecosystem components, see: NPS ARD 2019. Acidification leaches important cations from soils, lakes, ponds, and streams which decreases habitat quality. Ecosystem sensitivity to acidification at ARCH relative to other national parks is moderate (Sullivan et al. 2016); to search for acid-sensitive plant species, see: NPSpecies.
From 2017-2019 total N deposition in ARCH ranged from 2.2 to 2.5 kg-N ha-1 yr-1 and total S deposition ranged from 0.6 to 0.7 kg-S ha-1 yr-1 based on the TDep model (NADP, 2018). See the conditions and trends website for park-specific information on N and S deposition at ARCH.
Arid ecosystems found in ARCH have shown variable responses to excess N. Research conducted near ARCH found that experimental N additions resulted in unexpected large increases in the growth of invasive exotic Russian thistle, also known as tumbleweed (Schwinning et al. 2005). This finding is similar to results of research conducted in the Mojave Desert, where N deposition has been found to promote the spread of fast-growing exotic annual grasses such as red brome (Brooks 2003, Allen et al. 2009). In contrast, a recent study showed little vegetation response to fertilization, but did see a decline in the stability of the soil crust community (Phillips et al. 2021).
Surface waters in ARCH are generally well-buffered from acidification, although the park's small pothole aquatic systems may be sensitive to acidic inputs. Additionally, small streams with steep-sided canyon walls in the park have little ability to retain nutrients and water, offering the landscape limited opportunity to buffer potentially acidic run-off (Sullivan et al. 2016).
Epiphytic macrolichen community responses
Epiphytic macrolichens grow on tree trunks, branches, and boles. Since these lichens grow above the ground, they obtain all their nutrients directly from precipitation and the air. Many epiphytic lichen species have narrow environmental niches and are extremely sensitive to changes in air pollution. Epiphytic lichen communities are less diverse in arid areas, but are still impacted by air pollution. Geiser et al. (2019) used a U.S. Forest Service national survey to develop critical loads of nitrogen (N) and critical loads of sulfur (S) to prevent more than a 20% decline in four lichen community metrics: total species richness, pollution sensitive species richness, forage lichen abundance, and cyanolichen abundance.
McCoy et al. (2021) used forested area from the National Land Cover Database to estimate the impact of air pollution on epiphytic lichen communities. Forested area makes up 3.3 km2 (1.1%) of the land area of Arches National Park.
- N deposition was below the 3.1 kg-N ha-1 yr-1 critical load to protect N-sensitive lichen species richness in every part of the forested area.
- S deposition was below the 2.7 kg-S ha-1 yr-1 critical load to protect S-sensitive lichen species richness in every part of the forested area.
For exceedances of other lichen metrics and the predicted decline of lichen communities see Appendices A and B of McCoy et al. (2021).
Additional modeling was done on 459 lichen species to test the combined effects of air pollution and climate gradients (Geiser et al. 2021). A critical load indicative of initial shifts from pollution-sensitive toward pollution-tolerant species occurred at 1.5 kg-N ha-1 yr-1 and 2.7 kg-S ha-1 yr-1 even under changing climate regimes.
Plant species response
Plants vary in their tolerance of eutrophication and acidification, and some plant species respond to nitrogen (N) or sulfur (S) pollution with declines in growth, survival, or abundance on the landscape. Horn et al. (2018) used the U.S. Forest Service national forest survey to develop critical loads of N and critical loads of S to prevent declines in growth or survival of sensitive tree species. Clark et al. (2019) used a database of plant community surveys to develop critical loads of N and critical loads of S to prevent a decline in abundance of sensitive herbaceous plant species. According to NPSpecies, Arches National Park contains:
- 2 N-sensitive tree species and 10 N-sensitive herbaceous species.
- 4 S-sensitive tree species and 12 S-sensitive herbaceous species.
Mycorrhizal fungi community response
Many plants have a symbiotic relationship with mycorrhizal fungi (MF). Through the roots, the plants supply the fungi with carbon from photosynthesis and in exchange the MF enhance nutrient availability within soils, increase drought tolerance, and provide physical resistance to soil erosion (George et al., 1995; Cheng et al., 2021; Burri et al., 2013). Anthropogenic Nitrogen (N) deposition can disrupt this symbiotic relationship resulting in a shift from N sensitive to N tolerant mycorrhizal fungi and plant communities.
With increased N deposition to the soil, MF become less important for nutrient uptake and many plants will cease the exchange of nutrients altogether making them more vulnerable to stressors such as drought (Lilleskov et al., 2019). The CL-N for the shift in mycorrhizal community is 5-6 kg-N ha-1 yr-1 in coniferous forests and 10-20 kg-N ha-1 yr-1 broadleaf forests.
Arches National Park has 17.9 km2 of coniferous forests. Using the range in critical loads above, the minimum CL is exceeded in 0% of forested area and the maximum CL is exceeded in 0% of forested area based on 2019-2021 TDep Total N deposition.
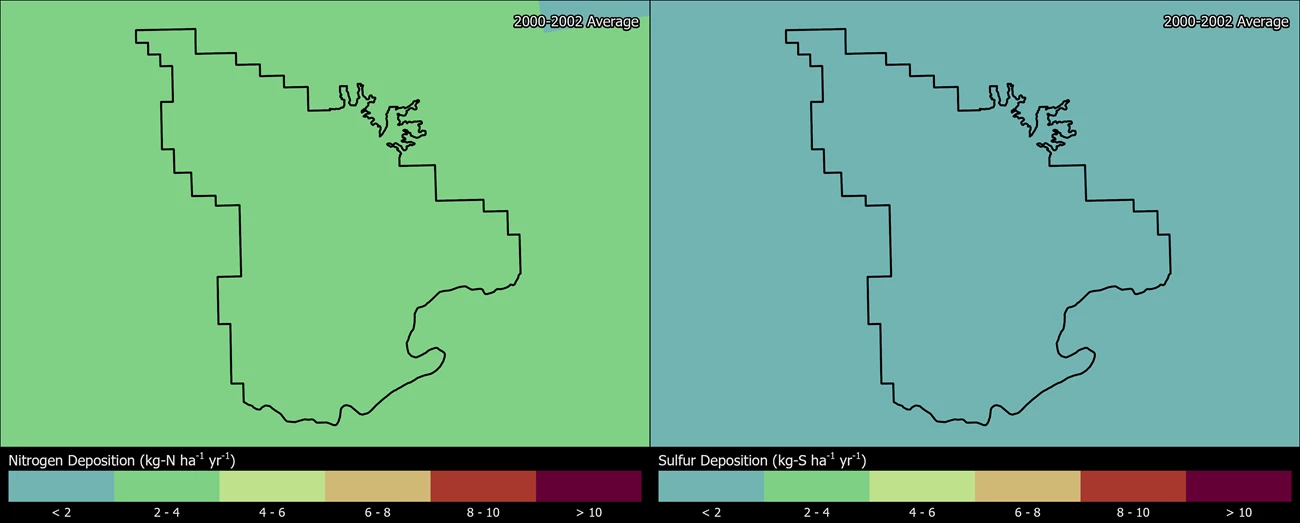
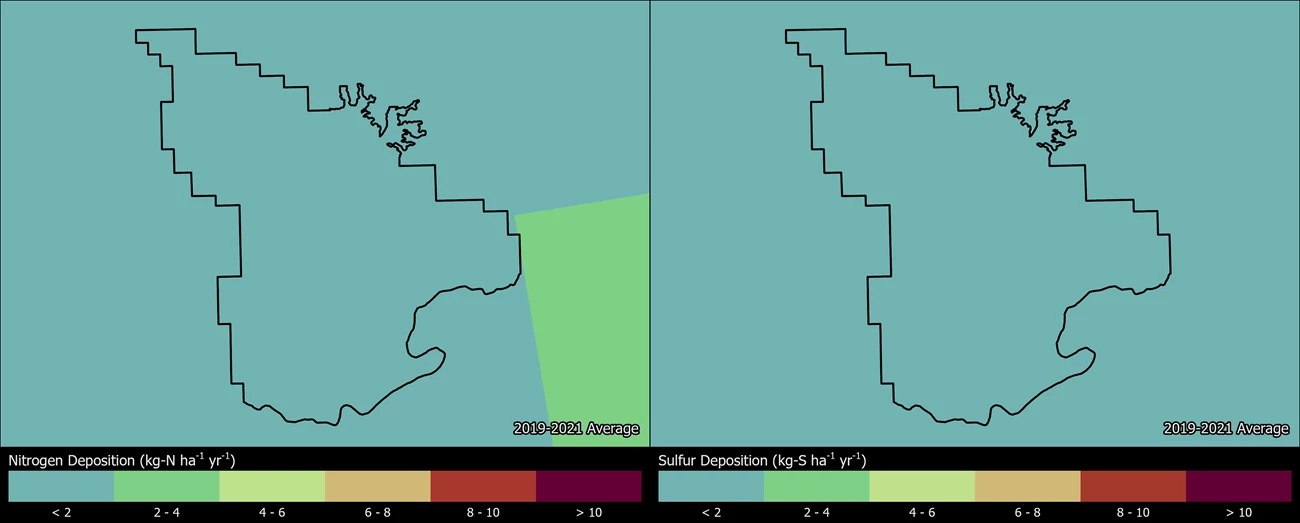
Change in N and S deposition from 2000 to 2021
The maps below show how the spatial distribution of estimated Total N and Total S deposition in ARCH has changed from 2000-2002 to 2019-2021 (TDep MMF version 2022.02). Slide the arrows in the middle of the image up and down to compare N and S deposition between the two years (Yearly Data).
- Minimum N deposition decreased from 2.2 to 1.7 kg-N ha-1 yr-1 and maximum N deposition decreased from 2.5 to 1.9 kg-N ha-1 yr-1.
- Minimum S deposition decreased from 0.7 to 0.3 kg-S ha-1 yr-1 and maximum S deposition decreased from 0.8 to 0.4 kg-S ha-1 yr-1.
Persistent Pollutants
Pollutants like mercury and pesticides are concerning because they are persistent and toxic in the environment. These contaminants can travel in the air thousands of miles away from the source of pollution, even depositing in protected places like national parks. In addition, while some of these harmful pollutants may be banned from use, historically contaminated sites continue to endure negative environmental consequences.
When deposited, airborne mercury and other toxic air contaminants are known to harm wildlife like birds and fish, and cause human health concerns. Many of these substances enter the food chain and accumulate in the tissue of organisms causing reduced reproductive success, impaired growth and development, and decreased survival.
- Dragonfly larvae sampled at Arches NP had mercury concentrations at moderate impairment levels. Dragonfly larvae have been sampled and analyzed for mercury from one site in the park; 100% of the data fall into the moderate (100-300 ng/g dw) impairment category for potential mercury risk. An index of moderate impairment or higher suggests some fish may exceed the US EPA benchmark for protection of human health (Eagles-Smith et al. 2020; Eagles-Smith et al. 2018). However, the data may not reflect the risk at other unsampled locations in the park.
- Contaminants of emerging concern (CECs), some of which are known toxins and thought to be atmospherically transported, have been found in park surface water and sediment samples. CECs include pharmaceuticals and personal care products (PPCPs), wastewater indicators (WWIs), and pesticides. CECs consistently found in/near Arches NP include triclopyr (a pesticide) at Lower Courthouse, p-cresol (used in the production of other chemicals) at Upper Courthouse, and indole (a fecal indicator) at Sleepy Hollow Spring (Northern Colorado Plateau Inventory and Monitoring Program 2018; Weissinger et al. 2018; Weissinger et al. 2016).
-
Fish consumption advisories may be in effect for mercury and other contaminants (NPS 2022).
The NPS Air Resources Division reports on park conditions and trends for mercury. Visit the webpage to learn more.
Visibility
Park vistas are sometimes obscured by haze that limits how well and how far people can see. Visitors come to Arches NP to see and enjoy gigantic arches, natural bridges, windows, spires, balanced rocks, and other unique geologic features. Because of the park’s geographic setting, visitors experience these spectacular features as foreground elements of expansive scenic views that often extend far beyond the park to distant canyons, cliffs, and mountains. Visibility reducing haze is caused by tiny particles in the air, and these particles can also affect human health. Many of the same pollutants that ultimately fall out as nitrogen and sulfur deposition contribute to haze. Organic compounds, soot, and dust reduce visibility as well.
Arid environments, including most of the Colorado Plateau region surrounding Arches NP, often experience dust emissions due to long-term aridity, sparse plant cover, and sensitive soil surfaces (Neff et al. 2013). Soil disturbances and severe wind episodes can increase dust concentrations but vary greatly in both space and time (Flagg et al. 2014). The U.S. Geological Survey (USGS) is currently monitoring patterns of dust emissions within and outside the park to more thoroughly understand background emission levels, seasonal dynamics, and other factors that may influence timing and levels of dust in the air. USGS scientists are using field, laboratory, and statistical modeling methods to carry out this work. A related research project is measuring the effect of vehicle-use and surface conditions on unpaved roads on dust emissions in and around Arches NP.
Visibility effects:
- Reduction of the average natural visual range from about 170 miles (without pollution) to about 130 miles because of pollution at the park
- Reduction of the visual range to below 90 miles on high pollution days
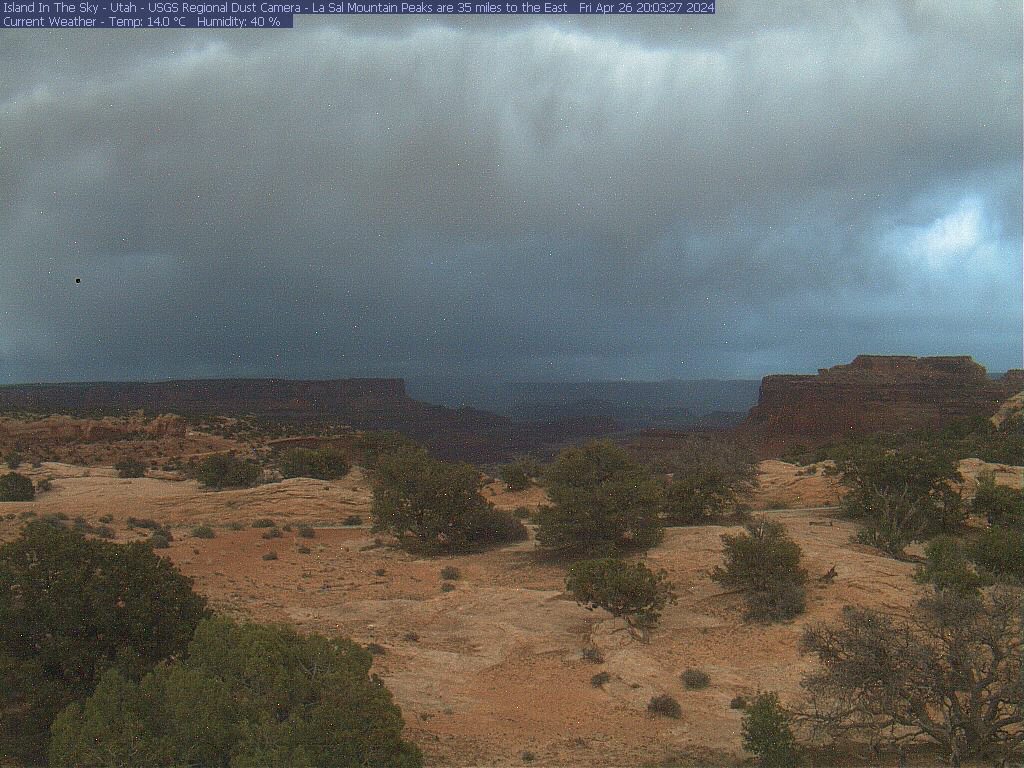
Explore a scenic view of the region through a dust monitoring webcam at nearby Canyonlands National Park. Visit the NPS air quality conditions and trends website for park-specific visibility information.
Ground-Level ozone
At ground level, ozone is harmful to human health and the environment. Ground-level ozone does not come directly from smokestacks or vehicles, but instead is formed when other pollutants, mainly nitrogen oxides and volatile organic compounds, react in the presence of sunlight.
Over the course of a growing season, ozone can damage plant tissues making it harder for plants to grow and store carbon. Ozone causes leaf injuries like bleaching or dark spots on some sensitive plants. An ozone risk assessment concluded that plants in Arches NP were at low risk of foliar ozone injury as dry conditions during peak ozone concentrations are likely to limit ozone uptake by plants (Kohut 2007; Kohut 2004). However, plants growing in moist areas along streams and seeps can have higher ozone uptake and leaf injury (Kohut et al. 2012). There is one confirmed bioindicator species, fragrant sumac (Rhus aromatica), that may display ozone leaf injury at Arches National Park (Bell et al. 2020). Surveys conducted in the park in 2019 did not find any ozone leaf injury on fragrant sumac (Winkler 2019).
US Environmental Protection Agency and NPS found in ozone exposure experiments that ozone slowed tree seedling growth. NPS uses W126 values from averaged seedling responses in those experiments to describe park condition in terms of Vegetation Health. Ozone affects actively growing plants, so the W126 metric weights a sum of ozone concentrations during daylight hours over three months in the growing season.
Air Quality Conditions and Trends reports a 5-year average of W126 for each park. In 2018-2022, the average W126 value for Arches National Park was 11.3 ppm-h. These recent ozone W126 levels risk 2-4% annual biomass deficits in ozone-sensitive tree seedlings (see ARD Vegetation Health).
Visit the NPS air quality conditions and trends website for park-specific ozone information.
.
Explore Other Park Air Profiles
There are 47 other Park Air Profiles covering parks across the United States and its territories.
References
Allen, E. B., L. E. Rao, R. J. Steers, A. Bytnerowicz, and M. E. Fenn. 2009. Impacts of atmospheric nitrogen deposition on vegetation and soils in Joshua Tree National Park. Pages 78–100 in R. H. Webb, L. F. Fenstermaker, J. S. Heaton, D. L. Hughson, E. V. McDonald, and D. M. Miller, editors. The Mojave Desert: ecosystem processes and sustainability. University of Nevada Press, Las Vegas, Nevada, USA.
Bell MD, Felker-Quinn E, Kohut R. 2020. Ozone sensitive plant species on National Park Service lands. Natural Resource Report. NPS/WASO/NRR—2020/2062. National Park Service. Fort Collins, Colorado. https://irma.nps.gov/DataStore/Reference/Profile/2271702
Binkley et al. 1997. Status of Air Quality and Related Values in Class I National Parks and Monuments of the Colorado Plateau. Chapter 3. Arches National Park. National Park Service, Air Resources Division, Denver, CO. Available at https://irma.nps.gov/DataStore/Reference/Profile/585485
Brooks, M.L. 2003. Effects of increased soil nitrogen on the dominance of alien annual plants in the Mojave Desert. Journal of Applied Ecology. 40:344–353.
Burri, K., C. Gromke, and F. Graf. "Mycorrhizal fungi protect the soil from wind erosion: a wind tunnel study." Land Degradation & Development 24.4 (2013): 385-392.
Cheng, Shen, et al. "Elucidating the mechanisms underlying enhanced drought tolerance in plants mediated by arbuscular mycorrhizal fungi." Frontiers in Microbiology 12 (2021): 809473.
Clark, C.M., Simkin, S.M., Allen, E.B. et al. Potential vulnerability of 348 herbaceous species to atmospheric deposition of nitrogen and sulfur in the United States. Nat. Plants 5, 697–705 (2019). https://doi.org/10.1038/s41477-019-0442-8
Eagles-Smith, C.A., S.J. Nelson., C.M. Flanagan Pritz, J.J. Willacker Jr., and A. Klemmer. 2018. Total Mercury Concentrations in Dragonfly Larvae from U.S. National Parks (ver. 6.0, June 2021): U.S. Geological Survey data release. https://doi.org/10.5066/P9TK6NPT
Eagles-Smith, C.A., J.J. Willacker, S.J. Nelson, C.M. Flanagan Pritz, D.P. Krabbenhoft, C.Y. Chen, J.T. Ackerman, E.H. Campbell Grant, and D.S. Pilliod. 2020. Dragonflies as biosentinels of mercury availability in aquatic food webs of national parks throughout the United States. Environmental Science and Technology 54(14):8779-8790. https://doi.org/10.1021/acs.est.0c01255
Flagg, C. B., J. C. Neff, R. L. Reynolds, and J. Belnap. 2014. Spatial and temporal patterns of dust emissions (2004–2012) in semi-arid landscapes, southeastern Utah, USA. Aeolian Research. 15:31-43.
Geiser, Linda & Nelson, Peter & Jovan, Sarah & Root, Heather & Clark, Christopher. (2019). Assessing Ecological Risks from Atmospheric Deposition of Nitrogen and Sulfur to US Forests Using Epiphytic Macrolichens. Diversity. 11. 87. 10.3390/d11060087.
Geiser, Linda & Root, Heather & Smith, Robert & Jovan, Sarah & Clair, Larry & Dillman, Karen. (2021). Lichen-based critical loads for deposition of nitrogen and sulfur in US forests. Environmental Pollution. 291. 118187. 10.1016/j.envpol.2021.118187.
George, Eckhard, Horst Marschner, and Iver Jakobsen. "Role of arbuscular mycorrhizal fungi in uptake of phosphorus and nitrogen from soil." Critical reviews in biotechnology 15.3-4 (1995): 257-270.
Horn KJ, Thomas RQ, Clark CM, Pardo LH, Fenn ME, Lawrence GB, et al. (2018) Growth and survival relationships of 71 tree species with nitrogen and sulfur deposition across the conterminous U.S.. PLoS ONE 13(10): e0205296. https://doi.org/10.1371/journal.pone.0205296
Kohut R.J. 2007. Ozone Risk Assessment for Vital Signs Monitoring Networks, Appalachian National Scenic Trail, and Natchez Trace National Scenic Trail. NPS/NRPC/ARD/NRTR—2007/001. National Park Service. Fort Collins, Colorado. Available at https://www.nps.gov/articles/ozone-risk-assessment.htm
Lilleskov, Erik A., et al. "Atmospheric nitrogen deposition impacts on the structure and function of forest mycorrhizal communities: a review." Environmental Pollution 246 (2019): 148-162.
McCoy K., M. D. Bell, and E. Felker-Quinn. 2021. Risk to epiphytic lichen communities in NPS units from atmospheric nitrogen and sulfur pollution: Changes in critical load exceedances from 2001‒2016. Natural Resource Report NPS/NRSS/ARD/NRR—2021/2299. National Park Service, Fort Collins, Colorado. https://doi.org/10.36967/nrr-2287254.
[NADP] National Atmospheric Deposition Program. 2018. NTN Data. Accessed January 20, 2022. Available at http://nadp.slh.wisc.edu/NADP/
Neff, J. C., R. L. Reynolds, S. M. Munson, D. Fernandez, and J. Belnap. 2013. The role of dust storms in total atmospheric particle concentrations at two sites in the western U.S. Journal of Geophysical Research: Atmospheres 118 (19):11,201–211,212. http://dx.doi.org/10.1002/jgrd.50855
Northern Colorado Plateau Inventory and Monitoring Program. 2018. Leaving traces in park waters: contaminants of emerging concern on the northern Colorado Plateau. National Park Service. https://irma.nps.gov/DataStore/DownloadFile/601516
Pardo, L.H., M. J. Robin-Abbott, C. T. Driscoll, eds. 2011. Assessment of Nitrogen deposition effects and empirical critical loads of Nitrogen for ecoregions of the United States. Gen. Tech. Rep. NRS-80. Newtown Square, PA: U.S. Department of Agriculture, Forest Service, Northern Research Station. 291 p. Available at: https://www.nrs.fs.fed.us/pubs/38109
Phillips, M. L., D. E. Winkler, R. H. Reibold, B. B. Osborne, and S. C. Reed. 2021. Muted responses to chronic experimental nitrogen deposition on the Colorado Plateau. Oecologia 195:513-524.
Porter, E., Blett, T., Potter, D.U., Huber, C. 2005. Protecting resources on federal lands: Implications of critical loads for atmospheric deposition of nitrogen and sulfur. BioScience 55(7): 603–612. https://doi.org/10.1641/0006-3568(2005)055[0603:PROFLI]2.0.CO;2
Rao, L. E., E. B. Allen, and T. Meixner. 2010. Risk-based determination of critical nitrogen deposition load for fire spread in southern California deserts. Ecological Applications 20:1320–1335.
Schwinning, S., B. I. Starr, N. J. Wojcik, M. E. Miller, J. E. Ehleringer, R. L. Sanford. 2005. Effects of nitrogen deposition on an arid grassland in the Colorado Plateau cold desert. Rangeland Ecology and Management. 58: 565–574.
Sullivan T.J. 2016. Air quality related values (AQRVs) in national parks: Effects from ozone; visibility reducing particles; and atmospheric deposition of acids, nutrients and toxics. Natural Resource Report. NPS/NRSS/ARD/NRR—2016/1196. National Park Service. Fort Collins, Colorado. Available at https://www.nps.gov/articles/aqrv-assessment.htm
Sullivan, T. J. and T.C. McDonnell. 2014. Mapping of nutrient-nitrogen critical loads for selected national parks in the intermountain west and great lakes regions. Natural Resource Technical Report NPS/ARD/NRTR—2014/895. National Park Service, Fort Collins, Colorado. Available at https://irma.nps.gov/DataStore/Reference/Profile/2214130
Weissinger, Rebecca H., Brett R. Blackwell, Kristen Keteles, William A. Battaglin, Paul M. Bradley. 2018. Bioactive contaminants of emerging concern in National Park waters of the northern Colorado Plateau, USA. Science of The Total Environment 636: 910-918. https://doi.org/10.1016/j.scitotenv.2018.04.332
Weissinger, R., W. Battaglin, and P. Bradley. 2016. Screening for contaminants of emerging concern in waters of the Northern Colorado Plateau Network: 2015 surface water data. Natural Resource Report NPS/NCPN/NRR—2016/1239. National Park Service, Fort Collins, Colorado.
Winkler, D. 2019 Investigator Annual Report on Physiological impacts of ambient ozone levels on sensitive plant species on the Colorado Plateau. National Park Service Research Permit and Reporting System. https://irma.nps.gov/RPRS/IAR/Profile/342948
Last updated: September 23, 2024