Last updated: June 29, 2023
Article
Helping Managers Plan for Climate Change with Remote Sensing at Colorado National Monument

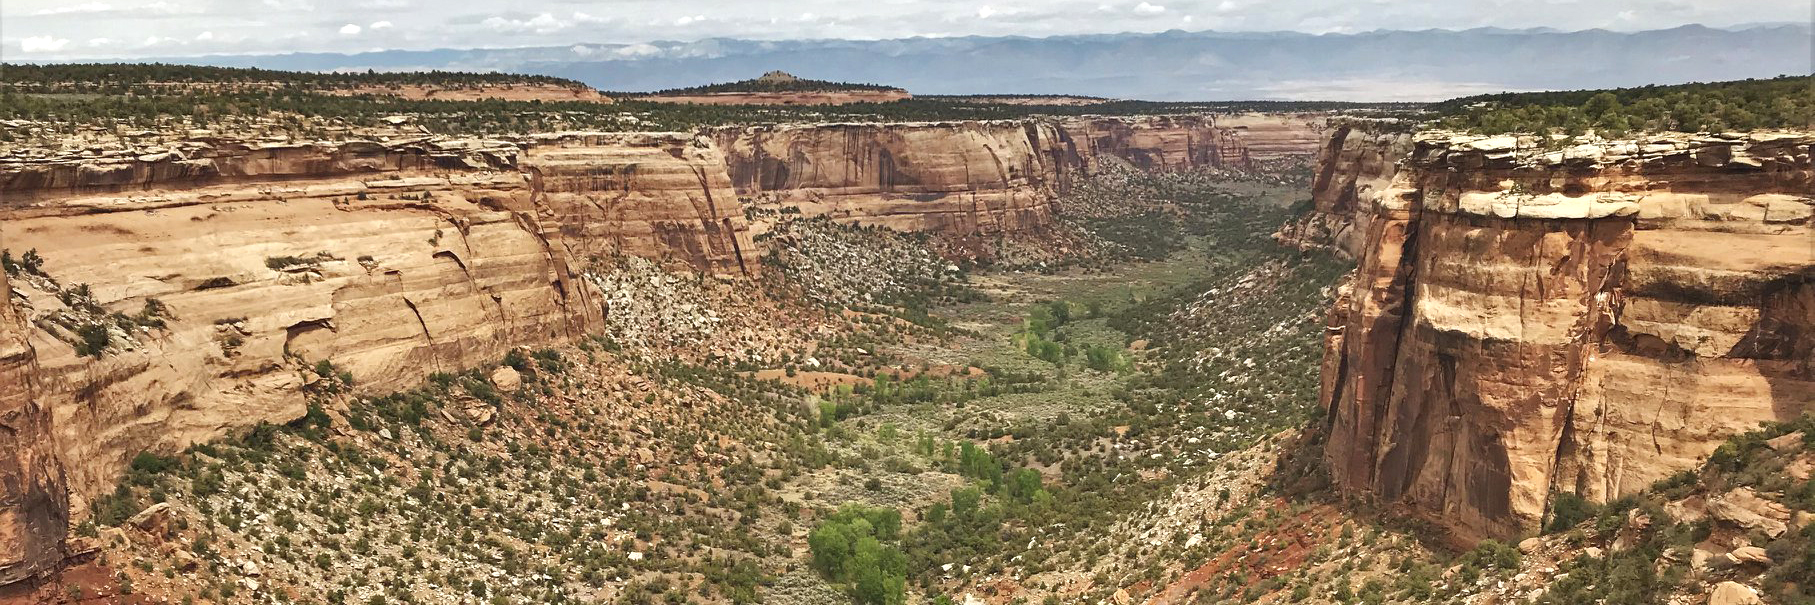
Colorado National Monument. NPS photo.
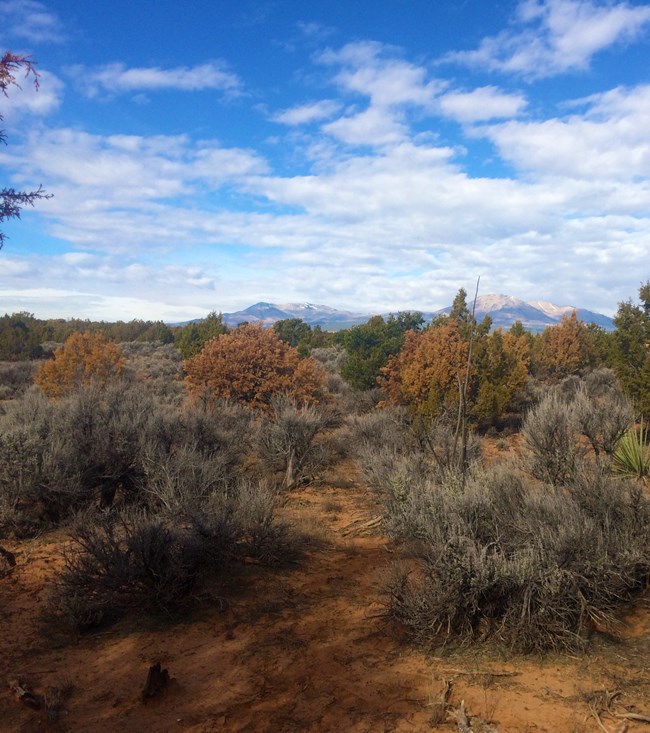
In fall 2019, National Park Service staff in southern Utah noticed something strange about the landscape. Some of it was the wrong color. The region’s dark-green pinyon-juniper communities usually contrast sharply with the red-orange rocks of canyon country. But now, some of the juniper trees were also orange.
They later learned the trees were dying—during one of the driest periods in 1,800 years (Gangopadhyay et al. 2022). Another tree-killing drought had occurred in southern Utah parks in 2002–2003. In combination, these two droughts killed trees that had survived for centuries.
This raised some troubling questions. Should park managers expect more of the same in the future? Could pinyon and juniper trees in other areas be affected? Which other vegetation types might change—and when and where? And what, if anything, could be done about it?
If we had a crystal ball, how might our approach to management change?

We know long-term monitoring creates a record of the past. But it also provides a window into the future. Tracking which kinds of vegetation are changing, where they grow, and which aspects of climate are associated with the changes can help us understand what, when, where, and why future changes may occur, based on climate projections.
Linking satellite observations of vegetation condition with climate data over time can reveal how climate influences plant production (growth) and phenology (timing of growth). It can also tell us how sensitive different plant communities are to changes in weather and climate. With information like that, we won’t need a fortuneteller.
To see how this might work, Northern Colorado Plateau Network scientists used satellite imagery to analyze vegetation condition over time at parks on the northern Colorado Plateau, including Colorado National Monument, and explored the relationships between climate and vegetation, using new tools for assessing climate effects. The results help us understand what to expect over the next few decades, and provide park managers with time and tools to plan for a range of scenarios.
Tracking Phenology and Production
Satellite images collected over time show us when plant growth begins in spring (“greenup”)—because the landscape turns green. At the end of the season, it senesces and turns brown (“browndown”). Linking the timing of greenup and browndown to weather provides insight about how weather affects phenology.
We can use those same satellite images to measure plant production. In combination, phenology and production tell us a lot about plant relationships with climate. And because plants are the biological engines of parks, this analysis tells us a lot about the impacts of climate change on park ecosystems.

Vegetation Conditions,
2000–2019
At Colorado National Monument, we used satellite imagery from remote sensing to track phenology and production across nine vegetation types in and near the park from 2000 to 2019:
- Annual Exotic Grassland
- Perennial Exotic Grassland
- Juniper Woodland
- Pinyon-Juniper Woodland
- Riparian Woodland
- Dry Sagebrush Shrubland
- Dry Shrubland
- Mixed Montane Shrubland
- Wet Shrubland
Phenology
- By the end of the study period, greenup was starting earlier for almost all (7 of 9) vegetation types.
- For almost all vegetation types, peak vegetation growth shifted to later in the season.
- The growing season was longer for all groups except Perennial Exotic Grassland.
Production
- Total vegetation production increased for almost all (7 of 9) vegetation types. The exceptions were the two exotic grasslands (annual and perennial), which had small but statistically insignificant increases in growth.

Climate Conditions,
2000–2019
We used a water-balance model to determine how different aspects of climate and site characteristics affected vegetation phenology and production. To calculate the variables, we used 1-kilometer, gridded, Daymet temperature and precipitation data.
During the study period (shown in gray shading in the figure), which began in the midst of a long-term drought, precipitation increased slightly, at 3–11 mm/year, depending on location. Air temperature remained stable during this time.
Taking the long view, an interesting decadal oscillation was evident. From 1980 through the study period, the monument experienced strong cycles of high precipitation in the middle of each decade, followed by periods of low precipitation at the end of each decade. The precipitation peaks translated to similar peaks in other water-balance variables, including soil moisture.

Relationships of Climate and Vegetation
With this information about phenology, production, and climate in hand, we explored which climate variables were the most important drivers of phenology and production, which vegetation types were most sensitive to changes in water availability, and which types were most resistant to drought.
Climate drivers of production and phenology
- Precipitation was the single climate variable most closely tied to vegetation production. It increased slightly during the study, which may help explain why plant growth increased moderately over the 20-year study period.
- Weather conditions from previous years have lingering effects on vegetation. In fact, average soil moisture from the current and previous two years was the best indicator of current-year plant growth. This is likely because the growth of roots, stems, leaves, and seeds from prior years are the biological legacy available to respond to current-year water availability. For example, poor growth from a severe drought last year limits a plant’s ability to respond to more water this year.
- A combination of date of complete snowmelt, actual evapotranspiration, and temperature had the most influence on the start of growing season.

Vegetation sensitivity to climate
The way vegetation at Colorado National Monument responds to various climate drivers reflects the different plant communities and the site conditions where they grow. The same amount of change in precipitation, for example, may cause different responses from different vegetation types, or even in the same vegetation type growing in different soils.
The rate of change in vegetation condition per unit change in a climate variable is known as its climate sensitivity. More-sensitive vegetation types respond more quickly or more strongly to changes in climate conditions. Understanding a vegetation type’s climate sensitivity is critical to understanding its vulnerability to future climate change.
- Vegetation types at Colorado National Monument, ordered from MOST to LEAST sensitive to precipitation:
- Annual Exotic Grassland
- Dry Shrubland
- Wet Shrubland
- Mixed Montane Shrubland
- Riparian Woodland
- Dry Sagebrush
- Juniper Woodland
- Pinyon-Juniper Woodland
- Annual Exotic Grassland changed most quickly in response to precipitation changes. This poses a potential management concern, because fire-prone cheatgrass dominates this community just outside the park boundary (Perkins 2020). In years with abundant rain- and snowfall, park managers should be particularly aware of the potential for cheatgrass to increase in abundance more quickly than native species.
- An increase in fire-prone invasive species, such as cheatgrass, in or near the park could lead to loss of pinyon-juniper forests that have not burned in more than a millennium (Kennard 2013).
- Pinyon-Juniper Woodland followed a pattern where higher-elevation communities—which receive more precipitation—were less sensitive to changes in water availability. Although these vegetation types require more water, they respond more slowly than other types if water needs are not met. This is because they have traits, such as deep roots and slow growth, that buffer the effect of changes in water availability—to a point .
Drought tolerance
Understanding drought tolerance helps park managers determine which vegetation types may persist or perish if water stress increases due to climate change. Vegetation that requires less water is more drought-tolerant.
- If the landscape gets drier, then the amount of area suitable for drought-tolerant species will likely increase. Under this scenario, there will likely be less area available for less drought-tolerant species.
- Vegetation types at Colorado National Monument, ordered from MOST to LEAST drought-tolerant according to their water-deficit pivot points (see figure in next section):
- Dry Shrubland
- Wet Shrubland
- Annual Exotic Grassland
- Riparian Woodland
- Dry Sagebrush Shrubland
- Pinyon-Juniper Woodland
- Juniper Woodland
- Mixed Montane Shrubland
- (Perennial exotic grassland did not have a significant relationship with deficit.)
What Lies Ahead for Colorado National Monument?
Potential vegetation transitions
Though our science-based findings are more reliable than the musings of a fortuneteller, they have limits. We can’t know exactly how vegetation change will play out at Colorado National Monument. But change is coming. The cause of juniper mortality seen by park managers in southern Utah in 2018 was acute drought stress (Kannenberg 2021)—a surprising finding, given the relative insensitivity of juniper to interannual precipitation changes. And even under a range of scenarios, projections trend toward more aridity in the future (see figure).

In the figure, “annual deficit” represents the amount of additional water plants would use if it were available. The “pivot point” represents how much drought stress a vegetation type can tolerate and still persist over time. Water deficit that exceeds the pivot point restricts plant growth and survival. Combined with climate projections of increased aridity, the vegetation sensitivity to water deficit reported in this study can help guide the time and place for management actions at Colorado National Monument.
Under the worst-case (warm-and-dry) scenario, water deficit will exceed the pivot point in most years by 2030. This suggests a transition to more drought-tolerant vegetation may occur. Under the best-case (warm-and-wet) scenario, annual deficit will remain near the historical range of variability. But multiple years of drought stress above the pivot point may exceed the adaptive capacity of vegetation types that are less drought-tolerant, such as Juniper Woodland. In response to acute drought, this type may transition to a more drought-tolerant type. For trees that live 800 years or more, that’s not far into the future. The time to start planning for change is now.
Informed planning
Managers can use information from studies like this one in a powerful planning framework. Climate Smart Conservation (CSC) is a roadmap for managing natural resources as the climate changes. Ultimately, the CSC process helps managers decide whether to resist, accept, or direct vegetation change and identify management options for each approach. One of its key inputs is a resource’s sensitivity and vulnerability to climate change, which this study provides. The report associated with this web article offers a step-by-step application of this kind of information for Climate Smart Conservation planning.

The success of restoration projects benefit when growing conditions are more likely to promote establishment of desirable plant species.
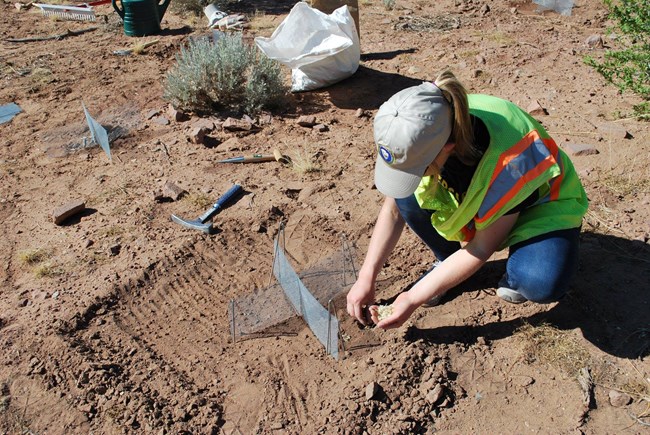
Information in the report can also be used to identify optimum restoration windows. Restoration projects are an indispensable resource-management tool. They are also expensive and time-consuming. If park managers can anticipate how different vegetation types are likely to respond to projected climate conditions, then they can adjust the species mix and timing of restoration projects to optimize seed germination and establishment of desirable species most likely to survive new climate conditions.
Other potential questions—and answers
The information provided in this research can also help managers anticipate and plan for cascading ecological effects, such as effects on pollinators, or the movement of wildlife (migrations) across park lands. It can also be leveraged to answer many more questions, such as:
- Where are the most- and least-sensitive vegetation types in the park, and when might they experience chronic conditions that force change?
- Are forests likely to experience drought stress or transition sooner than shrublands?
- Which soil types most effectively buffer drought stress, and where do they occur in the park?
- After disturbances, such as wildfire or extreme drought, are climate conditions likely to support historical vegetation types?
- Are animal species of concern dependent on climate-sensitive vegetation types?
Vegetation provides valuable ecological services and adds to park viewsheds in immeasurable ways. But plants are sensitive to weather and climate—and when those conditions change, they respond. This report provides a foundation for understanding where, when, what, and why change may occur. Park managers can use that information to manage park resources through continuous change.
Information in this article was summarized from Landscape phenology, vegetation condition, and relations with climate at Colorado National Monument, 2000–2019, by D. Thoma (2022).
Other cited material includes:
Gangopadhyay, S., C.A. Woodhouse, G.J. McCabe, C.C. Routson, and D.M. Meko. 2022. Tree rings reveal unmatched 2nd century drought in the Colorado River Basin. Geophysical Research Letters, June 9. https://doi.org/10.1029/2022GL098781.
Kannenberg, S.A., A.W. Driscoll, D. Malesky, and W.R.L. Anderegg. 2021. Rapid and surprising dieback of Utah juniper in the southwestern USA due to acute drought stress. Forest Ecology and Management 480 (January 15):118639. https://doi.org/10.1016/j.foreco.2020.118639.
Kennard, D.K., and A.J. Moore. 2013. Fire history, woodland structure, and mortality in a pinion-juniper woodland in the Colorado National Monument. Natural Areas Journal 33:296-306. https://doi.org/10.3375/043.033.0308.
Perkins D.W. 2021. Invasive exotic plant monitoring at Colorado National Monument: 2019 field season. Natural Resource Report. NPS/NCPN/NRR—2021/2268. National Park Service. Fort Collins, Colorado. https://doi.org/10.36967/nrr-2286650.
Tags
- colorado national monument
- climate change
- climate change adaptation
- climate science
- pinyon-juniper woodlands
- pinyon juniper
- climate
- climate change impacts
- climate change effects
- climate change science
- drought
- ecosystem monitoring
- monitoring
- management tools
- plants
- science
- science and resource management
- science and research
- research
- research studies
- research results
- sustainability
- water balance
- waterbalancecc
- ncpn
- phenology
- phenology monitoring
