Last updated: August 8, 2024
Article
Changing Patterns of Water Availability May Change Vegetation Composition in US National Parks

Overview
One of the challenges of dealing with climate change is that what it looks like often depends on where you’re standing. Humans experience climate mostly through temperature and precipitation. In the US, we’re finding our eastern gardens underwater more often—while in the West, water shortages and wildfire, driven by drought and heat, are occurring with unprecedented frequency.
But what if you were a plant? Most plants grow by absorbing water through their roots and releasing it from their leaves during photosynthesis. For those plants to use water, it needs to be stored in the soil. But not all water that falls from the sky ends up being available for plants to use. Some of it runs across the surface of the ground without ever sinking into the soil, and some drains deeply below rooting zones. Some of it also evaporates, especially as temperatures rise. This means that if you’re a plant, a place that received 5 inches more precipitation than normal, but was also 3°F degrees warmer than normal, could actually end up feeling drier than normal.
The implications of this are important not only to plants, but also to managers and visitors of national parks. Plants grow where their traits are best suited to the climate. When the climate changes, vegetation assemblages change. Shifts in the composition and distribution of vegetation communities (i.e., which plants grow where) can lead to changes in the animal species that live in a park, as well as how visitors experience the landscape.
But climate patterns operate at different scales. Even within the boundaries of a single park, not all areas experience the same climate the same way due to differences in topography, soil type, and other factors. In the past, this has made it hard for park managers to know how to respond and plan for climate change using regional projections. Fortunately, a new dataset developed by the National Park Service, US Geological Survey, and their partners, may help resolve some of those issues.
At a Glance
- Across the US, changes in water availability are affecting vegetation composition and distribution (i.e., which plants grow where). This can lead to changes in the animal species that live in a park, as well as how visitors experience the landscape.
- These changes are evident at a broad scale—but a new dataset can reveal changes at different places within a single park.
- Instead of relying on temperature and precipitation alone, the dataset accounts for interactions between climate and local site conditions.
- This gives park managers a valuable tool for understanding ongoing and potential future changes in vegetation under different scenarios of climate change.
Analyzing Climate through Water Balance
The pre-calculated, gridded dataset looks at climate through water balance. Though climate is often thought of in terms of temperature and precipitation, it’s important—from the perspective of a plant—to account for the interaction between those two variables through time, as well as their mediation by environmental properties, such as soil type. To do this, scientists use a water-balance model. The model calculates climatic water deficit (WD), a measure of unmet water need (“drought stress”), and actual evapotranspiration (AET), a measure of water used by vegetation. Comparing these two variables is a common method of looking at climate in plant ecology. For vegetation, increased WD means that later in the growing season, plants were more likely to wilt than in years past. Increased AET means plants used more water to grow.
What is a “gridded” climate dataset?
On-the-ground measurements of temperature and precipitation from park weather stations are available from only a handful of locations in each park—often, only one. To know about water-balance conditions throughout a park, scientists can create a gridded dataset by interpolating weather-station data following the pattern of a grid, like a checkerboard laid over the park landscape. The resulting dataset accounts for changes in temperature and precipitation caused by elevation differences. This provides a more accurate representation of weather conditions at places far from the actual weather stations, which tend to be located at park headquarters.
Our water-balance model combines these weather grids with information on soil properties and hillslope aspect to derive a local estimate of water use and water need. Without gridded datasets, park managers would have to make management decisions based on temperature and precipitation data from very few locations. But these datasets are now available for every square kilometer in every National Park Service unit in the continental U.S.
Spatial Patterns
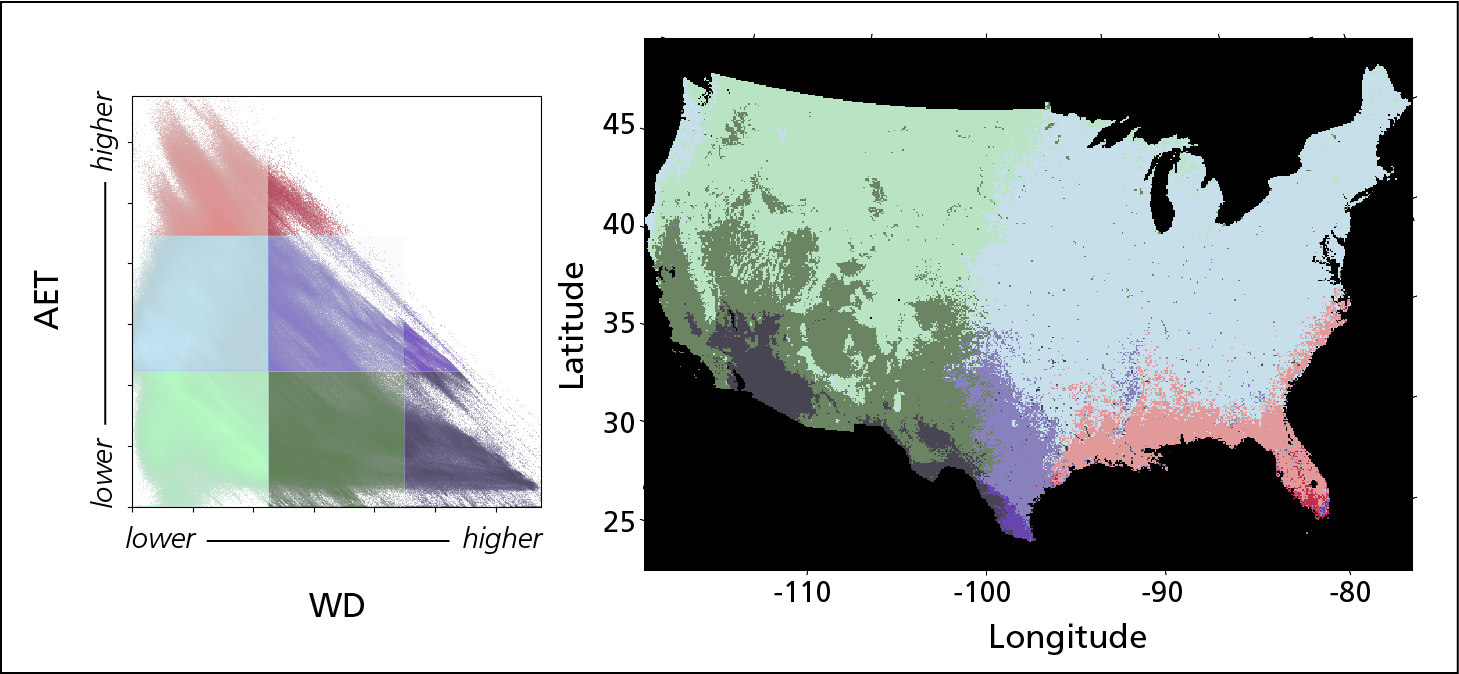
Using a water-balance model, agency and partner scientists analyzed spatial patterns in WD and AET across the continental United States from 1980 to 2019. In the West, they found higher WD and lower AET than in the East, indicating drier conditions for plants in the West. The East had generally opposite patterns, indicating wetter conditions for plants. Average annual WD was lower in the North than in the South (Figure 1). As expected, the most desert-like conditions of low AET and high WD occurred in southern California, Texas, and Arizona. The most mesic conditions of low WD and high AET occurred in Florida.

Figure 1. Spatial patterns in climatic water deficit (WD) and actual evapotranspiration (AET). Left: Scatterplot of average annual WD and AET for all locations in the continental US, 1981–2019. Colors correlate to zones depicted on the map at right. Right: Geographic locations of colored areas in the scatter plot.
Trend over time
Examined separately, trends in WD and AET were mirror images of each other across the US. Water deficit (drying) increased in the West and decreased in the East (Figure 2A). Eastern parts of the US often had increasing AET, while western parts often had decreasing AET (Figure 2B). Middle longitudes had mixed trends.

Figure 2B. Change in annual total actual evapotranspiration (AET) estimated for 1980–2019.
Amount of change over time
Water deficit showed more change over time than AET (Figure 3). Again, the patterns tended to be regional, but with some pockets of difference at higher elevations. Some higher-elevation areas in the West (e.g., parts of Wyoming, Colorado, and the Sierra Nevada Range) had large relative increases in AET (wetting). Some of the greatest relative decreases in AET (drying) occurred in desert areas of southern California. These water-limited locations were becoming even more arid.

Figure 3B. Normalized change (percent of historical mean per decade) in total annual actual evapotranspiration, 1980–2019.
Across the National Park System
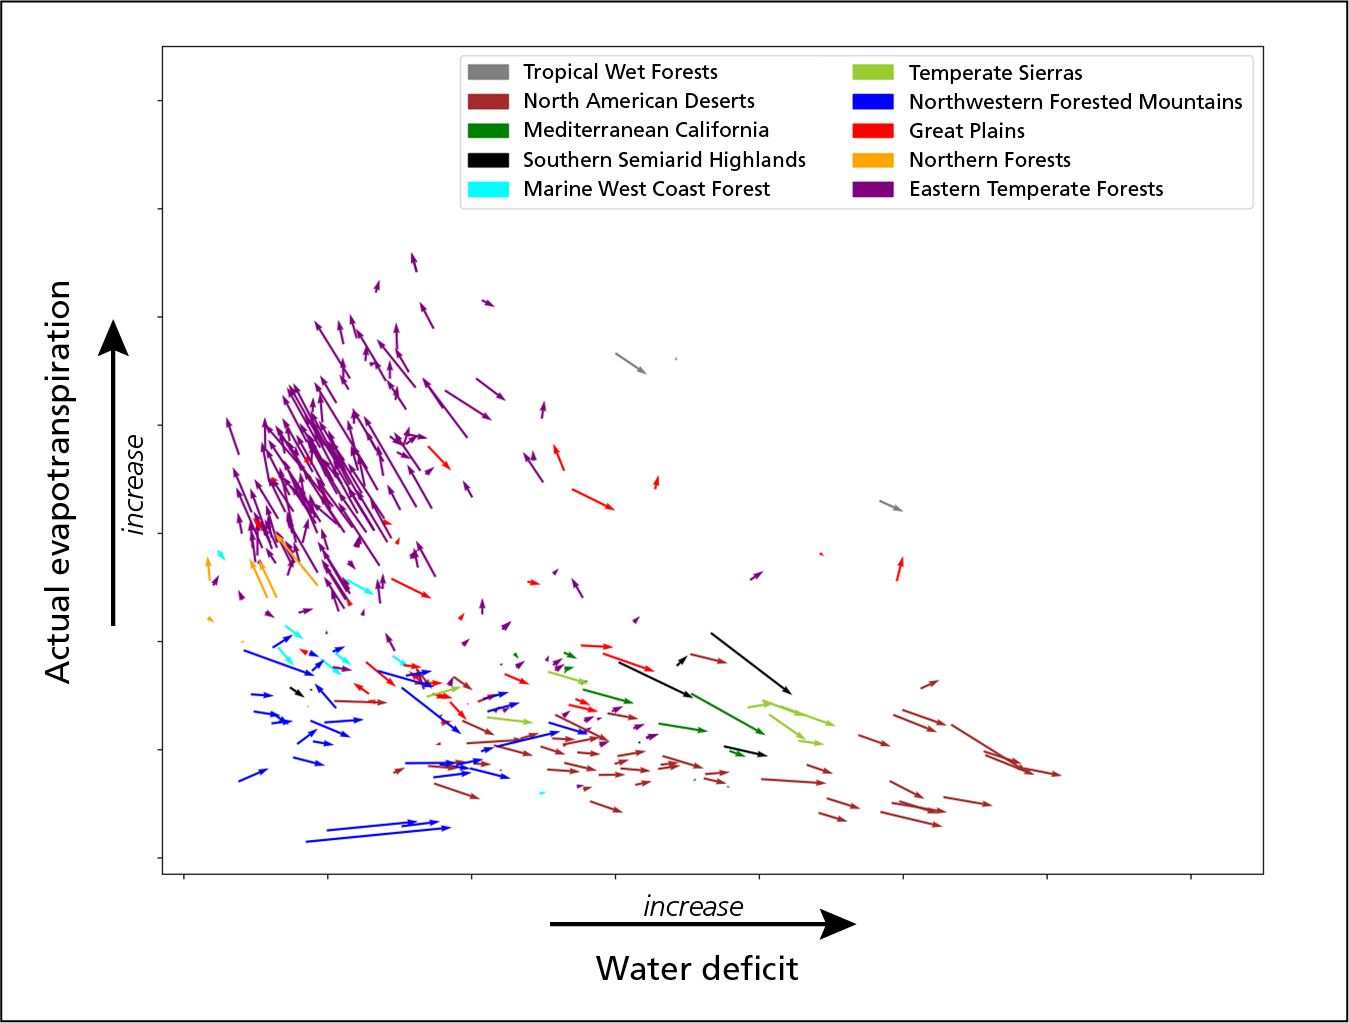
In general, the same trends held true for National Park Service units in the continental US: the wettest parks (Eastern Temperate Forests) got wetter and the driest parks (North American Deserts) got drier (Figure 4). The primary driver for AET and WD trends in the West was increasing temperature. Precipitation played a more dominant role in the East. WD generally increased and AET decreased in the West because temperature increases there were steeper than in the East, while precipitation trends were usually flat or declining.

Figure 4. Combined change in climatic water deficit and actual evapotranspiration (“climate space”) for all National Park Service units in the continental US, calculated from means for 1980–1999 and 2000–2019. One centroid point for each park was selected, creating one vector for each park. Due to the strong relationship between plant distributions and climate space, any directional movement favors some species over others. The shift quantifies the central climate forces experienced by plants, which can help explain why different species grow where they do and how shifts in species composition might occur over time.

Within-park Trends
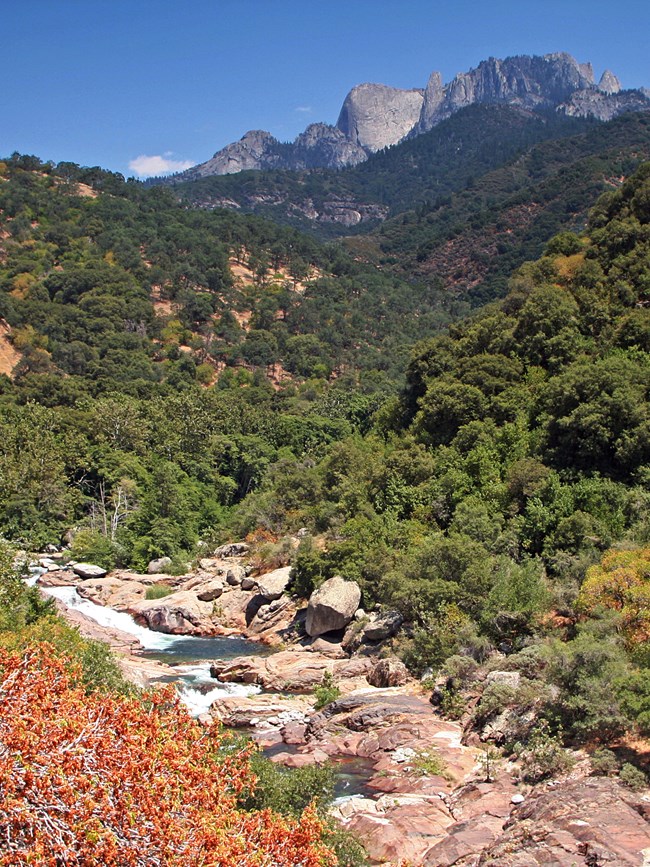
But what about a single park with a broad ecological range? The dataset developed by the NPS and its partners makes it possible to rapidly conduct park-specific analyses that would have been difficult and time-consuming in the past. For example, Sequoia and Kings Canyon National Parks showed broad diversity in trends within a relatively small (~1,500 square kilometer) area.
The parks straddle the boundary between two ecoregions (Northwestern Forested Mountains and Mediterranean California). Vegetation types range from chaparral, to montane forests, to giant sequoia groves, to high alpine communities.
Park areas experienced a broad range of WD and AET during the study period, with changes varying along an elevation gradient of 500–4,300 meters.
- The greatest changes occurred at higher elevations, where increasing trends in temperature were greatest and average annual precipitation increased during the study period. These areas (>2,000 m) generally saw increases in WD and little change in AET.
- Middle elevations (1,000–2,000 m) generally experienced moderate increases in both AET and WD.
- Lower-elevation locations, where average annual precipitation was lowest and the least amount of temperature increase occurred, generally had the smallest changes, with WD increases and little change in AET.

Ecological Implications
In the plant world, AET is tightly linked to plant growth, while WD is a good indicator of drought stress. These two variables determine the “climate space” where plants grow. When drought exceeds the stress tolerance of a particular species, then that species may decline. A drying West, expressed by increasing WD, portends shifts in plant distribution, as species better-suited to drier conditions (sometimes non-natives) replace current species. Elsewhere, increasing AET can benefit species that rely on abundant moisture and high growth rates to compete, causing concomitant shifts.
Vegetation responses to changes in water availability can be abrupt or gradual. Gradual vegetation shifts are already taking place in eastern forests, while abrupt, disturbance-driven events are altering treeline forests in the West. In the Southwest, increases in aridity suggest that more drought-tolerant species may have competitive advantage in the future.
Value to Park Managers
These findings help explain how the same temperature and precipitation patterns can have different effects over short distances due to local interactions between climate and site characteristics. At a coarse scale, ecosystems across the western US are drying while becoming wetter in the East. But at the park scale, environmental variability drives a range of local responses. When interpreted in the context of high-priority resource issues, such as vegetation dynamics, freshwater flows, wildfire ignitions, and dynamics of water-sensitive species, water-balance trends can serve as important indicators of ecological change that can inform management decisions.
The dataset used for this analysis is available for use by park managers seeking to understand how plant communities may shift under different scenarios of climate change. For instance, the vectors in Figure 4 point in the direction that plant-relevant climate space is moving. In response to the driving force of climate change, vegetation will adapt, move, or perish. Understanding the vulnerability of vegetation to climate change is the key to helping managers decide whether to resist, accept, or direct change to achieve management goals.
Information in this article was summarized from “Historical changes in plant water use and need in the continental United States,” by MT Tercek, D Thoma, JE Gross, K Sherrill, S Kagone, and G Senay. PLOS ONE, September 2, 2021.
Contact: David Thoma, National Park Service, Inventory & Monitoring Division
Tags
- acadia national park
- agate fossil beds national monument
- alibates flint quarries national monument
- amistad national recreation area
- antietam national battlefield
- apostle islands national lakeshore
- appalachian national scenic trail
- arches national park
- assateague island national seashore
- aztec ruins national monument
- badlands national park
- bandelier national monument
- bent's old fort national historic site
- big bend national park
- big cypress national preserve
- big hole national battlefield
- big south fork national river & recreation area
- big thicket national preserve
- bighorn canyon national recreation area
- biscayne national park
- black canyon of the gunnison national park
- blue ridge parkway
- bryce canyon national park
- buffalo national river
- cabrillo national monument
- canyon de chelly national monument
- canyonlands national park
- cape cod national seashore
- cape hatteras national seashore
- cape lookout national seashore
- capitol reef national park
- capulin volcano national monument
- carlsbad caverns national park
- casa grande ruins national monument
- catoctin mountain park
- cedar breaks national monument
- chaco culture national historical park
- chamizal national memorial
- channel islands national park
- chattahoochee river national recreation area
- chesapeake & ohio canal national historical park
- chickasaw national recreation area
- chiricahua national monument
- colorado national monument
- congaree national park
- coronado national memorial
- cowpens national battlefield
- crater lake national park
- craters of the moon national monument & preserve
- cumberland island national seashore
- curecanti national recreation area
- cuyahoga valley national park
- death valley national park
- delaware water gap national recreation area
- devils postpile national monument
- devils tower national monument
- dinosaur national monument
- dry tortugas national park
- ebey's landing national historical reserve
- effigy mounds national monument
- el malpais national monument
- el morro national monument
- everglades national park
- fire island national seashore
- florissant fossil beds national monument
- fort bowie national historic site
- fort larned national historic site
- fort union national monument
- fort vancouver national historic site
- fossil butte national monument
- gettysburg national military park
- gila cliff dwellings national monument
- glacier national park
- glen canyon national recreation area
- golden gate national recreation area
- golden spike national historical park
- grand canyon national park
- grand canyon-parashant national monument
- grand portage national monument
- grand teton national park
- grant-kohrs ranch national historic site
- great basin national park
- great sand dunes national park & preserve
- great smoky mountains national park
- guadalupe mountains national park
- gulf islands national seashore
- hagerman fossil beds national monument
- hopewell culture national historical park
- hovenweep national monument
- indiana dunes national park
- isle royale national park
- jean lafitte national historical park and preserve
- jewel cave national monument
- john day fossil beds national monument
- john muir national historic site
- joshua tree national park
- juan bautista de anza national historic trail
- katahdin woods and waters national monument
- lake mead national recreation area
- lake meredith national recreation area
- lake roosevelt national recreation area
- lassen volcanic national park
- lava beds national monument
- lewis & clark national historic trail
- little bighorn battlefield national monument
- lyndon b johnson national historical park
- mammoth cave national park
- marsh - billings - rockefeller national historical park
- mesa verde national park
- mississippi national river & recreation area
- missouri national recreational river
- mojave national preserve
- montezuma castle national monument
- mount rainier national park
- mount rushmore national memorial
- muir woods national monument
- natchez trace parkway
- national capital parks-east
- natural bridges national monument
- navajo national monument
- new river gorge national park & preserve
- niobrara national scenic river
- noatak national preserve
- obed wild & scenic river
- olympic national park
- oregon caves national monument & preserve
- organ pipe cactus national monument
- ozark national scenic riverways
- padre island national seashore
- pecos national historical park
- petrified forest national park
- petroglyph national monument
- pictured rocks national lakeshore
- pipe spring national monument
- point reyes national seashore
- redwood national and state parks
- rio grande wild & scenic river
- rock creek park
- rocky mountain national park
- saguaro national park
- saint croix national scenic riverway
- salinas pueblo missions national monument
- sand creek massacre national historic site
- santa monica mountains national recreation area
- scotts bluff national monument
- sequoia & kings canyon national parks
- shenandoah national park
- sleeping bear dunes national lakeshore
- sunset crater volcano national monument
- tallgrass prairie national preserve
- theodore roosevelt national park
- timpanogos cave national monument
- timucuan ecological & historic preserve
- tonto national monument
- tule lake national monument
- tule springs fossil beds national monument
- tumacácori national historical park
- tuzigoot national monument
- upper delaware scenic & recreational river
- valles caldera national preserve
- voyageurs national park
- walnut canyon national monument
- washita battlefield national historic site
- whiskeytown national recreation area
- white sands national park
- wilson's creek national battlefield
- wind cave national park
- wupatki national monument
- yellowstone national park
- yosemite national park
- yucca house national monument
- zion national park
- climate
- climate change
- climate change research
- climate change adaptation
- climate science
- climate change effects
- vegetation
- vegetation and soils
- plants
- waterbalancecc
- monitoring
- adaptation
- research
- precipitation
- temperature
- ncpn
- romn
- natural resource management
- science and resource management
- northern colorado plateau
- gryn
- phenology
- phenology monitoring
- research brief
- jmrlc
- natural resources
- asisscienceresearch
- appalachian highlands network
- chihuahuan desert network
- cumberland piedmont network
- eastern rivers and mountains network
- great lakes network
- greater yellowstone network
- gulf coast network
- heartland network
- klamath network
- mediterranean coast network
- mid-atlantic network
- mojave desert network
- national capital region network
- north coast and cascades network
- northeast coastal and barrier network
- northeast temperate network
- northern great plains network
- san francisco bay area network
- sierra nevada network
- south florida caribbean network
- southeast coast network
- upper columbia basin network
