NPS photo / SECN staff

NPS photo
Overview
Established on St. Simons Island, Georgia in 1736 to protect South Carolina and Georgia from the Spanish, the town of Frederica was once the southernmost outpost of the British colonies in North America. Today, Fort Frederica National Monument encompasses three land units totaling approximately 124 hectares (305 acres) on St. Simons Island. The monument’s main unit is split by the Frederica River, one of the primary tidal rivers in the area, into a 40-hectare (99-acre) section of salt marsh on the west side of the river and a 55-hectare (137-acre) upland section east of the river. The separate Bloody Marsh Battle Site unit is approximately 7.2 kilometers (4.5 miles) to the south, and consists of a small upland area and an associated patch of tidal marsh. The salt marsh is dominated by cordgrass (Spartina spp.), while the uplands include a mix of coastal maritime hammock dominated by Virginia live oak (Quercus virginiana) and loblolly pine (Pinus taeda).
The Southeast Coast Network conducts the following monitoring at Fort Frederica National Monument:
- Salt marsh elevation monitoring sites are surveyed twice annually during spring and fall. Salt marshes and coastal wetlands habitats host a wide diversity of wildlife and are important to many aquatic species but are threatened by sea-level rise. The marshes must grow at a rate equal to or greater than the rate of sea level rise, or they will eventually disappear. The network measures salt marsh elevation and investigates the rate of accretion or subsidence (growth or reduction) in these areas. Salt marsh elevation monitoring at Fort Frederica National Monument has been ongoing since 2015 and a cumulative data package was recently updated and published. This data package includes data from 1998 through 2024 and includes data for five I&M networks.
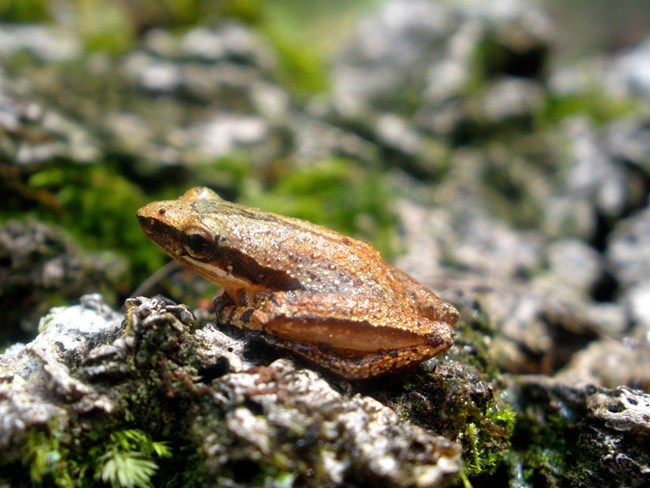
- Landbird community monitoring and Vocal anuran community monitoring is conducted on a rotating schedule every three years. These wildlife communities play critical roles in park ecosystems and interact with several trophic levels of food webs. The network uses automated recording devices (ARDs) to collect vocalization data during mornings and evenings in the spring, which are analyzed by bioacoustics specialists. Data collected from these vital sign monitoring efforts help assess the ecological integrity and diversity of park areas and how communities and park conditions may change over time. The landbird and vocal anuran monitoring efforts in network parks began in 2012.
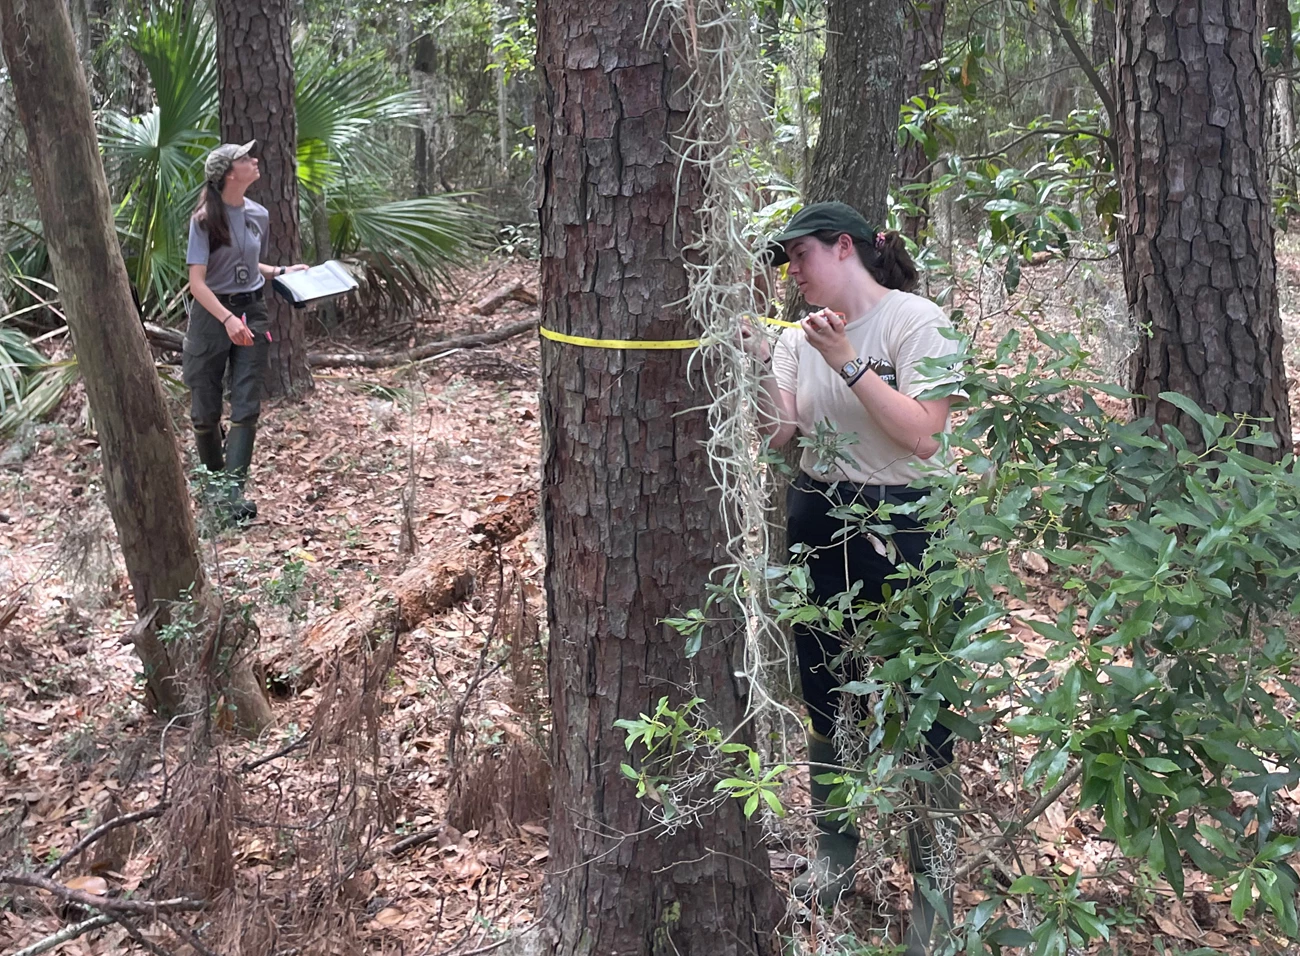
- Vegetation community monitoring is conducted on a rotating schedule. Monitoring vegetation is important because it’s key indicator of overall ecosystem health. Changes in vegetation reflect the effects of stressors like extreme weather, disease, invasive species, fire, and land use change. Plant communities also provide structured habitat and food resources for other species. Vegetation monitoring data provides managers with information about the degree of change in their park’s natural communities. Vegetation plots have been established across the following habitat: Maritime Upland Forest and Shrubland. Data reports include information about new occurrences and rare plants, species richness and abundance, tree health and regeneration, disturbance observations, soil nutrients, landform/geomorphology, and downed woody debris.
| Vital Sign | Examples of Measurement |
|---|---|
| Salt Marsh Elevation | Magnitude, rate and within-site variability of surface elevation, sediment accretion or erosion, different drivers |
| Landbird and Vocal Anuran Communities | Species, distribution, abundance |
| Terrestrial Vegetation Communities | Plant community diversity, relative species/guild abundance, structure/age class, incidence of disease |
Source: NPS DataStore Collection 3976 (results presented are a subset). To search for additional information, visit the NPS DataStore.
Source: NPS DataStore Collection 3973 (results presented are a subset). To search for additional information, visit the NPS DataStore.
Source: NPS DataStore Collection 3974 (results presented are a subset). To search for additional information, visit the NPS DataStore.
Source: NPS DataStore Collection 9581. To search for additional information, visit the NPS DataStore.
Source: NPS DataStore Collection 3978 (results presented are a subset). To search for additional information, visit the NPS DataStore.
Source: NPS DataStore Collection 3977 (results presented are a subset). To search for additional information, visit the NPS DataStore.
Source: NPS DataStore Collection 3975 (results presented are a subset). To search for additional information, visit the NPS DataStore.
Last updated: November 11, 2024
