Last updated: August 26, 2019
Article
Climate Corner, June 2019

NOAA
Atmospheric Carbon Dioxide Levels Reach New Heights
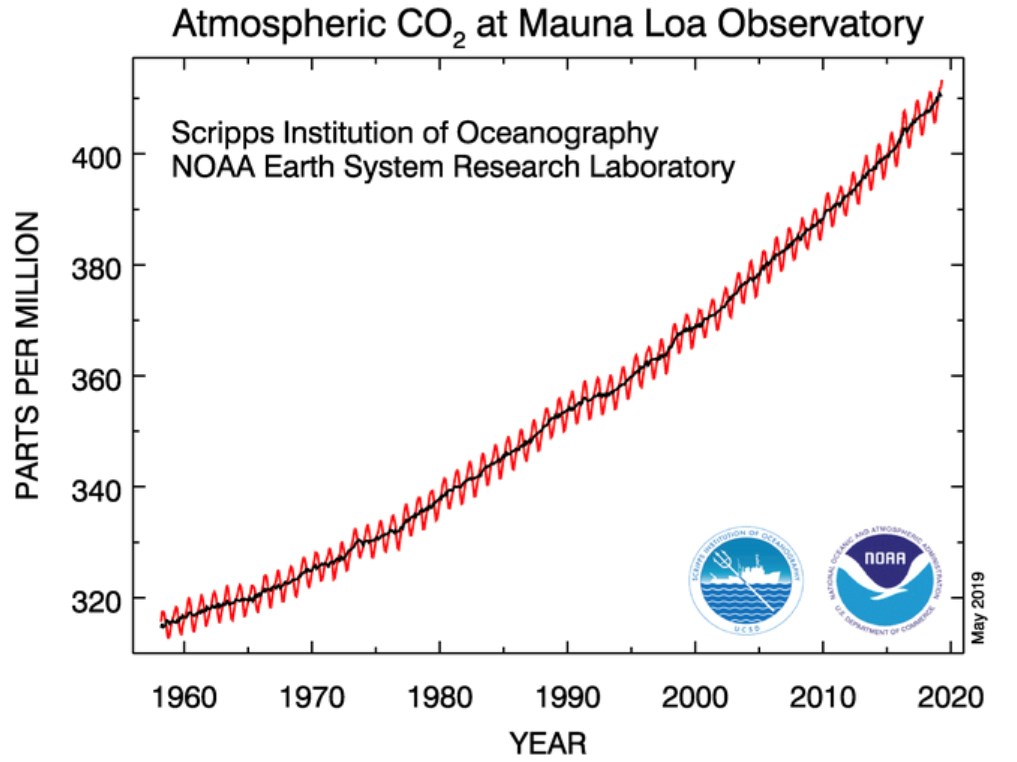
Hawaii’s Mauna Loa volcano rises more than 11,100 feet above the middle of the Pacific Ocean. Its peak is an ideal spot for measuring carbon dioxide (CO2) concentrations in the atmosphere that are representative of much of the northern hemisphere. Scientists with the Scripps Institute of Oceanography have been doing just that at NOAA’s Mauna Loa Observatory since 1958. NOAA began keeping CO2 measurements there as well in 1974. Scripps' very first measurements were already above 300 parts per million (ppm). According to ice core measurements, that threshold had barely been breached before in the last 800,000 years (for scale, modern humans [Homo sapiens] are thought to have existed for less than half of that time). CO2 concentrations have been on the rise ever since, with annual peaks occurring each May, just before the growing season causes plants to remove large quantities from the atmosphere. In May 2014, the monthly CO2 concentration topped 400 ppm for the first time.
This May, the average CO2 concentration atop Mauna Loa was the highest yet, reaching 414.7 ppm as measured by NOAA, and 414.8 ppm as measured by Scripps. For both institutions, these values are 3.5 ppm higher than those they measured last May, representing the second highest annual jump in CO2 yet recorded. The rise in concentrations has been accelerating due to humanity’s increasing CO2 emissions. Over the last decade, the average increase has been 2.2 ppm/year over the last decade. Meanwhile, it was 1.6 and 1.5 ppm/year in the 1980s and 1990s, and just .7 ppm in the early years of monitoring at Mauna Loa.
Rising CO2 concentrations impact us all as the primary driver of climate change. Learn more about climate change in our National Parks, or check out specific examples of what Golden Gate National Recreation Area, Pinnacles National Park, and Point Reyes National Seashore have done, or are doing, to reduce their carbon footprints.
Weather Forecast Model Upgraded to Improve Accuracy
NOAA has taken countless steps to improve its weather forecasting capabilities over the last 40 years. Yet one thing remained the same during that time: the underlying core weather model known as the Global Forecast System (GFS). On June 12th, that model got a significant upgrade. Scientists at NOAA tested the new model alongside the old for the last year, and tested it further with historical weather data. They found it to be as good or better at modeling a wide range of weather phenomena. In particular, it should improve forecasts of severe weather events like hurricanes and winter storms in terms of where they will hit, how intense they will be, and how much precipitation will fall.
Check out the NOAA news release, or this New York Times article to learn more.
