Part of a series of articles titled Park Air Profiles.
Article
Park Air Profiles - Sequoia & Kings Canyon National Parks
Air Quality at Sequoia & Kings Canyon National Parks
Most visitors expect clean air and clear views in parks. Sequoia & Kings Canyon National Parks (NPs), in California, are home to huge mountains, rugged foothills, deep canyons, vast caverns, and the world's largest trees. The parks also experience some of the worst air pollution of any of the national parks in the U.S. The parks are downwind from many air pollution sources, including agriculture, industry, major highways, and urban pollutants from as far away as the San Francisco Bay Area. Air pollutants blown into the park can harm natural and scenic resources such as soils, surface waters, plants, wildlife, and visibility. The National Park Service works to address air pollution effects at Sequoia & Kings Canyon NPs, and in parks across the U.S., through science, policy and planning, and by doing our part.
Nitrogen and Sulfur

Nitrogen (N) and sulfur (S) compounds deposited from the air may have harmful effects on ecosystem processes. Healthy ecosystems can naturally buffer a certain amount of pollution, but once a threshold is passed the ecosystem may respond negatively. This threshold is the critical load, or the amount of pollution above which harmful changes in sensitive ecosystems occur (Porter 2005). N and S deposition change ecosystems through eutrophication (N deposition) and acidification (N + S deposition). Eutrophication increases soil and water nutrients which causes some species to grow more quickly and changes community composition. Ecosystem sensitivity to nutrient N enrichment at Sequoia National Park (SEQU) and Kings Canyon National Park (KICA) relative to other national parks is very high (Sullivan et al. 2016); for a full list of N sensitive ecosystem components, see: NPS ARD 2019. Acidification leaches important cations from soils, lakes, ponds, and streams which decreases habitat quality. Ecosystem sensitivity to acidification at SEQU and KICA relative to other national parks is very high (Sullivan et al. 2016); to search for acid-sensitive plant species, see: NPSpecies.
From 2017-2019 total N deposition in SEQU and KICA ranged from 4.3 to 8.6 kg-N ha-1 yr-1 and total S deposition ranged from 0.9 to 1.9 kg-S ha-1 yr-1 based on the TDep model (NADP, 2018). SEQU and KICA have been monitoring atmospheric N and S deposition since 1980, see the conditions and trends website for park-specific information.
Some high elevation ecosystems in SEQU and KICA have shown variable response to N. These systems receive more N deposition than lower elevation areas and short growing seasons and shallow soils limit the capacity of soils and plants to absorb N. Sources of N in the parks include the Central Valley and San Francisco Bay Area (LeNoir et al. 1999; Bytnerowicz et al. 2002; Hageman et al. 2006).
Additional N Research:- Increased plant growth in lakes from nutrient enrichment, potentially changing aquatic community dynamics (Sickman et al. 2003)
- Replacement of certain lichen species important for wildlife food and habitat by weedy, nitrogen-loving species (Fenn et al. 2008)
- Episodic acidification of some streams during snowmelt (Williams and Melack 1991; Stoddard 1995; Leydecker et al. 1999)
Alpine ecosystem effects
Alpine environments are particularly vulnerable to large inputs of reactive nitrogen because of the sparse cover of vegetation, short growing seasons, large areas of exposed bedrock and talus, and snowmelt nutrient releases (Williams et al., 1996; Nanus et al., 2012). Approximately 57% of the land area in SEQU and KICA is alpine (~328 km2 above 1550 m). McClung et al. (2021) compared the 2015 estimated total N deposition (TDep; NADP, 2018) to the critical load of N for an increase in alpine sedge growth (alpine plant critical load = 3 kg-N ha-1yr-1) and the critical load of N for alpine soil nitrate leaching (alpine soil critical load = 10 kg-N ha-1yr-1; Bowman et al., 2012). They found that deposition exceeded the alpine plant critical load in 5.9% of the park’s alpine area, but was below the alpine soil critical load throughout the park’s entire alpine area.
Epiphytic macrolichen community responses
Epiphytic macrolichens grow on tree trunks, branches, and boles. Since these lichens grow above the ground, they obtain all their nutrients directly from precipitation and the air. Many epiphytic lichen species have narrow environmental niches and are extremely sensitive to changes in air pollution. Geiser et al. (2019) used a U.S. Forest Service national survey to develop critical loads of nitrogen (N) and critical loads of sulfur (S) to prevent more than a 20% decline in four lichen community metrics: total species richness, pollution sensitive species richness, forage lichen abundance, and cyanolichen abundance.
McCoy et al. (2021) used forested area from the National Land Cover Database to estimate the impact of air pollution on epiphytic lichen communities. Forested area makes up 734 km2 (20.9%) of the land area of Sequoia National Park and Kings Canyon National Park.
- N deposition exceeded the 3.1 kg-N ha-1 yr-1 critical load to protect N-sensitive lichen species richness in 57.8% of the forested area.
- S deposition was below the 2.7 kg-S ha-1 yr-1 critical load to protect S-sensitive lichen species richness in every part of the forested area.
For exceedances of other lichen metrics and the predicted decline of lichen communities see Appendices A and B of McCoy et al. (2021).
Additional modeling was done on 459 lichen species to test the combined effects of air pollution and climate gradients (Geiser et al. 2021). A critical load indicative of initial shifts from pollution-sensitive toward pollution-tolerant species occurred at 1.5 kg-N ha-1 yr-1 and 2.7 kg-S ha-1 yr-1 even under changing climate regimes.
Plant species response
Plants vary in their tolerance of eutrophication and acidification, and some plant species respond to nitrogen (N) or sulfur (S) pollution with declines in growth, survival, or abundance on the landscape. Horn et al. (2018) used the U.S. Forest Service national forest survey to develop critical loads of N and critical loads of S to prevent declines in growth or survival of sensitive tree species. Clark et al. (2019) used a database of plant community surveys to develop critical loads of N and critical loads of S to prevent a decline in abundance of sensitive herbaceous plant species. According to NPSpecies, Sequoia National Park and Kings Canyon National Park contain:
- 4 N-sensitive tree species and 21 N-sensitive herbaceous species.
- 6 S-sensitive tree species and 17 S-sensitive herbaceous species.
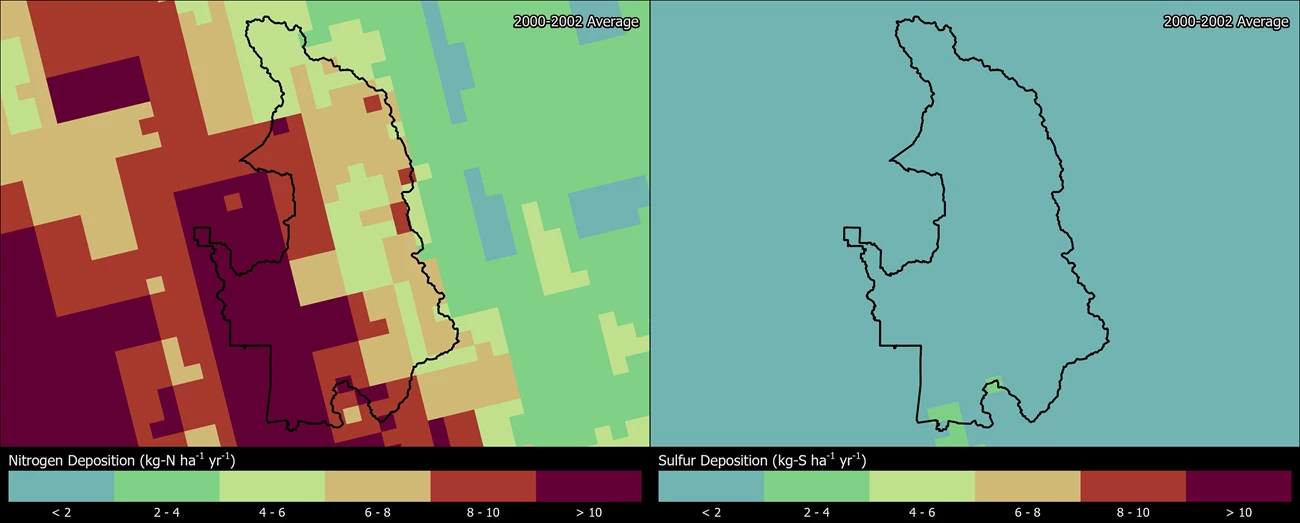
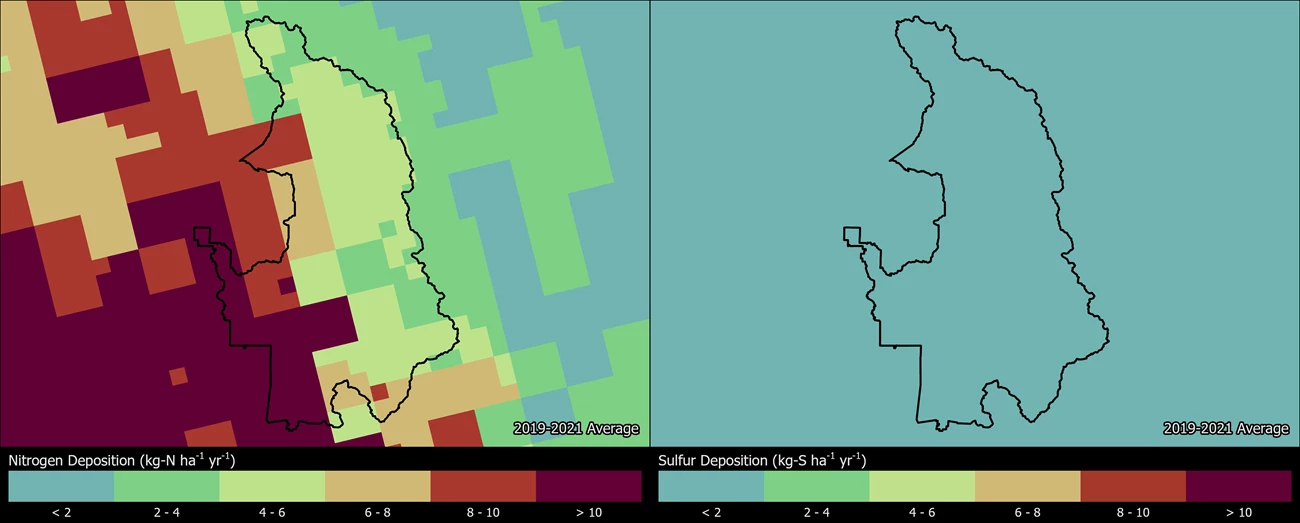
Change in N and S deposition from 2000 to 2021
The maps below show how the spatial distribution of estimated Total N and Total S deposition in SEKI has changed from 2000-2002 to 2019-2021 (TDep MMF version 2022.02). Slide the arrows in the middle of the image up and down to compare N and S deposition between the two years (Yearly Data).
- Minimum N deposition decreased from 4.6 to 3.3 kg-N ha-1 yr-1 and maximum N deposition decreased from 14.9 to 14.7 kg-N ha-1 yr-1.
- Minimum S deposition decreased from 0.8 to 0.7 kg-S ha-1 yr-1 and maximum S deposition decreased from 2.1 to 1.5 kg-S ha-1 yr-1.
Persistent Pollutants
Pollutants like mercury and pesticides are concerning because they are persistent and toxic in the environment. These contaminants can travel in the air thousands of miles away from the source of pollution, even depositing in protected places like national parks. In addition, while some of these harmful pollutants may be banned from use, historically contaminated sites continue to endure negative environmental consequences.
When deposited, airborne mercury and other toxic air contaminants are known to harm wildlife like birds and fish, and cause human health concerns. Many of these substances enter the food chain and accumulate in the tissue of organisms causing reduced reproductive success, impaired growth and development, and decreased survival.
- The deposition of pesticides applied in the Central Valley and subsequently deposited in the park have been linked to the disappearance of the Foothill Yellow-legged Frog and the ongoing decline of other amphibians in these parks (LeNoir et al. 1999; Sparling et al. 2001; Fellers et al. 2004; Davidson and Knapp 2007; Davidson et al. 2012; Smalling et al. 2013).
- Pesticides toxic to fish and bees and most likely to drift into park boundaries due to application in the counties surrounding Sequoia & Kings Canyon NPs are fumigants like Chloropicrin and 1,3-Dichloropropene (Meyer and DeMars 2018).
- Pesticide concentrations in some park fish exceeded the threshold established for human health. Concentrations of dieldrin and p,p’-DDE (a degradation product of DDT often found in fish) exceeded the fish consumption threshold established for human health in 54% and 3% of fish sampled, respectively, and current-use pesticides were elevated in the Sierra Nevada – likely due to the proximity to agricultural and industrial sources (Flanagan Pritz et al. 2014).
- Earlier studies found contaminants and pesticides in park snow, fish, and bird eggs (McConnell et al. 1998; Hageman et al. 2006; Ackerman et al. 2008; Landers et al. 2008; Schwindt et al. 2008; Landers et al. 2010). Abnormalities (e.g., discoloration and thinning) were found in peregrine falcon eggs that contain high levels of DDE (Jarman 1994).
- Some dragonfly larvae sampled at Sequoia & Kings Canyon NPs had mercury concentrations at moderate or higher impairment levels. Dragonfly larvae have been sampled and analyzed for mercury from 10 sites in the park; 82% of the data fall into the moderate (100-300 ng/g dw) and 18% fall into the high/severe (>300 ng/g dw) impairment categories for potential mercury risk. An index of moderate impairment or higher suggests some fish may exceed the US EPA benchmark for protection of human health (Eagles-Smith et al. 2018; Eagles-Smith et al. 2020).
- Mercury concentrations in fish sampled at Sequoia & Kings Canyon NPs did not exceed any thresholds for fish toxicity, bird toxicity, or US EPA’s human consumption guidance. Fish were sampled and analyzed for mercury from four sites sampled at the park and compared to data across 21 western parks. The average fish mercury concentration (43.8 ng/g ww) was lower than the study-wide mean (77.7 ng/g ww) (Eagles-Smith et al. 2014). However, the data may not reflect the risk at other unsampled locations in the park; fish consumption advisories may be in effect for mercury and other contaminants (NPS 2022).
- No fish sampled from the park were found to be intersex (Schreck and Kent 2013). Reproductive abnormalities such as intersex, the presence of both male and female reproductive structures in the same fish, can signify exposure to contaminants.
Visibility

Many visitors come to enjoy the spectacular vistas found at Sequoia & Kings Canyon NPs. Distant vistas are often obscured by haze, reducing how well and how far people can see. Visibility reducing haze is caused by tiny particles in the air (see particulate matter below). Many of the same pollutants that ultimately fall out as nitrogen and sulfur deposition contribute to this haze. Organic compounds, soot, dust, and wood smoke reduce visibility as well. Significant improvements in park visibility on clearest days as well as haziest days have been documented since the 1990’s. Still, visibility in the park is a long way from the Clean Air Act goal of no human caused impairment.
Visibility effects:
- Reduction of the average natural visual range from about 150 miles (without the effects of pollution) to about 65 miles because of pollution at the parks
- Reduction of the visual range from about 115 miles to below 30 miles on high pollution days
Visit the NPS air quality conditions and trends website for park-specific visibility information. Sequoia & Kings Canyon NPs have been monitoring visibility since 1992. View a live air quality webcam and explore air monitoring »
Ground-Level Ozone

At ground level, ozone is harmful to human health and the environment. Ground-level ozone does not come directly from smokestacks or vehicles, but instead is formed when other pollutants, mainly nitrogen oxides and volatile organic compounds, react in the presence of sunlight.
During the summer months, ozone levels in the park frequently exceed the National Ambient Air Quality Standards set by the U.S. Environmental Protection Agency to protect public health. Ozone is a respiratory irritant, causing coughing, sinus inflammation, chest pains, scratchy throat, lung damage, and reduced immune system functions. Children, the elderly, people with existing health problems, and active adults are most vulnerable. When ozone levels exceed, or are predicted to exceed, health standards, Sequoia & Kings Canyon NPs staff post health advisories cautioning staff and visitors of the potential health risks associated with exposures to elevated levels.
Over the course of a growing season, ozone can also damage plant tissues making it harder for plants to produce and store food. It also weakens plants making them less resistant to disease and insect infestations. Some plants are more sensitive to ozone than others. Search ozone-sensitive plant species found at Sequoia & Kings Canyon NPs.
Ozone effects:
- Widespread and severe injury to Ponderosa and Jeffrey pines in the parks (Arbaugh et al. 1998).
- Injury to ponderosa pine and Jeffrey pine needles (Warner et al. 1983), with ozone injury evident on nearly 90% of Jeffrey pines in or near the Giant Forest on the west side of the parks where ozone exposure is highest (Peterson et al. 1991; Peterson and Arbaugh 1992);
- Reduced tree health and growth in some locations due to chronic, long-term ozone exposure (Peterson et al. 1987; Ewell et al. 1989; Peterson et al. 1991; Duriscoe and Stolte 1992; Peterson and Arbaugh 1992);
- Injury to Giant Sequoia seedlings, possibly affecting their long-term success (Grulke and Miller 1994; Miller and Grulke 1994).
Visit the NPS air quality conditions and trends website for park-specific ozone information. Sequoia & Kings Canyon NPs have been monitoring ozone since 1984. View live ozone and meteorology data, and explore air monitoring »
Particulate Matter
Concentrations of fine particles in the air at Sequoia and Kings Canyon NPs sometimes exceed the National Ambient Air Quality Standards set by the U.S. Environmental Protection Agency to protect human health. Fine particles (smaller than 2.5 micrometers) originate from either direct emissions by a source, such as construction sites, power plants, and fires, or reactions with gases and aerosols in the atmosphere emitted from pollution sources upwind.
Because of their small size, fine particles can get deep into the lungs and cause serious health problems. Numerous scientific studies have linked particle pollution exposure to irritation of the airways, coughing, difficulty breathing, aggravated asthma, chronic bronchitis, heart attacks, and premature death in people with heart or lung disease.
Sequoia & Kings Canyon NPs have been monitoring particulate matter since 1992. Check out the most recent particulate matter levels on our live data site and explore air monitoring »
Explore Other Park Air Profiles
There are 46 other Park Air Profiles covering parks across the United States and its territories.
References
Ackerman, L. K., Schwindt, A. R., Massey Simonich S. L., Koch, D. C., Blett, T. F., Schreck, C. B., Kent, M. L., Landers, D. H. 2008. Atmospherically Deposited PBDEs, Pesticides, PCBs, and PAHs in Western U.S. National Park Fish: Concentrations and Consumption Guidelines. Environmental Science & Technology 42: 2334–2341. Available at: https://pubs.acs.org/doi/10.1021/es702348j
Arbaugh, M. J., Miller, P. R., Carroll, J. J., Takemoto, B. and Procter, T. 1998. Relationships of ozone exposure to pine injury in the Sierra Nevada and San Bernardino Mountains of California, USA. Environ. Pollut. 101: 291–301.
Bowman W, Murgel J, Blett T, Porter E. 2012. Nitrogen critical loads for alpine vegetation and soils in Rocky Mountain National Park. Journal of Environmental Management. 103:165-171
Burri, K., C. Gromke, and F. Graf. "Mycorrhizal fungi protect the soil from wind erosion: a wind tunnel study." Land Degradation & Development 24.4 (2013): 385-392.
Bytnerowicz, A., Dawson, P. J., Morrison, C. L. and Poe, M. P. 1991. Deposition of Atmospheric Ions to Pine Branches and Surrogate Surfaces in the Vicinity of Emerald Lake Watershed, Sequoia National Park. Atmospheric Environment Part A—General Topics 25: 2203–2210.
Bytnerowicz, A., Tausz, M., Alonso, R., Jones, D., Johnson, R. and Grulke, N. 2002. Summer-time distribution of air pollutants in Sequoia National Park, California. Environmental Pollution 118: 187–203.
Cheng, Shen, et al. "Elucidating the mechanisms underlying enhanced drought tolerance in plants mediated by arbuscular mycorrhizal fungi." Frontiers in Microbiology 12 (2021): 809473.
Clark, C.M., Simkin, S.M., Allen, E.B. et al. Potential vulnerability of 348 herbaceous species to atmospheric deposition of nitrogen and sulfur in the United States. Nat. Plants 5, 697–705 (2019). https://doi.org/10.1038/s41477-019-0442-8
Davidson, C. and Knapp, R. A. 2007. Multiple stressors and amphibian declines: Dual impacts of pesticides and fish on yellow-legged frogs. Ecol Appl 17: 587–597. Available at: https://www.jstor.org/stable/40061880
Davidson, C., Stanley, K. and Simonich, S.M. 2012. Contaminant residues and declines of the Cascades frog (Rana cascadae) in the California Cascades, USA. Environmental Toxicology and Chemistry, 31: 1895-1902. https://doi.org/10.1002/etc.1902
Duriscoe, D. M. and Stolte, K. W. 1992. Decreased foliage production and longevity observed in ozone-injured Jeffrey and ponderosa pines in Sequoia National Park, California. In Tropospheric Ozone and the Environment: Effects Modeling and Control. Air Waste Manage. Assoc.: Pittsburgh, PA. pp. 663–680.
Eagles-Smith, C.A., J.J. Willacker, and C.M.Flanagan Pritz. 2014. Mercury in fishes from 21 national parks in the Western United States—Inter and intra-park variation in concentrations and ecological risk: U.S. Geological Survey Open-File Report 2014-1051, 54 p. Available at: http://dx.doi.org/10.3133/ofr20141051.
Eagles-Smith, C.A., S.J. Nelson., C.M. Flanagan Pritz, J.J. Willacker Jr., and A. Klemmer. 2018. Total Mercury Concentrations in Dragonfly Larvae from U.S. National Parks (ver. 6.0, June 2021): U.S. Geological Survey data release. https://doi.org/10.5066/P9TK6NPT
Eagles-Smith, C.A., J.J. Willacker, S.J. Nelson, C.M. Flanagan Pritz, D.P. Krabbenhoft, C.Y. Chen, J.T. Ackerman, E.H. Campbell Grant, and D.S. Pilliod. 2020. Dragonflies as biosentinels of mercury availability in aquatic food webs of national parks throughout the United States. Environmental Science and Technology 54(14):8779-8790. https://doi.org/10.1021/acs.est.0c01255
Ewell, D. M., Mazzu, L. C., and Duriscoe, D. M. 1989. Specific leaf weight and other characteristics of ponderosa pine as related to visible ozone injury. Air Pollution Control Assoc. 16: 411–418.
Fellers, G. M., McConnell, L. L., Pratt, D., Datta, S. 2004. Environmental Toxicology and Chemistry 23 (9): 2170–2177. https://doi.org/10.1897/03-491
Fenn, M. E., Jovan, S., Yuan, F., Geiser, L., Meixner, T., Gimeno, B. S. 2008. Empirical and simulated critical loads for nitrogen deposition in California mixed conifer forests. Environmental Pollution 155: 492–511.
Flanagan Pritz, C. M., J. E. Schrlau, S. L. Massey Simonich, T. F. Blett. 2014. Contaminants of Emerging Concern in Fish from Western U.S. and Alaskan National Parks – Spatial Distribution and Health Thresholds. Journal of American Water Resources Association 50 (2): 309–323. Available at https://irma.nps.gov/App/Reference/Profile/2210538.
Geiser, Linda & Nelson, Peter & Jovan, Sarah & Root, Heather & Clark, Christopher. (2019). Assessing Ecological Risks from Atmospheric Deposition of Nitrogen and Sulfur to US Forests Using Epiphytic Macrolichens. Diversity. 11. 87. 10.3390/d11060087.
Geiser, Linda & Root, Heather & Smith, Robert & Jovan, Sarah & Clair, Larry & Dillman, Karen. (2021). Lichen-based critical loads for deposition of nitrogen and sulfur in US forests. Environmental Pollution. 291. 118187. 10.1016/j.envpol.2021.118187.
George, Eckhard, Horst Marschner, and Iver Jakobsen. "Role of arbuscular mycorrhizal fungi in uptake of phosphorus and nitrogen from soil." Critical reviews in biotechnology 15.3-4 (1995): 257-270.
Grulke, N. E. and Miller, P. R. 1994. Changes in Gas-Exchange Characteristics during the Life-Span of Giant Sequoia—Implications for Response to Current and Future Concentrations of Atmospheric Ozone. Tree Physiology 14: 659–668.
Hageman, K. J., Simonich, S. L., Campbell, D. H., Wilson, G. R., Landers, D. H. 2006. Atmospheric deposition of current-use and historic-use pesticides in snow at national parks in the Western United States. Environmental Science & Technology 40: 3174–3180. Available at: https://pubs.acs.org/doi/10.1021/es060157c
Horn KJ, Thomas RQ, Clark CM, Pardo LH, Fenn ME, Lawrence GB, et al. (2018) Growth and survival relationships of 71 tree species with nitrogen and sulfur deposition across the conterminous U.S.. PLoS ONE 13(10): e0205296. https://doi.org/10.1371/journal.pone.0205296
Jarman W. M. 1994. Levels and trends of DDE in California peregrines. U.S. Fish and Wildlife Service Report. 16 pp.
Landers, D. H., Simonich, S. L., Jaffe, D. A., Geiser, L. H., Campbell, D. H., Schwindt, A. R., Schreck, C. B., Kent, M. L., Hafner, W. D., Taylor, H. E., Hageman, K. J., Usenko, S., Ackerman, L. K., Schrlau, J. E., Rose, N. L., Blett, T. F., Erway, M. M. 2008. The Fate, Transport, and Ecological Impacts of Airborne Contaminants in Western National Parks (USA). EPA/600/R—07/138. U.S. Environmental Protection Agency, Office of Research and Development, NHEERL, Western Ecology Division, Corvallis, OR. Available at https://irma.nps.gov/DataStore/Reference/Profile/660829.
Landers, D. H., Simonich, S. M., Jaffe, D., Geiser, L., Campbell, D. H., Schwindt, A., Schreck, C., Kent, M., Hafner, W., Taylor, H. E., Hageman, K., Usenko, S., Ackerman, L., Schrlau, J., Rose, N., Blett, T., Erway, M. M. 2010. The Western Airborne Contaminant Assessment Project (WACAP): An Interdisciplinary Evaluation of the Impacts of Airborne Contaminants in Western U.S. National Parks. Environmental Science and Technology 44: 855–859. Available at https://pubs.acs.org/doi/10.1021/es901866e
LeNoir, J. S., McConnell, L. L., Fellers, G. M., Cahill, T. M., Seiber, J. N. 1999. Summertime transport of current-use pesticides from California’s Central Valley to the Sierra Nevada Mountain Range, USA. Environmental Toxicology and Chemistry 18: 2715–2722. Available at: https://irma.nps.gov/DataStore/Reference/Profile/598758
Leydecker, A., Sickman, J. O. and Melack, J. M. 1999. Episodic lake acidification in the Sierra Nevada, California. Water Resources Research 35: 2793–2804.
Lilleskov, Erik A., et al. "Atmospheric nitrogen deposition impacts on the structure and function of forest mycorrhizal communities: a review." Environmental Pollution 246 (2019): 148-162.
McClung JJ, Bell MD, Felker-Quinn E. 2021. Extrapolating critical loads of nitrogen for alpine vegetation and assessing exceedance in national parks based on TDep Total N from 2002–2016. Natural Resource Report. NPS/NRSS/ARD/NRR—2021/2240. National Park Service. Fort Collins, Colorado. https://doi.org/10.36967/nrr-2284914
McConnell, L. L., LeNoir, J. S., Datta, S. and Seiber, J. N. 1998. Wet deposition of current-use pesticides in the Sierra Nevada mountain range, California, USA. Environmental Toxicology and Chemistry 17: 1908–1916. https://irma.nps.gov/DataStore/Reference/Profile/612157
McCoy K., M. D. Bell, and E. Felker-Quinn. 2021. Risk to epiphytic lichen communities in NPS units from atmospheric nitrogen and sulfur pollution: Changes in critical load exceedances from 2001‒2016. Natural Resource Report NPS/NRSS/ARD/NRR—2021/2299. National Park Service, Fort Collins, Colorado. https://doi.org/10.36967/nrr-2287254.
Meyer, Erik and Christopher DeMars. 2018. A Simplified Approach to Using Pesticide Use Reporting To Prioritize Pesticide Risk in California’s National Parks. https://doi.org/10.1021/bk-2018-1283.ch018
Miller, P. R. and Grulke, N. E. 1994. Air pollution effects on giant sequoia ecosystems. In P. S. Aune (tech. coord.). Proceedings of the symposium on giant sequoias: their place in the ecosystem and society. USDA Forest Service Gen. Tech. Rep. PSW-GTR-151. pp. 90–98. Available at https://www.fs.usda.gov/treesearch/pubs/53857.
[NADP] National Atmospheric Deposition Program. 2018. NTN Data. Accessed January 20, 2022. Available at http://nadp.slh.wisc.edu/NADP/
Nanus L, Clow D, Saros J, Stephens V, Campbell D. 2012. Mapping Critical Loads of Nitrogen Deposition for Aquatic Ecosystems in the Rocky Mountains, USA.. Environmental Pollution. 166:125-135
[NPS] National Park Service. 2022. Fish Consumption Advisories. https://www.nps.gov/subjects/fishing/fish-consumption-advisories.htm
Peterson, D. L. and Arbaugh, M. J. 1992. Mixed conifer forests of the Sierra Nevada. In R. K. Olson, D. Binkley, and M. Böhm (eds.), Response of Western Forests to Air Pollution. Springer-Verlag, New York. pp. 433–459.
Peterson, D. L., Arbaugh, M. J., Robinson, L. J. 1991. Regional growth changes in ozone-stressed ponderosa pine (Pinus ponderosa) in the Sierra Nevada, California, USA. The Holocene 1: 50–61.
Peterson, D. L., Arbaugh, M. J., Wakefield, V. A. and Miller, P. R. 1987. Evidence of growth reduction in ozone-injured Jeffrey pine (Pinus jeffreyi Grev. and Balf.) in Sequoia and Kings Canyon National Parks. Journal of the Air Pollution Control Association 37: 906–912.
Porter, E., Blett, T., Potter, D.U., Huber, C. 2005. Protecting resources on federal lands: Implications of critical loads for atmospheric deposition of nitrogen and sulfur. BioScience 55(7): 603–612. https://doi.org/10.1641/0006-3568(2005)055[0603:PROFLI]2.0.CO;2
Schreck, C.B. and M. Kent. 2013. Extent of Endocrine Disruption in Fish of Western and Alaskan National Parks. NPS-OSU Task Agreement J8W07080024. NPS Final Report, 72 pp. https://irma.nps.gov/DataStore/DownloadFile/469831
Schwindt, A. R., Fournie, J. W., Landers, D. H., Schreck, C. B., Kent, M. 2008. Mercury Concentrations in Salmonids from Western U.S. National Parks and Relationships with Age and Macrophage Aggregates. Environmental Science & Technology 42 (4): 1365–1370. https://pubs.acs.org/doi/10.1021/es702337m
Sickman, J. O., Melack, J. M. and Clow, D. W. 2003. Evidence for nutrient enrichment of high-elevation lakes in the Sierra Nevada, California. Limnology and Oceanography 48: 1885–1892.
Smalling, K.L., Fellers, G.M., Kleeman, P.M. and Kuivila, K.M. 2013. Accumulation of pesticides in pacific chorus frogs (Pseudacris regilla) from California's Sierra Nevada Mountains, USA. Environ Toxicol Chem, 32: 2026-2034. https://doi.org/10.1002/etc.2308
Sparling, D. W., Fellers G. M., McConnell L. L. 2001. Pesticides and amphibian population declines in California, USA. Environmental Toxicology and Chemistry 20: 1591–1595. https://doi.org/10.1002/etc.5620200725
Stoddard, J. L. 1995. Episodic Acidification During Snowmelt of High Elevation Lakes in the Sierra Nevada Mountains of California. Water, Air and Soil Pollution. 85:353–358.
Sullivan, T. J. 2016. Air quality related values (AQRVs) in national parks: Effects from ozone; visibility reducing particles; and atmospheric deposition of acids, nutrients and toxics. Natural Resource Report NPS/NRSS/ARD/NRR—2016/1196. National Park Service, Fort Collins, CO.
Warner, T. E., Wallner, D. W. and Vogler, D. R. 1983. Ozone injury to ponderosa and Jeffrey pines in Sequoia & Kings Canyon National Parks. In Proceedings First Biennial Conference of Research in California’s National Parks. pp. 1–7.
Williams M.W. and Melack J.M. 1991. Solute chemistry of snowmelt and runoff in an alpine basin, Sierra Nevada. Wat. Resourc. Res. 27:1575-1588
Williams MW, Baron JS, Caine N, Sommerfeld R, Sanford R. 1996. Nitrogen saturation in the Rocky Mountains. Environmental Science & Technology. 30(2):640-646
Tags
Last updated: August 6, 2024