Last updated: March 19, 2025
Article
Climate and Water Monitoring at Tuzigoot National Monument: Water Year 2022

NPS
Overview
Together, climate and hydrology shape ecosystems and the services they provide, particularly in arid and semi-arid ecosystems. Understanding changes in climate, groundwater, and surface water is key to assessing the condition of park natural resources—and often, cultural resources.
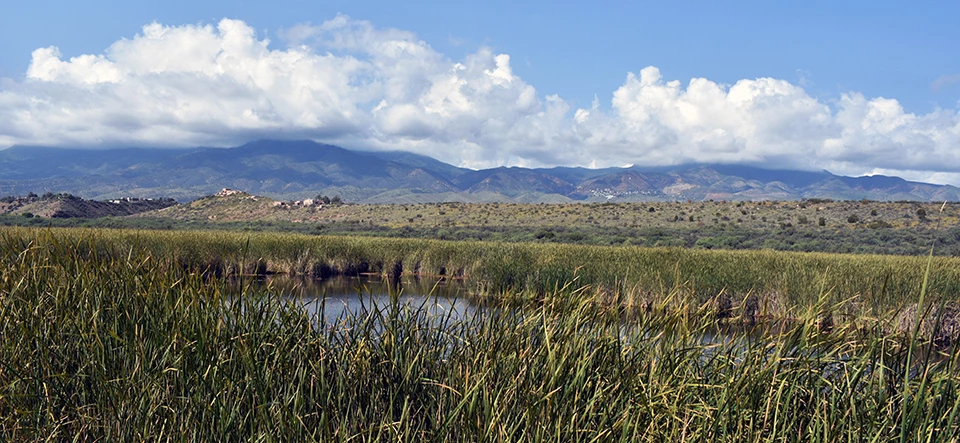
At Tuzigoot National Monument (Figure 1), Sonoran Desert Network (SODN) scientists study how ecosystems may be changing by taking measurements of key resources, or “vital signs,” year after year—much as a doctor keeps track of a patient’s vital signs. This long-term ecological monitoring provides early warning of potential problems, allowing managers to mitigate them before they become worse. At Tuzigoot National Monument we monitor climate and springs among other vital signs.
Surface-water conditions are closely related to climate conditions. Because they are better understood together, we report on climate in conjunction with water resources. Reporting is by water year (WY), which begins in October of the previous calendar year and goes through September of the water year (e.g., WY2022 runs from October 2021 through September 2022).
This article reports on results of climate and water monitoring done at Tuzigoot National Monument in WY2022.

NPS
Climate and Weather
There is often confusion over the terms “weather” and “climate.” In short, weather describes instantaneous meteorological conditions (e.g., it’s currently raining or snowing, it’s a hot or frigid day). Climate reflects patterns of weather at a given place over longer periods of time (seasons to years). Climate is the primary driver of ecological processes on earth. Climate and weather information provide context for understanding the status or condition of other park resources.
Methods
Tuzigoot National Monument has operated a National Oceanic and Atmospheric Administration Cooperative Observer Program (COOP) weather station since 1991 (TUZIGOOT, #028904; see Figure 1). This station provides a reliable, long-term climate dataset used for analyses in this climate and water report. Data from this station are accessible through Climate Analyzer.
Results for Water Year 2022
Precipitation
Annual precipitation at Tuzigoot National Monument in WY2022 was 9.40″ (23.9 cm; Figure 2), which was 2.60″ (6.6 cm) less than the 1991–2020 average. Less than 30% of average monthly rainfall occurred in November, January, February, April, May, and August. Early monsoon rains in June totaled 1.06″ and may be underestimated due to missing data. This was nearly five times the 1991–2020 average. No extreme daily rainfall events (> 1″; 2.54 cm) occurred in WY2022, compared to the average annual frequency of 2.0 days.
Air Temperature
Mean annual maximum air temperature at Tuzigoot National Monument in WY2022 was 82.6°F (28.1°C), 2.0°F (1.1°C) warmer than the 1991–2020 average. The mean annual minimum air temperature in WY2022 was 46.6°F (8.1°C), which was within 0.2°F (0.1°C) and approximately the same as the 1991–2020 average. Mean monthly maximum and minimum temperatures in WY2022 varied up to 6.7°F (3.7°C) relative to the 1991–2020 monthly average temperatures (Figure 2). We recorded extremely hot temperatures (> 104°F; 40.0°C) on 28 days in WY2022 compared to the 1991-2020 average frequency of 19.5 days. Extremely cold temperatures (< 26°F; 3.3°C) occurred on 20 days, more than the average frequency of 15.1 days.

NPS
Drought
Reconnaissance drought index (Tsakiris and Vangelis 2005) provides a measure of drought severity and extent relative to the long-term climate. It is based on the ratio of average precipitation to average potential evapotranspiration (the amount of water loss that would occur from evaporation and plant transpiration if the water supply was unlimited) over short periods of time (seasons to years). The reconnaissance drought index for Tuzigoot National Monument indicates that WY2022 was drier than the 1991–2022 average, from the perspective of both precipitation and potential evapotranspiration (Figure 3).
Reference: Tsakiris G., and H. Vangelis. 2005. Establishing a drought index incorporating evapotranspiration. European Water 9: 3–11.

NPS
Springs
Background
Springs, seeps, and tinajas (pools in a rock basin or impoundments in bedrock) are small, relatively rare biodiversity hotspots in arid lands. They are the primary connection between groundwater and surface water and are important water sources for plants and animals. For springs, the most important questions we ask are about persistence (How long was there water in the spring?) and water quantity (How much water was in the spring?).
Methods
Sonoran Desert Network springs monitoring is organized into four modules, described below.
Site Characterization
This module, which includes recording GPS locations and drawing a site diagram, provides context for interpreting change in the other modules. We also describe the spring type (e.g., helocrene, limnocrene, rheocrene, or tinaja) and its associated vegetation. Helocrene springs emerge as low-gradient wetlands, limnocrene springs emerge as pools, and rheocrene springs emerge as flowing streams. This module is completed once every five years or after significant events.
Site Condition
We estimate natural and anthropogenic disturbances and the level of stress on vegetation and soils on a scale of 1–4, where 1 = undisturbed, 2 = slightly disturbed, 3 = moderately disturbed, and 4 = highly disturbed. Types of natural disturbances can include flooding, drying, fire, wildlife impacts, windthrow of trees and shrubs, beaver activity, and insect infestations. Anthropogenic disturbances can include roads, off-highway vehicle trails, hiking trails, livestock and feral-animal impacts, removal of invasive non-native plants, flow modification, and evidence of human use of the spring. We take repeat photographs showing the spring and its landscape context. We note the presence of certain obligate wetland plants (plants that almost always occur only in wetlands), facultative wetland plants (plants that usually occur in wetlands, but also occur in other habitats), and non-native bullfrogs and crayfish, and we record the density of invasive, non-native plants.
Water Quantity
We measure the persistence of surface water, amount of spring discharge, and wetted extent (area that contained water). To estimate persistence, we analyze the variance of temperature measurements taken by logging thermometers placed at or near the orifice (spring opening). Because water mediates variation in diurnal temperatures, data from a submerged sensor will show less daily variation than data from an exposed open-air sensor; this tells us when the spring was wet or dry. Surface discharge is measured with a timed sample of water volume. Wetted extent is a systematic measurement of the physical length (up to 100 m), width, and depth of surface water. It is assessed using a technique for either standing water (e.g., limnocrene and helocrene springs) or flowing water (e.g., rheocrene springs).
Water Quality
We measure core water quality parameters and water chemistry. Core parameters include water temperature, pH, specific conductivity (a measure of dissolved compounds and contaminants), dissolved oxygen (how much oxygen is present in the water), and total dissolved solids (an indicator of potentially undesirable compounds). Discrete samples of these parameters are collected with a multiparameter meter. If the meter failed calibration check(s), we indicate that condition when presenting data. Water chemistry is assessed by collecting surface water sample(s) and estimating the concentration of major ions with a photometer in the field. These parameters are collected at one or more sampling locations within a spring. Data are presented only for the primary sampling location. Each perennial spring is somewhat unique, and there are not water quality standards specific to most perennial springs in Arizona. Where conditions exceed water quality standards for other surface waters (rivers, streams, lakes, and reservoirs), we note it, but the reader is advised that these standards were not developed for perennial springs. Our ongoing data collection at each spring will improve our understanding of the natural range in water quality and water chemistry parameters for a given site.
eDNA
An inventory of rare and invasive species and pathogens in perennial springs was implemented in WY2022 using environmental DNA (eDNA) techniques. Samples were preserved in ethanol prior to DNA extraction and analysis by the Goldberg Lab at Washington State University.
Target Organisms for eDNA Project:
- The pathogen chytrid fungus (Batrachochytrium dendrobatidis), a major threat to amphibians globally that is currently expanding in the American Southwest, but that has not been previously detected in Tuzigoot National Monument. Chytrid fungus is often carried by American bullfrog which have a degree of resistance to the pathogen.
- Ranaviruses, pathogens that can infect amphibians and produce 90–100% mortality in tadpoles and adults and can persist in affected wetlands. Ranaviruses have not been previously detected at the park, although American bullfrog is a known vector of ranaviruses into wetland ecosystems.
- The native amphibian Chiricahua leopard frog (Rana chiricahuensis), a federally designated threatened species whose historic range includes Tuzigoot National Monument, though the current known range and critical habitat is south of the park (Schmidt et al. 2005).
- The native amphibian lowland leopard frog (Rana yavapaiensis), a species of conservation concern, which has been historically found within the park but has not been detected recently (Schmidt et al. 2005).
- The native aquatic snake northern Mexican garter snake (Thamnophis eques megalops), a federally designated threatened species that is known to occur within Tavasci Marsh (AZGFD, personal communication). Designated critical habitat includes the nearby Verde River, including the reach throughout the park.
- The native mammal jaguar (Panthera onca), a federally designated endangered species, which was historically found within the park, although current designated critical habitat for jaguar recovery is located well south of the Verde Valley.
Reference: Schmidt CA and Others. 2005. Vascular plant and vertebrate inventory of Tuzigoot National Monument. U.S. Geological Survey (USGS) Open-File Report. 2005-1347. USGS, Southwest Biological Science Center, Sonoran Desert Research Station, Univ. of Arizona. Tucson, AZ.

NPS
Recent Findings at Shea Spring
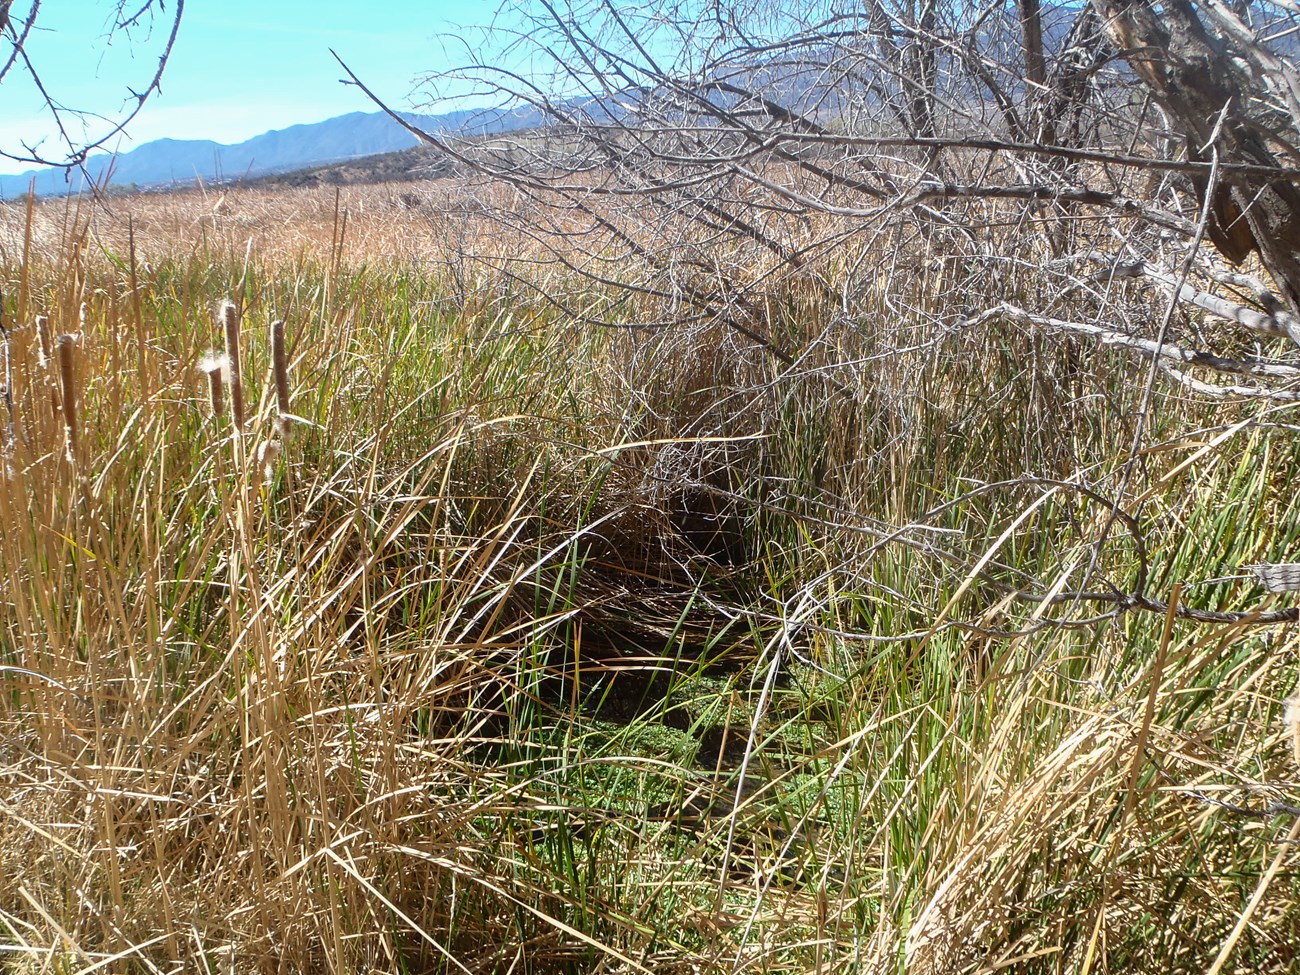
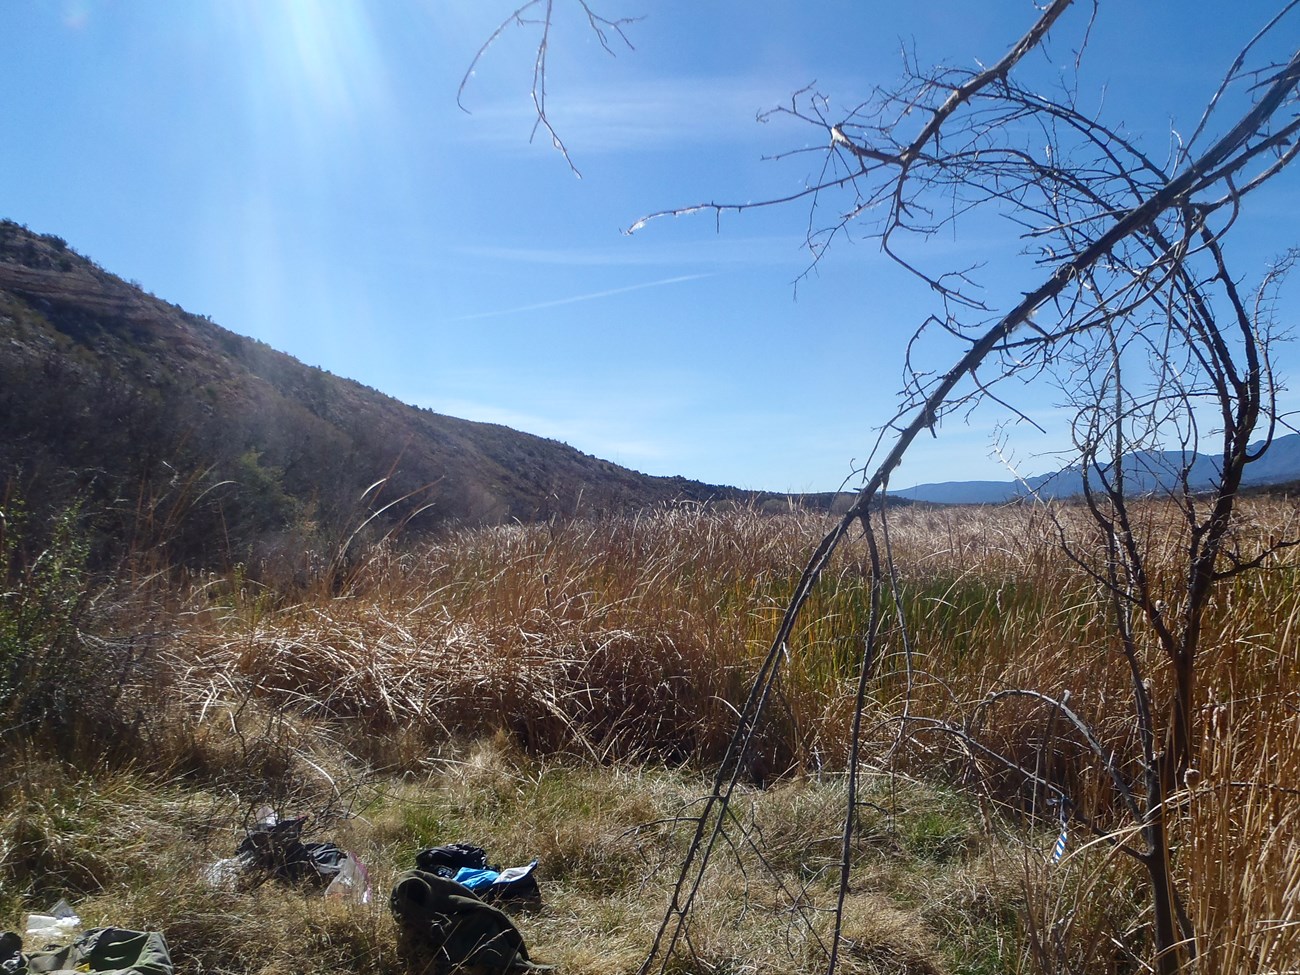
Shea Spring is a limnocrene spring (emerges as one or more lentic pools) consisting of two large (car-sized) pools connected by a channel. When characterized on 22 March 2022, the water was cool and clear, with visible jets of water bubbling out of the silty substrate of both pools. Small fish and aquatic insects were abundant in both pools, which also contained floating vegetation and algae and were ringed by dense stands of cattails. In addition to supporting the local spring ecosystem, Shea Spring appears to contribute substantial water to the surrounding Tavasci Marsh ecosystem (NPS 1992; Figure 5.) that comprises most of the lowlands within Tuzigoot National Monument. Descriptions and other characteristics of springs are updated every five years.

NPS
Site Condition
Consistent with past years, the spring was “slightly disturbed” from intensive wildlife use of the Shea Spring and associated pools —digging, numerous tracks and other sign. Similar to previous years, we rated the spring as “slightly disturbed” in WY2022 from beaver activity in the form of chewed and downed small trees in the vicinity of the spring, though there was no evidence of nearby dam construction.
As in past years (2017–2021), we did not detect crayfish or bullfrogs (non-native invasive aquatic animals), although the latter are known to be well-established in the surrounding marsh (Schmidt et al. 2005). Scattered patches of the non-native annual grass red brome (Bromus rubens) were noted around the spring as in previous years, and a dense matrix of Bermudagrass (Cynodon dactylon) was observed under tree and shrub canopies. The non-native perennial grass tall fescue (Schedonorus arundinaceus) was noted in scattered patches along the banks of the pools for the first time since monitoring began, as was the non-native forb watercress (Nasturtium officinale) in scattered patches on the surface of the two pools.
We detected several obligate wetland plant genera and families that were also recorded in previous years: sedges (Carex sp. and Cyperaceae), bulrush (Schoenoplectus sp.), horsetail (Equisetum sp.), and the ubiquitous cattail (Typhaceae).
Eight water samples were collected and filtered (0.45 µm mesh) from the two pools at Shea Spring, and an additional eight were collected throughout adjacent Tavasci Marsh on 22 March 2022 for eDNA analysis. Eight of the eDNA filters detected the presence of the non-native invasive American bullfrog (Rana catesbeianus), which has been observed within Tavasci Marsh (Schmidt et al. 2005) but not directly within Shea Spring. None of our other target organisms were detected. Data collection for eDNA continues at this site, and additional information will be provided in a future, more detailed report.
Water Quantity
The WY2022 visit occurred on 22 March 2022, and the spring had water. Temperature sensors indicated that Shea Spring was ‘wetted’ (contained water) for 173 of 173 days (100% of days) measured up to the WY2022 visit (Figure 6). In prior water years, the spring was wetted 55.2–100% of the days measured.

NPS
As in past years, there was no measurable discharge as surface waters were stagnant. Wetted extent data were not collected to minimize disturbance to the site.
Water Quality
Core water quality and water chemistry data were collected at the primary sampling location of Shea Spring. The values were within the range recorded in prior years (Tables 1 and 2), except for slightly higher values of chloride and slightly less magnesium than observed at Shea Spring previously (2017–2021).
Shea Spring Data Tables
| Sampling Location | Measurement Location (width, depth) |
Parameter | WY2022 Value (range of prior values) |
Prior Years Measured (# of measurements) |
|---|---|---|---|---|
| 001 | Center | Dissolved oxygen (mg/L) | 6.42 (6.20–7.20) |
2017–2021 (4) |
| 001 | Center | pH | 7.19 (6.06–7.47) |
2017–2021 (4) |
| 001 | Center | Specific conductivity (µS/cm) | 556.0 (549.0–677.4) |
2017–2021 (4) |
| 001 | Center | Temperature (°C) | 19.0 (19.4–20.3) |
2017–2021 (5) |
| 001 | Center | Total dissolved solids (mg/L) | 361 (357–364) |
2017–2021 (4) |
| Sampling Location | Measurement Location (width, depth) |
Parameter | WY2022 Value (range of prior values) |
Prior Years Measured (# of measurements) |
|---|---|---|---|---|
| 001 | Center | Alkalinity (CaCO3) |
250 (185–255) |
2017–2021 (4) |
| 001 | Center | Calcium (Ca) |
36 (40–54) |
2017–2021 (4) |
| 001 | Center | Chloride (Cl) |
44 (17–32) |
2017–2021 (4) |
| 001 | Center | Magnesium (Mg) |
23 (29–43) |
2017–2021 (4) |
| 001 | Center | Potassium (K) |
2.4 (1.9–2.2) |
2017–2021 (4) |
| 001 | Center | Sulphate (SO4) |
0 (0–5) |
2017–2021 (4) |
Report Citation
Authors: Kara Raymond, Andy Hubbard, Cheryl McIntyre
Raymond, K., A. Hubbard, and C. McIntyre. 2024. Climate and Water Monitoring at Tuzigoot National Monument: Water Year 2022. Sonoran Desert Network, National Park Service, Tucson, Arizona.
