Last updated: March 4, 2024
Article
Historical and Future Climate Patterns at Capitol Reef National Park: Some Biological Implications
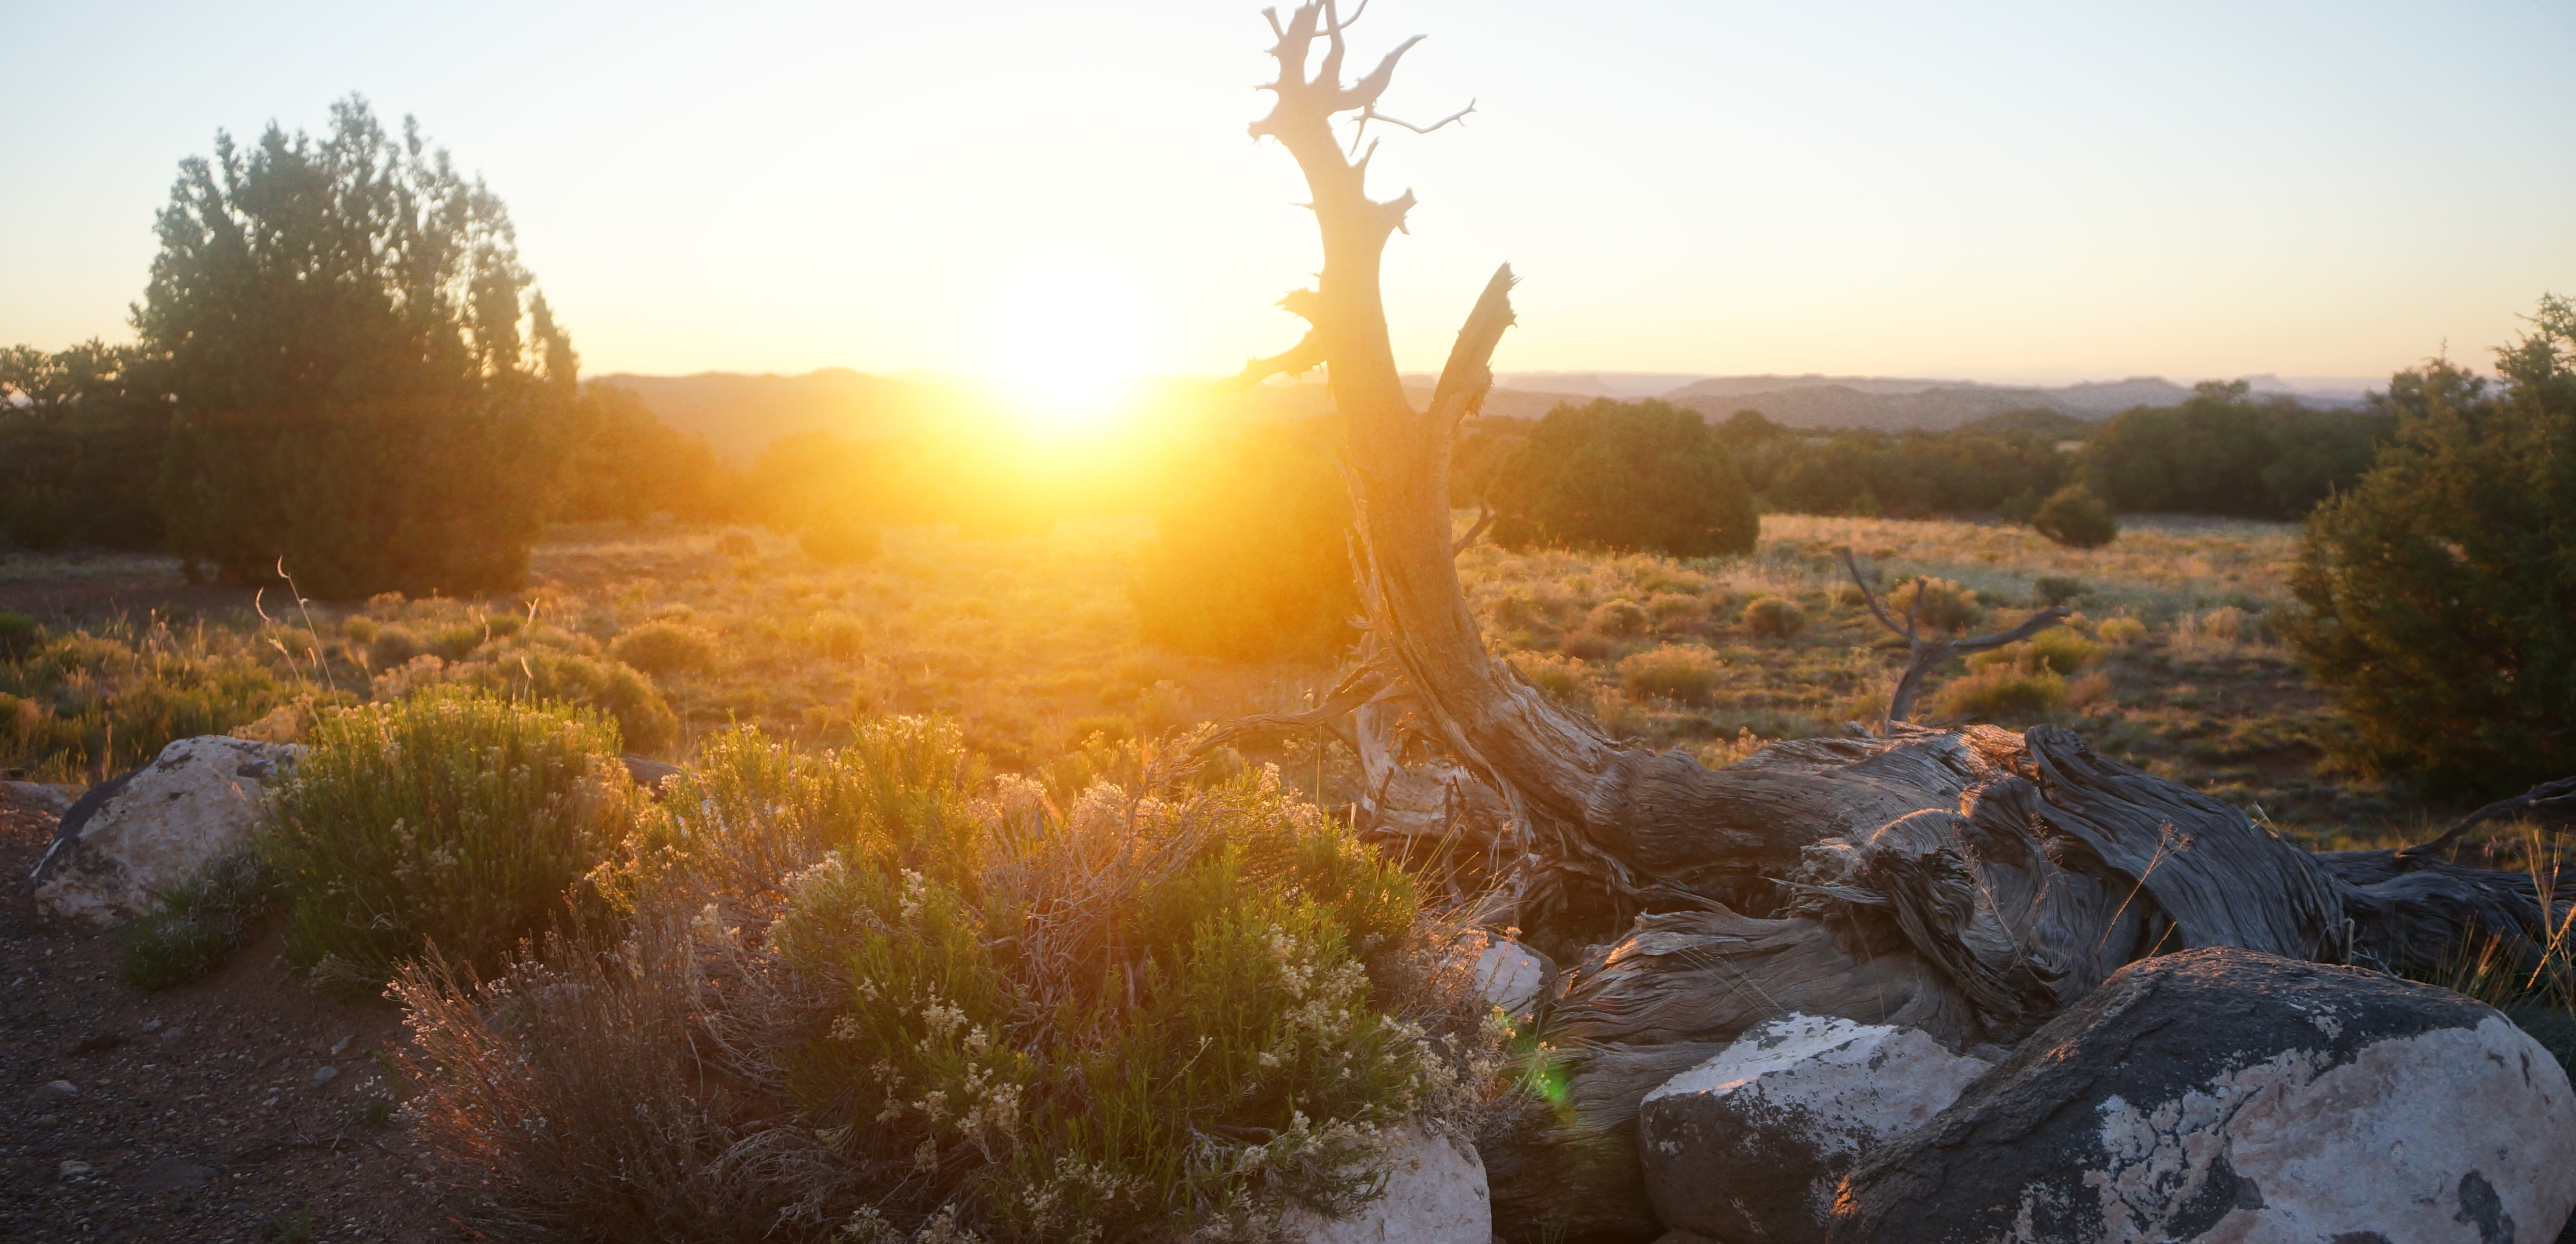
Capitol Reef National Park. NPS/Amy Washuta
Introduction
Climate change has the potential to profoundly alter national parks, with potential impacts to both natural and cultural resources (Monahan and Fisichelli 2014; Tercek et al. 2021; Hart 2021; Hart et al. 2023). This article compares historical climate patterns at Capitol Reef National Park (NP) to the range of conditions anticipated for the late 21st century, providing park managers with important insights for climate-change planning efforts.
During this time of unusually rapid change (Pörtner et al. 2022), proactive management is more likely to be successful than reactive management, which merely responds to crises as they arise. Planning processes like Climate Smart Conservation and Planning for a Changing Climate use scenario-based methods that consider multiple different climate futures—and potential impacts—based on long-term monitoring and climate projections. They depend on a clear understanding of climate exposure—the magnitude and direction of ongoing climate changes—that includes both the changes that have occurred so far and what we might expect in the future (Figure 1, Step 2).
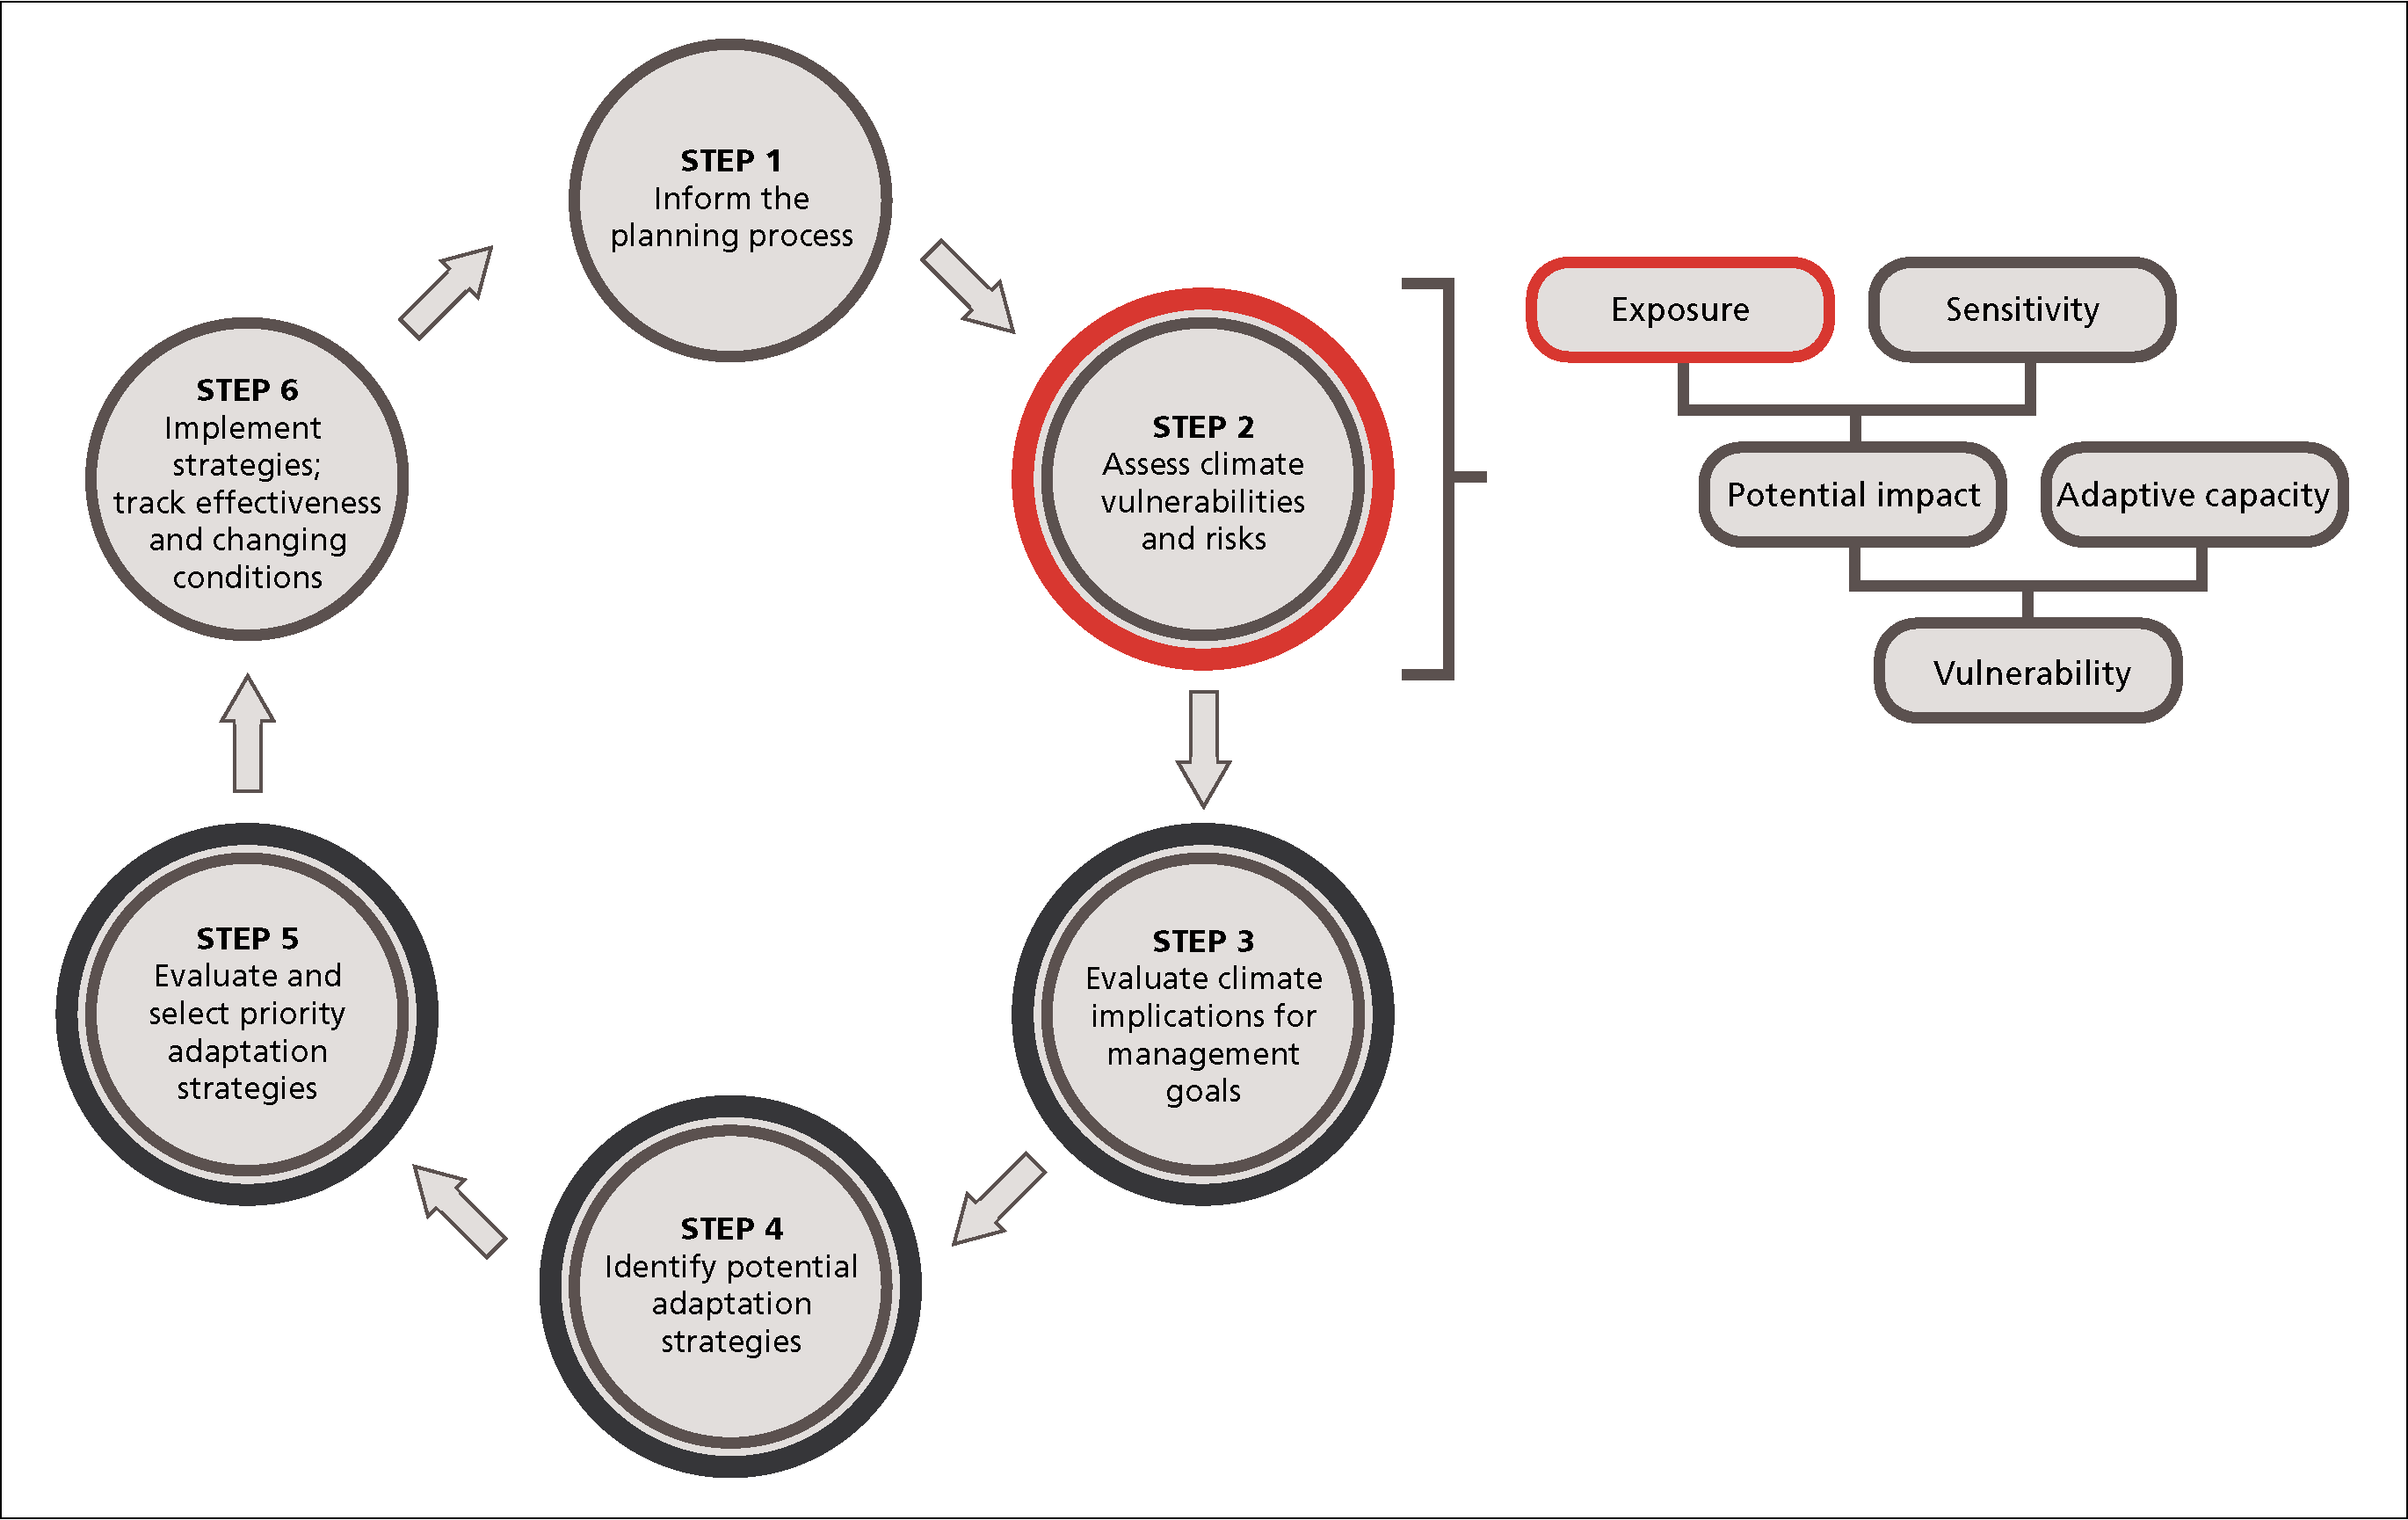
Figure 1. Climate-change planning process. Because scientists cannot predict exactly how much the future climate will warm, more than one plausible set of future climate conditions are considered at steps 2–5, as indicated by the concentric circles. Adapted from graphics produced by the National Wildlife Federation and National Park Service.
In future years at Capitol Reef National Park:
- There will be 70–80 fewer days with freezing temperatures. This will make the cold season, with days below freezing (32°F), 1/3 shorter than anything seen historically.
- There will be 60–90 more days with temperatures above 90°F, making these extremely warm days at least twice as frequent as in the most extreme historical year.
- Seasonality will become even more pronounced in the future. Dry times will likely get even drier under the driest projection. Wet times get even wetter under the wettest projection.
- All of these changes could affect the competitive balance among plant species.
What Can Climate Projections Tell Us about the Future?
Climate projections are based on complex computer models of Earth’s atmosphere and geological systems. Unlike weather forecasts, which typically extend only a few days or months in the future, climate projections extend decades into the future. They don’t predict the temperature or rainfall on a particular day or month. Instead, they forecast long-term (decades to centuries) trends in average annual and seasonal patterns.
Of the 26 climate projections available (see Tercek et al. 2021; 2023), all 26 call for some amount of future warming at Capitol Reef. But there is disagreement on whether precipitation will increase or decrease.
To capture the range of conditions projected for the late 21st century (2070–2099), we present the wettest (greatest amount of biologically available water) vs. driest (least available water) projections in this article. Future conditions will likely be somewhere between these two projections.
A Hotter Future
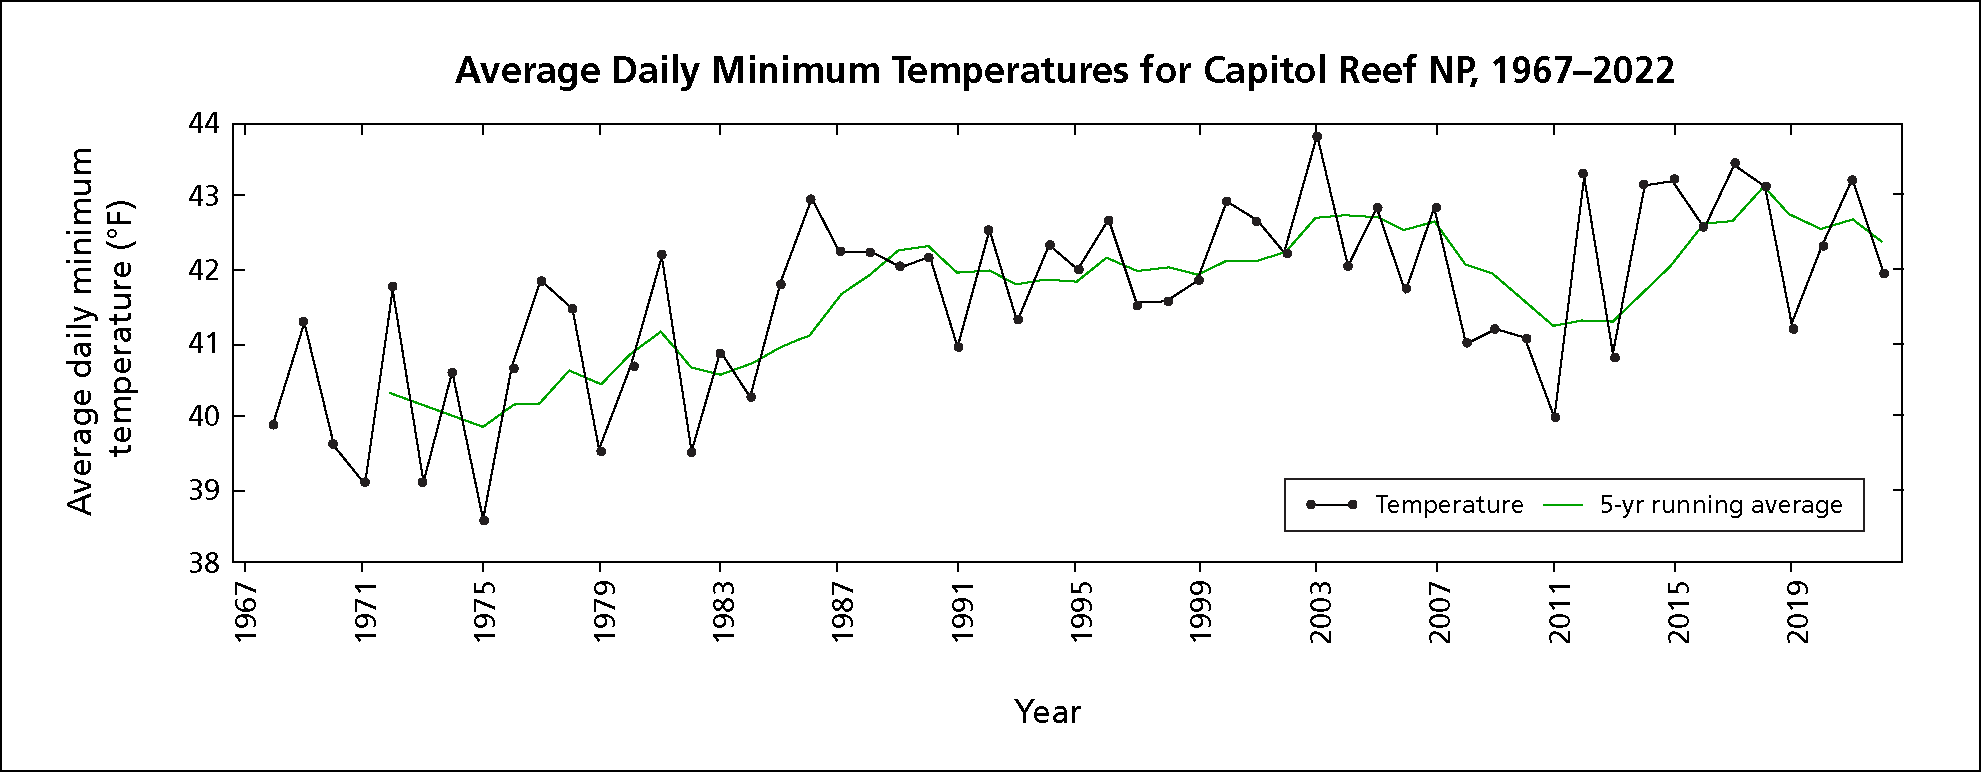 Figure 2. Annual averages of night-time low temperatures at the Capitol Reef National Park weather station, 1967–2022.
Historical patterns
Daytime highs did not show a strong trend during 1967–2022, but nighttime lows increased roughly 2°F (Figure 2). Similar patterns were seen at other weather stations in the area (e.g., Natural Bridges National Monument and Canyonlands NP).
Future patterns
Over time, the two future projections call for roughly 10–12°F of warming in annual average temperature by late century compared to the historical average (Figure 3). By 2071, this would start to bring the average temperature at Capitol Reef National Park (53.9°, historically) closer to that currently seen in Charlotte, NC (61°F), Atlanta, GA (63°F), and Nairobi, Kenya (64°F) (Climate Analyzer 2023; Wikipedia 2023).
This level of warming would cause sharp decreases in the number of days per year below freezing (32°F) and increases in the number of days above 90°F (Figure 4) compared to historical averages. Under both projections, the late-century median number of days below freezing (wet future: 71 days, dry future: 77 days) is 1/3 lower than the lowest historical count of freezing days (115 days in 2014, Figure 4A). The late-century median number of days above 90°F (wet future: 92 days, dry future: 110 days) is about twice the largest historical count (47 days in 2002, Figure 4B).
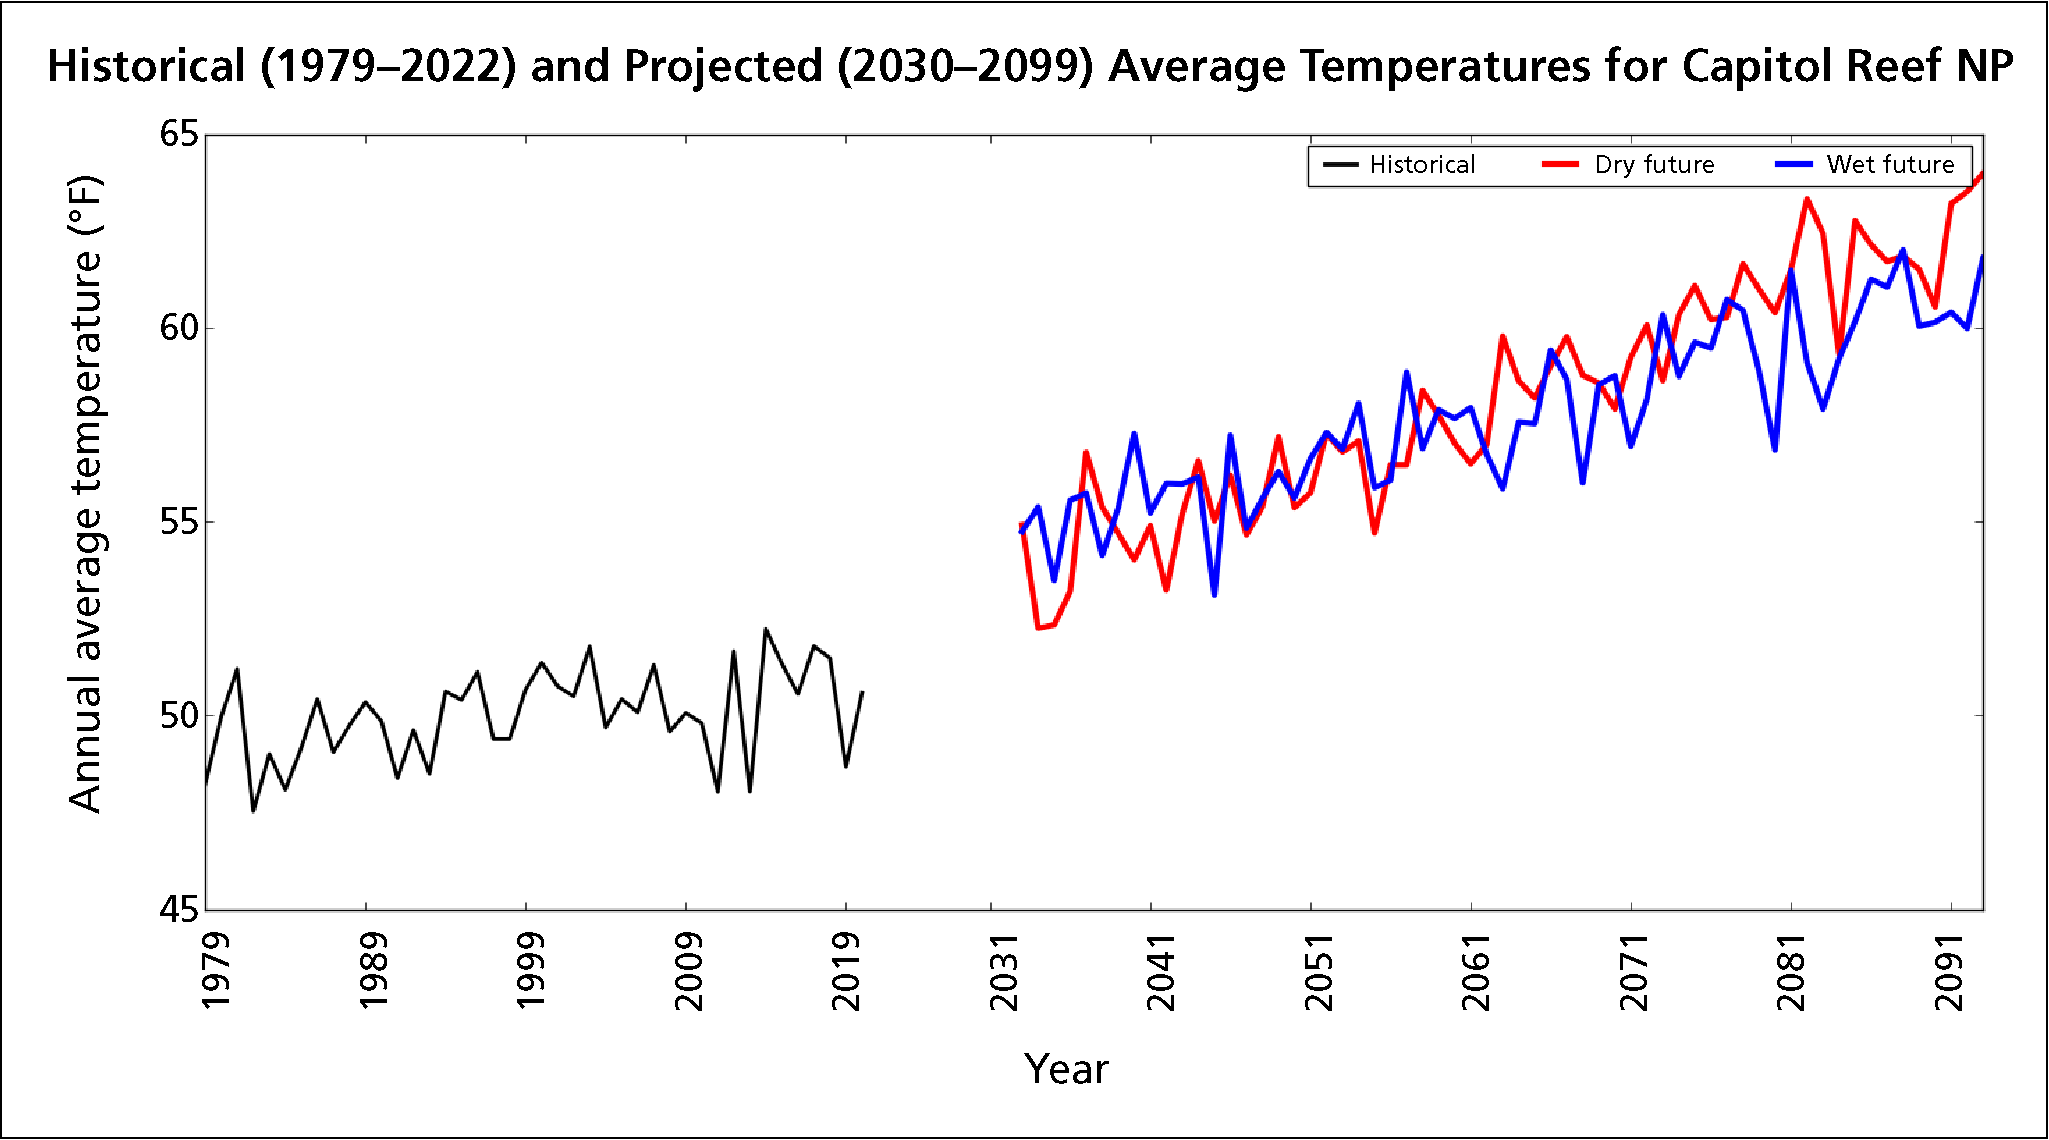
Figure 3. Historical annual average temperatures (annual average of daily average temperatures) and two future projections that bracket the range of wettest vs driest futures at Capitol Reef National Park (park centroid, 38.38, -111.28) over time. Historical data = GRIDMET, Wet Future = MACA downscaled CanESM2 RCP 8.5. Dry Future = IPSL-CM5A-LR RCP 8.5. Data source: Abatzoglou (2012, 2013).
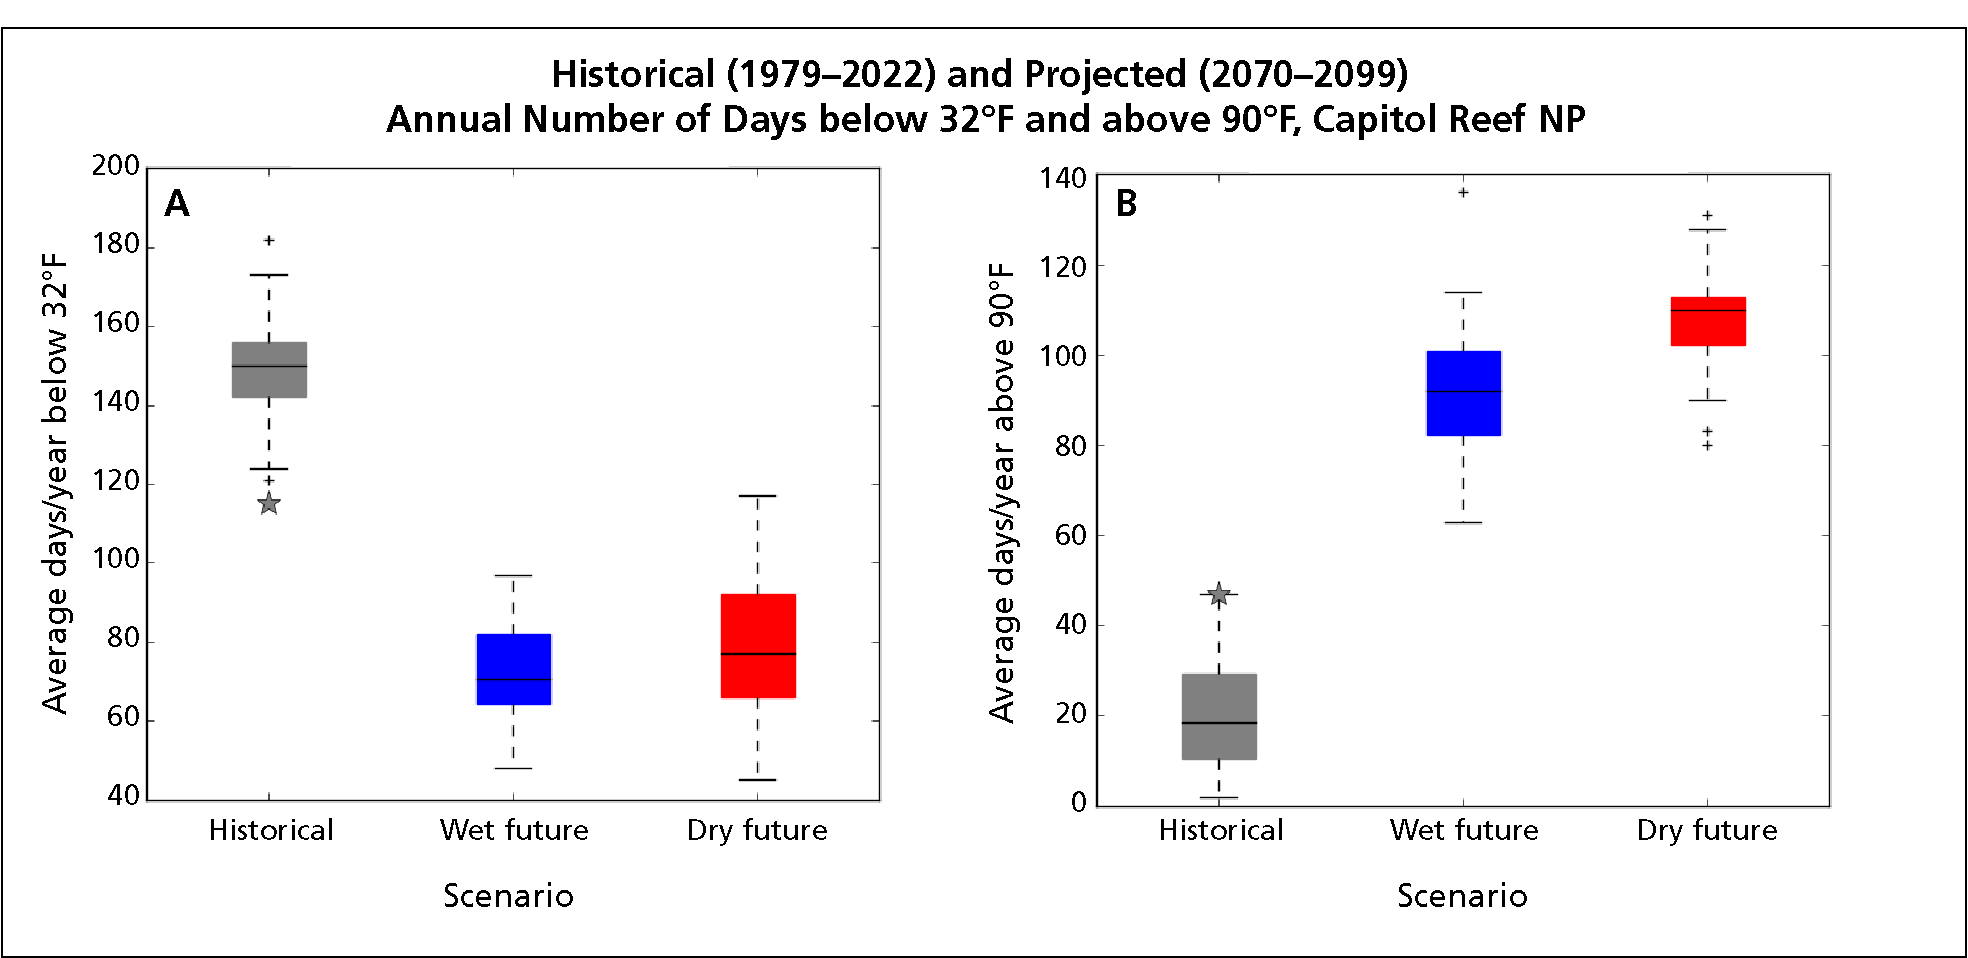
Figure 4. (A) Historical vs. projected late-century average annual number of days per year below freezing. The grey star marks the smallest count during 1979–2022 (115 days in 2014). (B) Historical vs. projected late-century average annual number of days above 90°F. The grey star marks the greatest count during 1979–2022 (47 days in 2002). Data sources and location are the same as in Figure 3.
Changing Water Availability
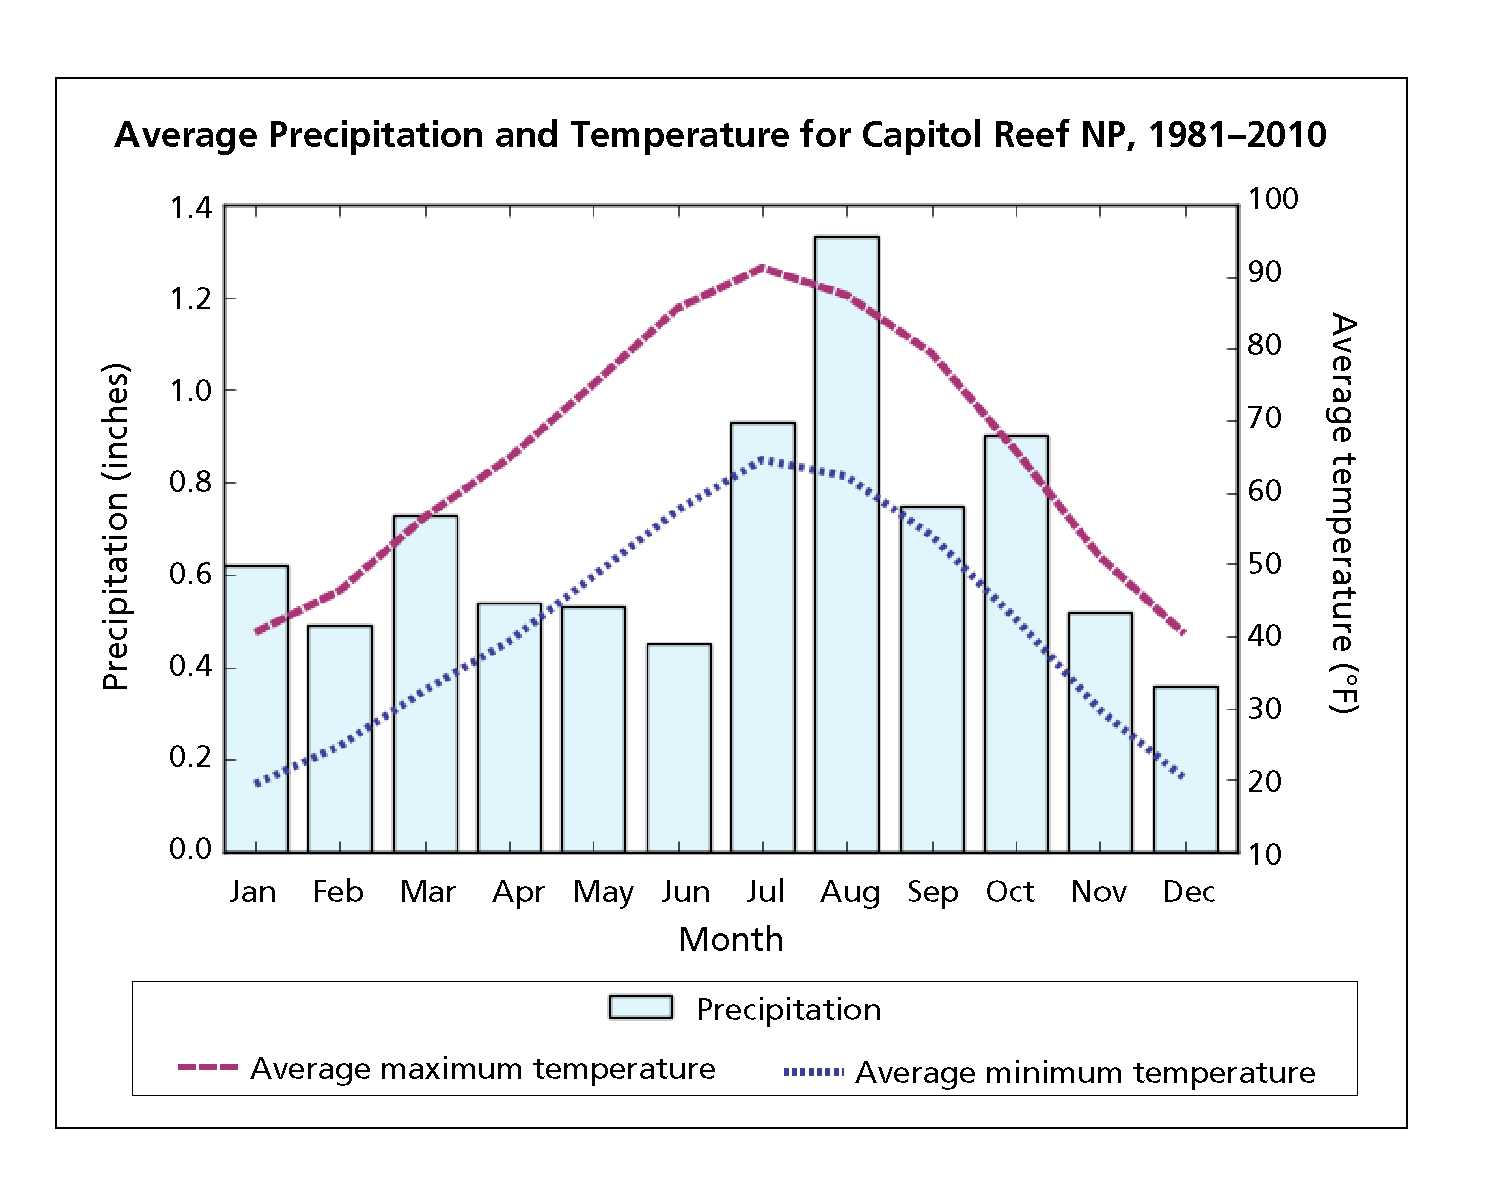 Figure 5. Seasonal patterns in temperature and precipitation at the park headquarters weather station based on 30-year normals for 1981–2010. July–August had the most precipitation.
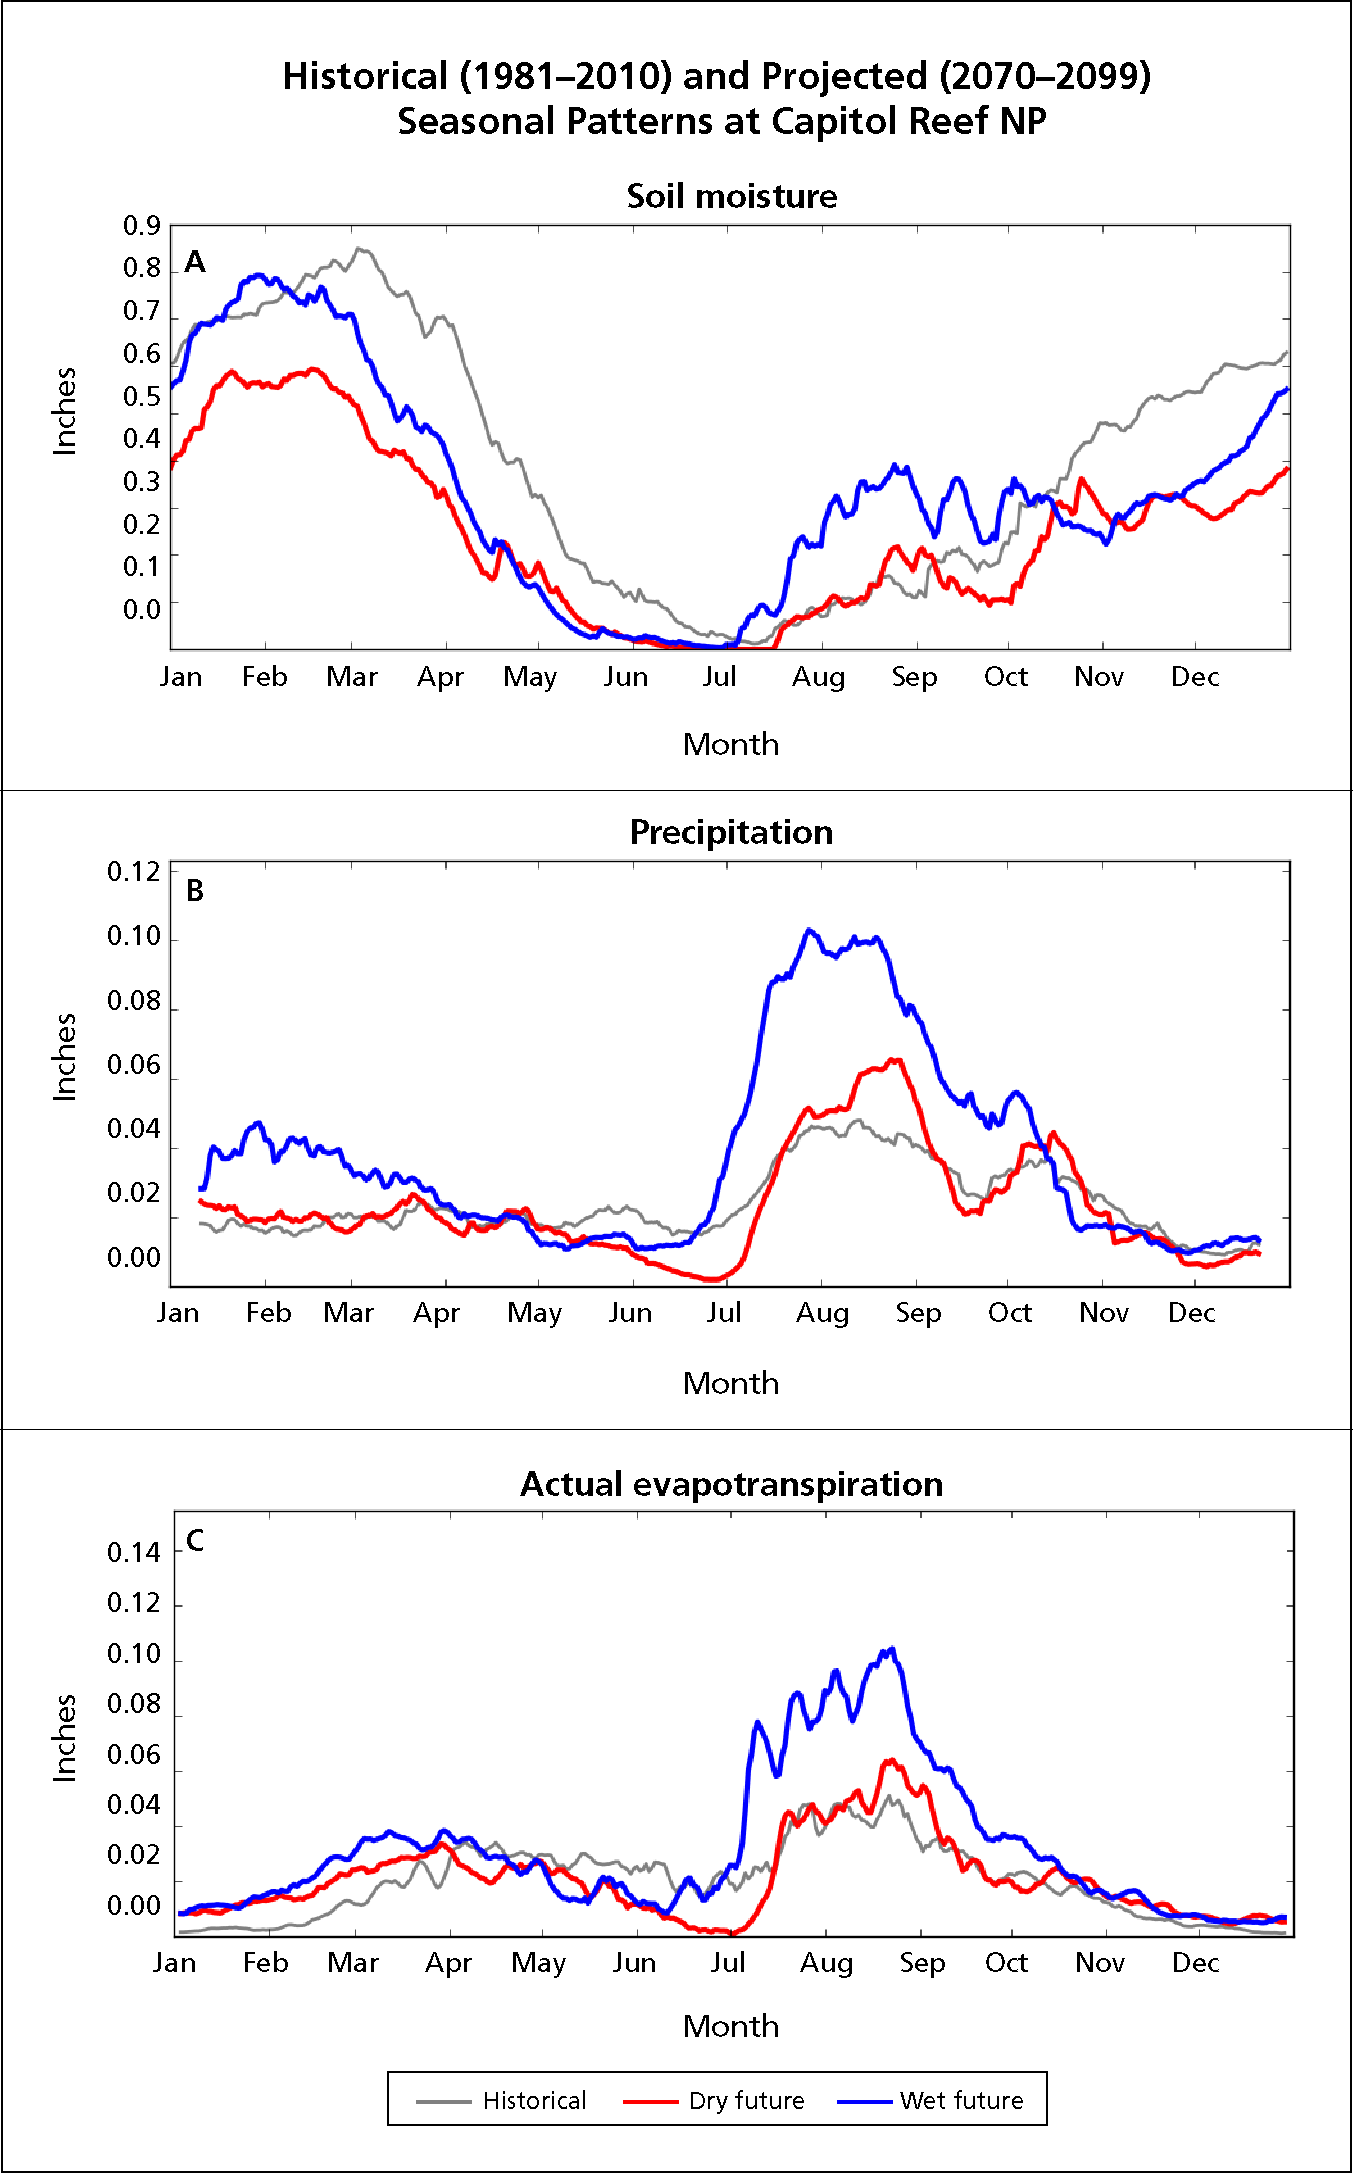 Figure 6. Historical (30-year normals for 1981–2010) seasonal patterns in actual evapotranspiration (combined evaporation and plant water use), soil moisture, and precipitation compared to projected (2070–2099) seasonal patterns. Data source: Tercek and others (2021, 2023).
Future trends in annual precipitation are uncertain, but it is likely that seasonal patterns of water availability will change in clearly understood ways. This is due to the overriding effects of rising temperature regardless of projected changes in precipitation.
Historical patterns
At park headquarters, total annual precipitation showed no clear increasing or decreasing trend during 1967–2022. Historically, July–October had the greatest precipitation (Figure 5). Because June is the second-driest month of the year—and because warmer temperatures in summer cause more evaporation and transpiration—soil water availability was historically at its lowest point in June–August (see gray lines, Figure 6).
Future patterns
Soil moisture. All 26 of the alternative projections—even those with annual precipitation increases—have soil moisture below historical levels during at least some of the warmest (April–October) months (Figure 6A), because warmer temperatures remove water from the soil more quickly. The wettest future (blue line) shows a marked increase in soil moisture during the summer monsoon and fall seasons.
Precipitation. As in the past, July–August will likely continue to have more precipitation than the other months (Figure 6B). In some projections, these months will see a significant increase (e.g., Figure 6B, blue line), potentially resulting in more frequent and severe floods.
Plant growth. These future changes in moisture availability will change the season in which plants are best able to grow, as measured by actual evapotranspiration, which is a combined estimate of evaporation and plant water use. Spring and fall become more favorable for plant growth than mid-summer in some projections (Figure 6C). For example, the driest projection (Figure 6C, red line) has spring and fall peaks, with a growth pause in summer. In the wettest projection (Figure 6C, blue line), plant growth (actual evapotranspiration) is similar to historical levels during the early part of the year (until July) but greatly increased in the fall. This future extension of the growth season would be due to temperatures during the late fall rising to plant-friendly levels above 40°F, with additional plant-available water in the soil.
Biological Implications and Management Uses
The climate projections provided here help us understand the vulnerability of vegetation to climate change at Capitol Reef National Park, where the late 21st century (2070–2099) will be warmer than now. Despite any potential increases in precipitation, it will also likely be drier during at least some of the warmest months of the year (April–October).
As future warming interacts with changes in precipitation, the amount of water available for plants and animals will change. Any amount of warming will increase the amount of precipitation necessary to maintain current conditions. A large amount of warming will greatly increase evaporation and transpiration (water use by plants), resulting in far less plant-available water in spring months. Less warming will require a smaller increase in precipitation to maintain historically normal moisture levels.
All of these changes could affect the competitive balance among plant species. For example, annual grasses and deep-rooted shrubs might be favored because they have adaptations to mid-season drought. But water-sensitive species, like aspen and some perennial grasses, might decline.
In short, changes to vegetation in Capitol Reef National Park are likely, because the park’s future climate will be different than in the past. If current assemblages of native species are unable to adapt or migrate, they will likely perish, making room for different species adapted to the new conditions. Unfortunately, some of those species may be non-native invaders that are better-adapted to longer dry seasons.
Capitol Reef National Park is not alone. As climate conditions continue to change, the same will be true for many other parks and places across the western US. Understanding the projected changes in conjunction with biological vulnerabilities can help land managers to plan for what’s to come.
Contact
Literature Cited
Abatzoglou, J.T. 2013. Development of gridded surface meteorological data for ecological applications and modeling. International Journal of Climatology 33:121–131.
Abatzoglou, J.T., and T.J. Brown. 2012. A comparison of statistical downscaling methods suited for wildfire applications, International Journal of Climatology 32:772–780.
Climate Analyzer. 2023. Capitol Reef climate dashboard. http://www.climateanalyzer.us/cr_dash.
Cox, DTC, I.M.D. Maclean, A.S. Gardner, and K.J. Gaston. 2020. Global variation in diurnal asymmetry in temperature, cloud cover, specific humidity and precipitation and its association with leaf area index. Global Change Biology 26:7099–7111. https://doi.org/10.1111/gcb.15336.
Hart, S., K. Raymond, C.J. Williams, J. Johnson, J. DeGayner, and M.C. Guebard. 2021. Precipitation impacts on earthen architecture for better implementation of cultural resource management in the US Southwest. Heritage Science 9(143). https://doi.org/10.1186/s40494-021-00615-z.
Hart, S., K. Raymond, C.J. Williams, W.A. Rutherford, and J. DeGayner. 2023. Modeling earthen treatments for climate change effects. Heritage 6(5):4214–4226. https://doi.org/10.3390/heritage6050222.
Monahan, W.B., and N.A. Fisichelli. 2014. Climate exposure of US national parks in a new era of change. PLoS ONE 9(7):e101302.
Pörtner, H.-O., D.C. Roberts, M. Tignor, E.S. Poloczanska, K. Mintenbeck, A. Alegría, M. Craig, S. Langsdorf, S. Löschke, V. Möller, A. Okem, and B. Rama. 2022. Climate change 2022: Impacts, adaptation, and vulnerability. Contribution of Working Group II to the Sixth Assessment Report of the Intergovernmental Panel on Climate Change. Cambridge, U.K.: Cambridge University Press. https://doi:10.1017/9781009325844.
Tercek, M.T., D. Thoma, J.E. Gross, K. Sherrill, S. Kagone, and G. Senay. 2021. Historical changes in plant water use and need in the continental United States. PLoS ONE 16(9): e0256586. https://doi.org/10.1371/journal.pone.0256586.
Tercek, M.T., J.E. Gross, and D.P. Thoma. 2023. Robust projections and consequences of an expanding bimodal growing season in the western United States. Ecosphere 14(5):e4530. https://doi.org/10.1002/ecs2.4530.
Wikipedia. 2023. List of cities by average temperature. https://en.wikipedia.org/wiki/List_of_cities_by_average_temperature.
Tags
- capitol reef national park
- climate change
- climate patterns
- climate projections
- science
- climate
- climate change effects
- climate change science
- monitoring
- plants
- science and resource management
- ncpn
- northern colorado plateau network
- inventory and monitoring
- american southwest
- swscience
- climate change management
- climate change adaptation
- waterbalancecc
- inflation reduction act
