Last updated: September 3, 2025
Article
Vegetation Monitoring at Palo Alto Battlefield National Historical Park: Results for 2023
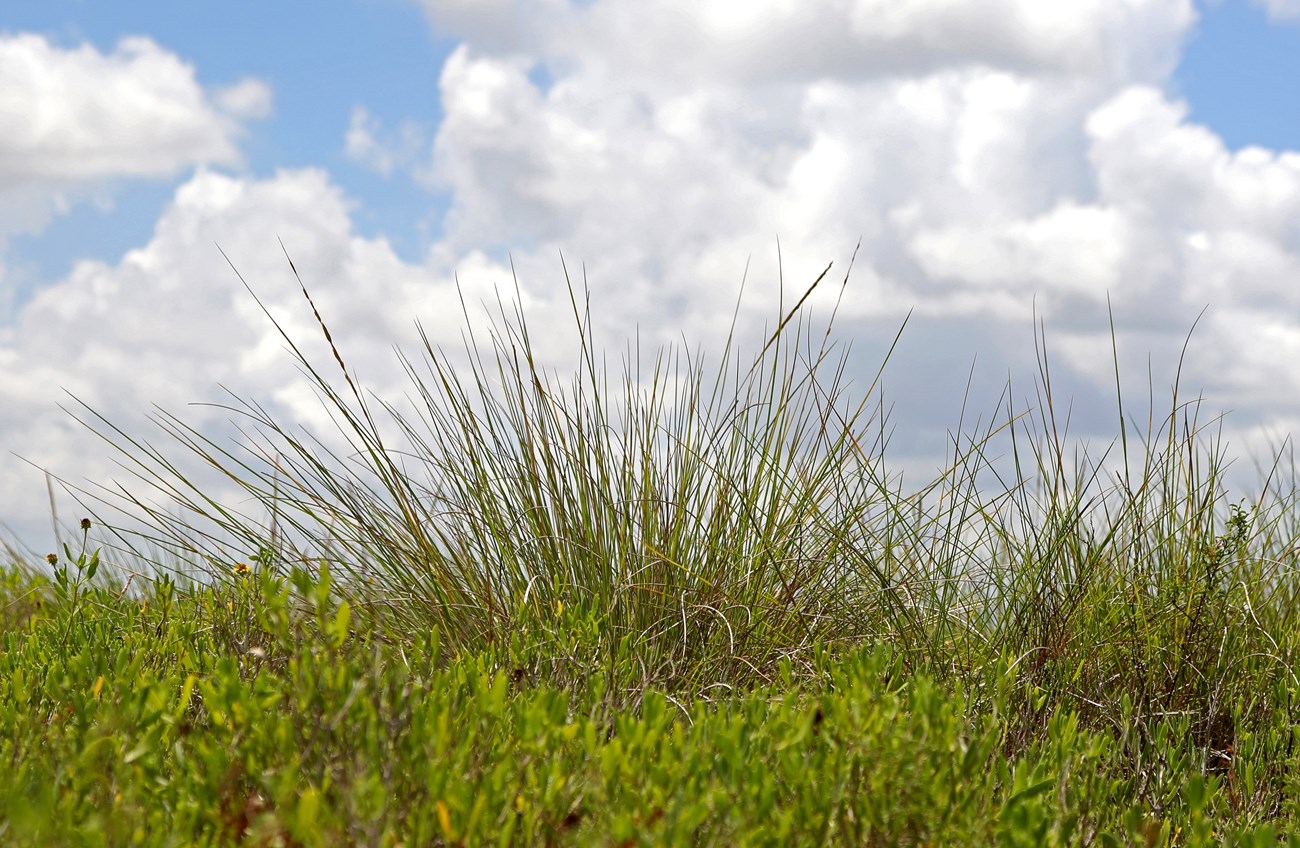
NPS/GULN
Summary and Key Findings
-
In the summer of 2023, the Gulf Coast Inventory and Monitoring Network completed the second round of vegetation monitoring in long-term plots at Palo Alto Battlefield NHP to track the health and condition of its grasslands, shrublands, and other plant communities. Due to the park’s location in the southernmost part of Texas within the Tamaulipan biotic province, the park contains many plant species unlikely to be found in any other national park property in the U.S.
- Ten vegetation monitoring plots were sampled in 2023, representing the park’s four broad habitat types:Intermittent Herbaceous Wetland, Salt Prairie, Mixed Prairie Savanna, and Loma Shrubland or Woodland.Prior to NPS ownership in the late 1990s, much of the park was subject to ranching or farming, and brush was routinely cleared from the park’s natural levee ridges, referred to as lomas. Even so, there remain several areas of relatively intact native vegetation, including expanses of cordgrass in the Salt Prairie and Tamaulipan thornscrub on lomas.
- Non-native grasses have long been introduced as forage for cattle throughout South Texas, and during the 2023 sampling event at Palo Alto Battlefield NHP, invasive grasses were prominent in most habitats of the park. Eight of the 10 I&M plots had at least one invasive grass species present, and five of these had more than 10% cover of invasive grasses. Two plots were particularly impacted, with over 55% invasive cover each. The three most prevalent invasive grasses in I&M plots were Kleberg bluestem, perennial cupgrass, and Guinea grass. Five other non-native species were present but less common.
- In contrast to invasive grasses, native grasses were sparse in most I&M plots. Only three plots had more than 10% native grass cover, belonging to either Intermittent Herbaceous Wetland or Salt Prairie habitat types. Plant survival in the Salt Prairie requires tolerance of the high salinity, poorly-drained clay soils, which excludes many native and non-native species alike. The two native grasses that dominated Salt Prairie plots were cordgrass, which forms dense, single-species stands, and shoregrass, which occupies salt flat openings within the Salt Prairie.
- Park managers are particularly interested in maintaining cordgrass dominance in the Salt Prairie, due to its importance to the historic battle viewshed. The majority of the Salt Prairie still features large cordgrass stands, but there are also degraded Salt Prairie sections where cordgrass is absent due to past farming and hydrological alterations. In the I&M sample, three of 10 plots were classified as Salt Prairie. Within them, cordgrass cover varied widely, averaging 43% in subsampling frames and ranging from 0 to 100%. Although no other habitat types had high cordgrass coverage, the species was present in seven of the 10 plots. Over the relatively short timeframe of 2019 to 2023, there was no evidence for major changes in this species’ cover. Supplementing measurements using near-ground, high resolution imagery has potential to increase the spatial scope of monitoring for this focal species.
Project Background
Throughout the National Park Service, plant communities and other key natural resources are monitored as indicators of environmental health by a nationwide program of 32 Inventory and Monitoring (I&M) Networks. The Gulf Coast I&M Network covers eight National Park Service (NPS) units in the southeastern U.S. and Texas. The network's terrestrial vegetation monitoring program is carried out in all eight parks, with the goal of measuring the health and condition of key plant communities repeatedly over time. Specific objectives include documenting status and change in (1) richness of native and non-native species; (2) percent cover and frequency of key species or growth forms (e.g., graminoids or shrubs); and (3) the health and regeneration of forests. The network's vegetation monitoring program follows a published protocol (Carlson et al. 2018) that is largely consistent with other I&M networks in the eastern U.S.
The Gulf Coast I&M Network conducts vegetation monitoring fieldwork once every four years in each park. This article presents a brief project overview and key findings from the 2023 I&M vegetation monitoring event in Palo Alto Battlefield National Historical Park (NHP), which was the second round of sampling for the park (see Carlson [2020] for initial summary report). A Supplementary Materials document provides the full species list as well as several supporting tables and figures. All current and past reports, as well as raw data exports, can be found through the online project repository.
Study Area
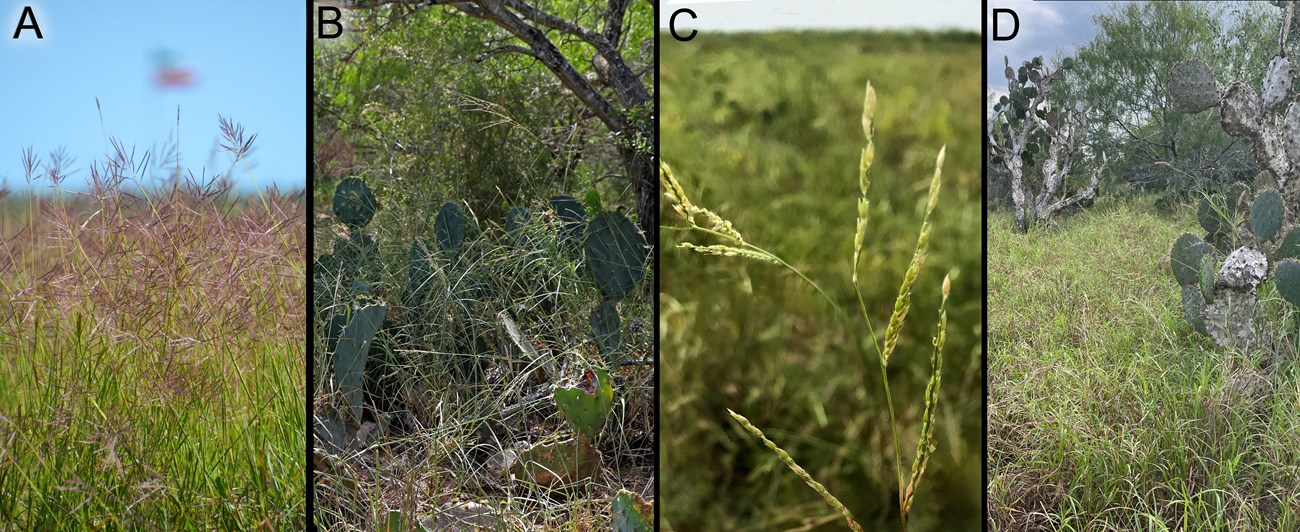
Palo Alto Battlefield NHP is a 735 hectare [1,815 acre] park located in Brownsville, Texas, on the site of the Battle of Palo Alto in 1846. The park features a Visitor Center, trails through the battlefield site, wildlife viewing opportunities, and a variety of plant communities characteristic of the South Texas coastal plain and the Tamaulipan Biotic Province. The park’s namesake battle took place in an open expanse of salt prairie, which at the time featured wet soils, marshy or pond-like depressions, and large stands of cordgrass (Spartina spartinae). Prolonged flood events and high water tables are now rare, however, due to changes in the region’s hydrology (Lonard et al. 2004, Cooper 2013). These hydrological shifts, in combination with cattle grazing and farming through the 1990s, have reduced cordgrass abundance, favored expansion of invasive grasses (e.g., Figure 1), increased coverage of the native honey mesquite tree (Prosopis glandulosa), and degraded natural plant communities to varying degrees.
Even with this long history of human impacts, there nevertheless remain several areas of native vegetation that appear relatively intact and unmodified, including lowland sections of salt prairie and diverse, upland assemblages of thorny shrubs and cacti (Figure 2), known as Tamaulipan thornscrub. Other areas are undergoing natural recovery or have been targeted by restoration programs, such as brush removal and cordgrass planting in salt prairies. Across this wide spectrum of land use histories and recovery trajectories, long-term vegetation monitoring plots allow NPS staff to track how communities change over time, for all major plant communities within the park.
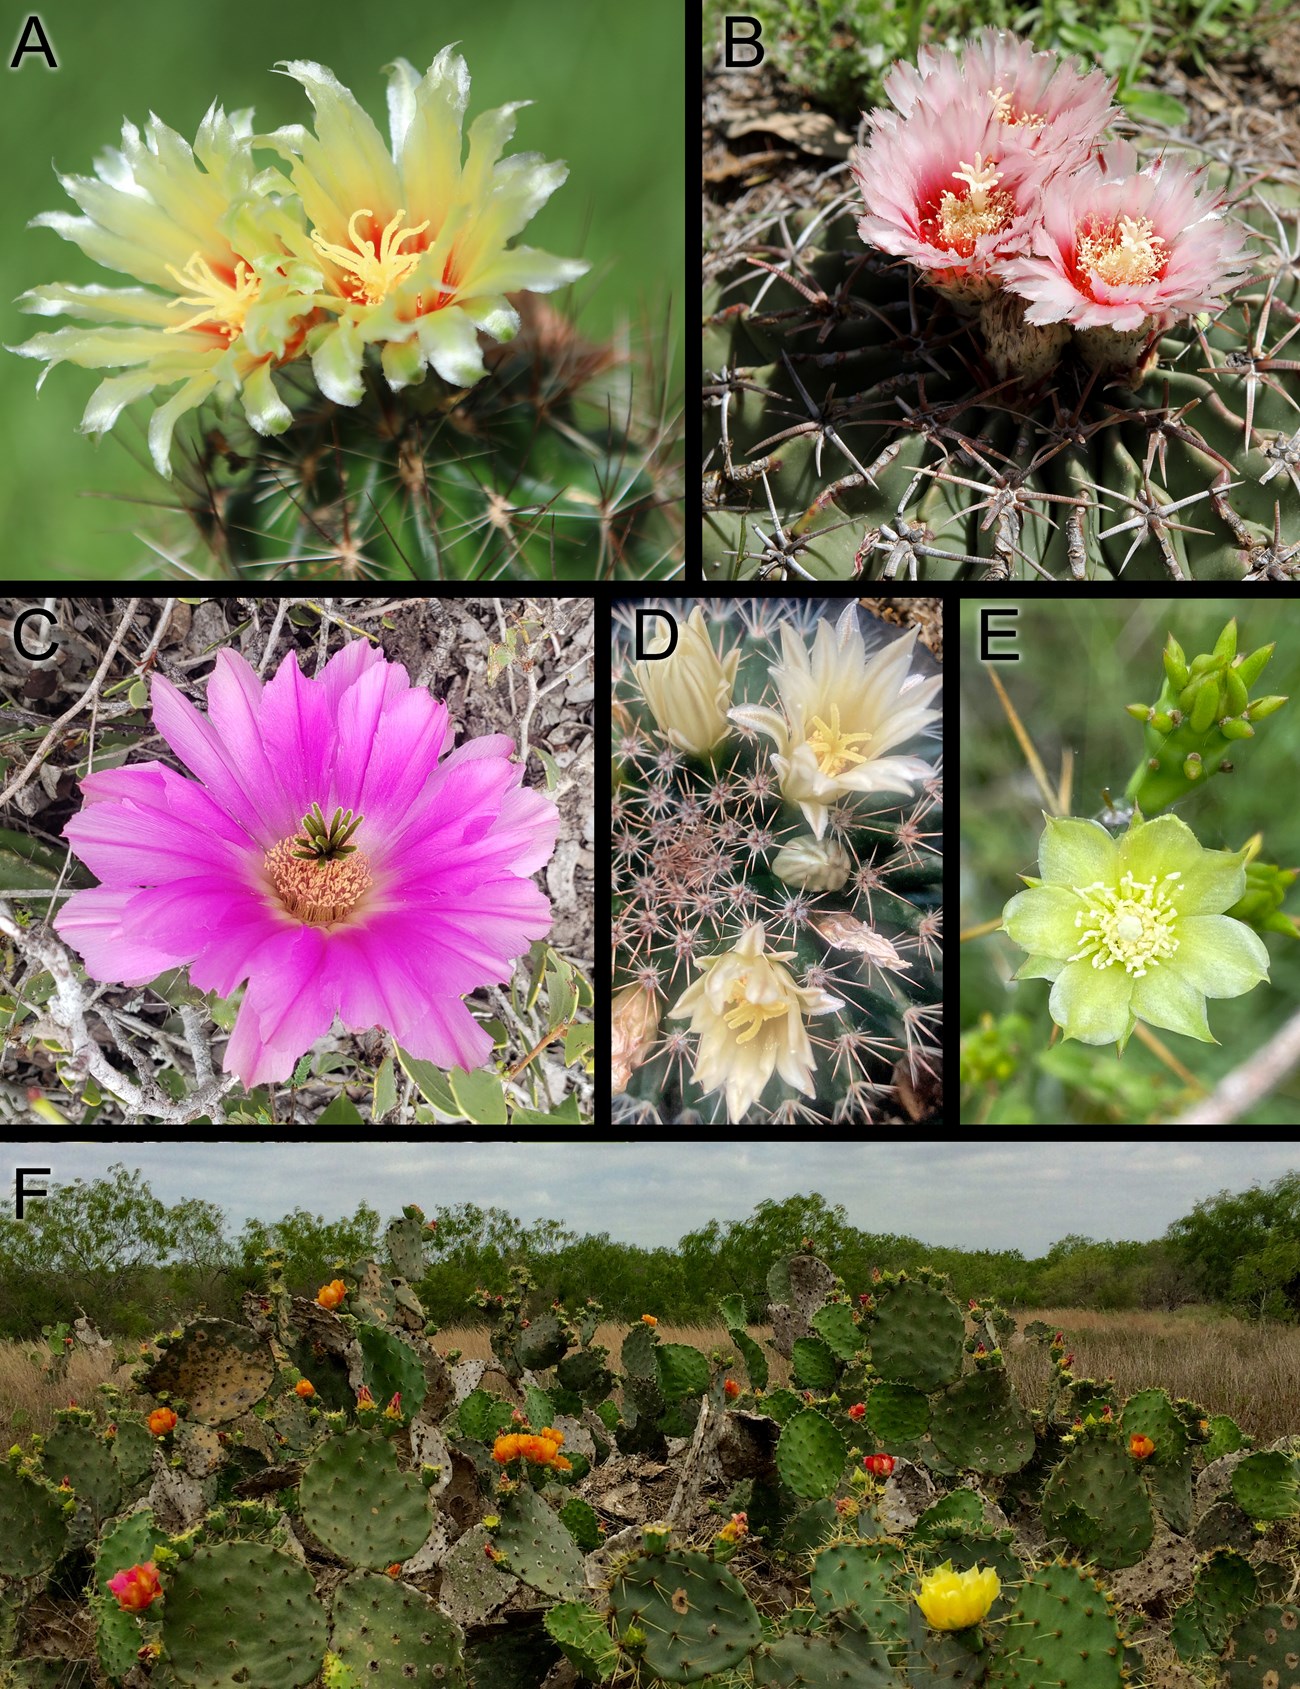
Photo credit NPS/Lee Bragg for (C); rest NPS/Jane Carlson. See Supplementary Materials for scientific names of cacti.
General Vegetation Features
The park’s major plant communities are a function of its subtle gradients in elevation, ranging from 3 to 6.8 meters (NAVD 88). At the park’s lowest elevations, there are historic riverbeds and river meanders, called resacas, which no longer serve as active channels but still may contain water and wetland plants. Outside of these channels and depressions, there are broad, low-elevation expanses with flood-prone, saline soils where salt prairie and salt flat communities intermix. Salt prairies are dominated by dense stands of cordgrass, whereas salt flats contain a sparser mix of succulents and other herbaceous plants, including sea ox-eye daisy (Borrichia frutescens) and shoregrass (Monanthochloe littoralis). Along the margins of the historic river channels, there are natural levee ridges called lomas, which are the highest elevation areas in the park today. The lomas have silty clay loam soils and are typically dominated by the woody shrubs characteristic of Tamaulipan thornscrub or by small-statured trees like honey mesquite. The transitional area between low-lying flats and upland lomas is the savanna-like ecotone, containing a mix of herbaceous prairie species, shrubs, prickly pear cactus (Opuntia engelmannii), huisache (Vachellia farnesiana), and honey mesquite.
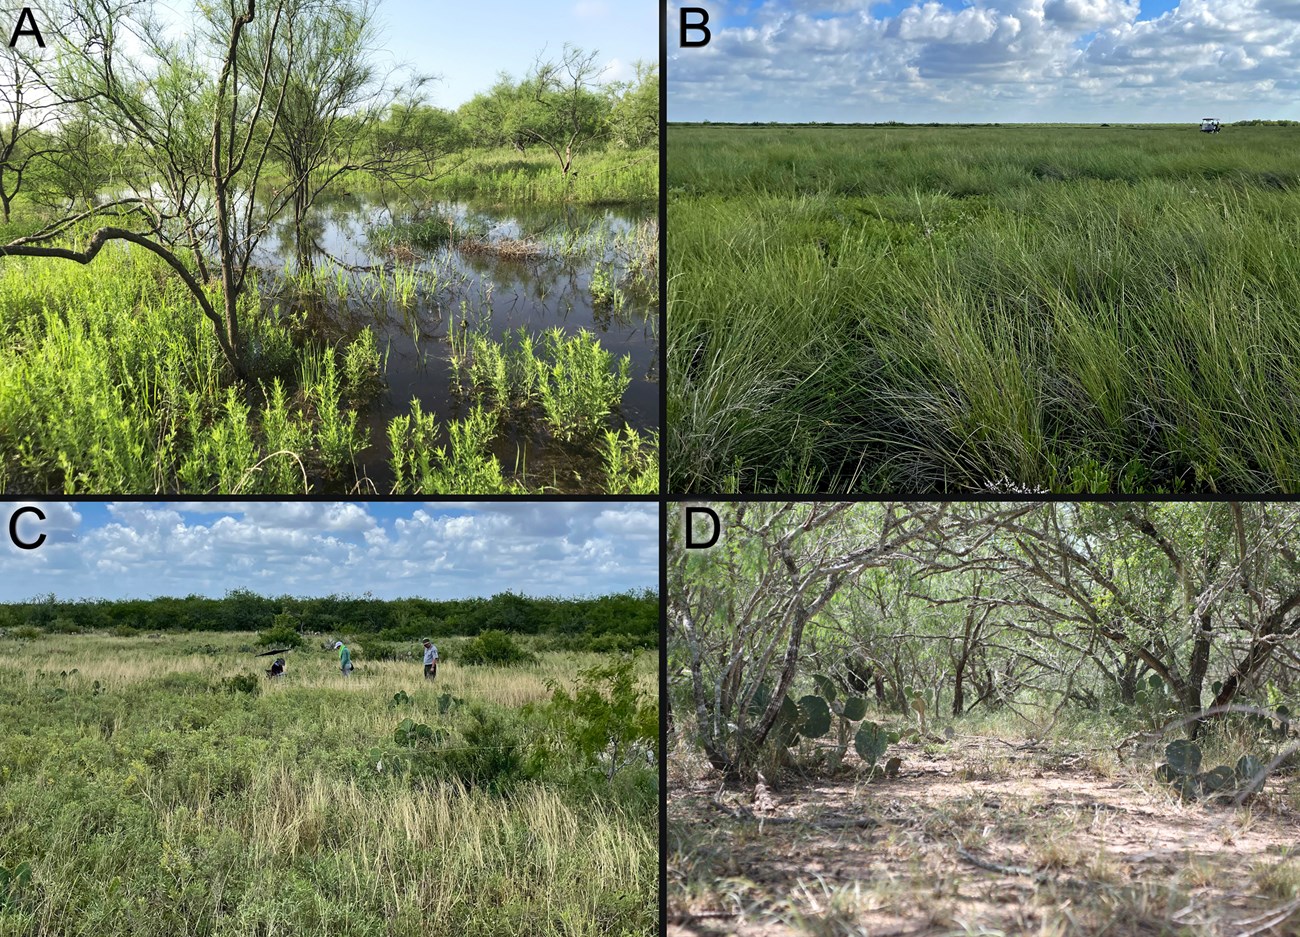
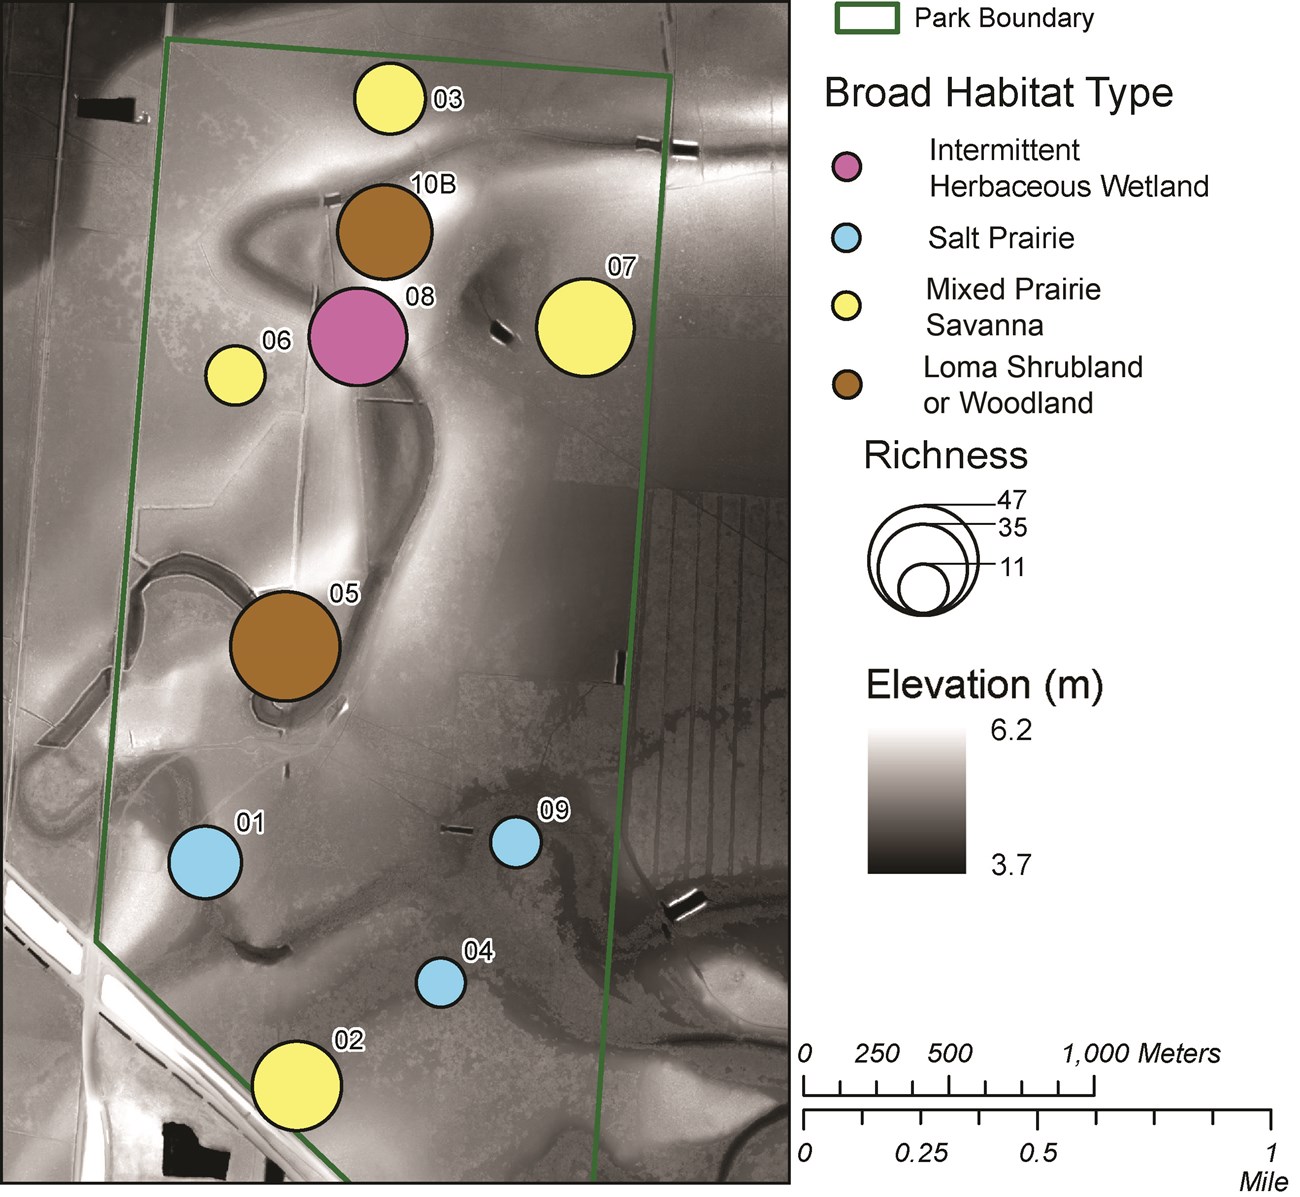
The long-term plots in this study are representative of the park’s major plant communities, organized into the following four broad habitat types: Intermittent Herbaceous Wetland in resacas; Salt Prairie, including both the cordgrass prairie and salt flats communities; Mixed Prairie Savanna; and Loma Shrubland or Woodland (Figure 3). Although these plant communities are generally well-described and their locations within the park are known (e.g., Farmer 1992, Richards and Richardson 1993, Haecker et al. 1994, Ramsey 2006), the park currently lacks a formal U.S. National Vegetation Classification (USNVC) map or list of USNVC plant associations.
Each of four broad habitat types on the park played a role during the 1846 Battle of Palo Alto. According to historical accounts, most of the fighting took place in Salt Prairie, whereas Wetland resacas provided water for horses and troops and occasionally had to be crossed during the battle (Haecker et al. 1994). Loma Shrublands and Woodlands, including some adjacent Mixed Prairie Savanna, served as areas where the troops sheltered overnight. Given the landscape scale of the battle, there is broad overlap between the park’s cultural and natural resource interests. Protecting native habitats is important for larger-scale conservation efforts as well, because the park supports numerous species with very limited distributions within the U.S. including at least 20 species of plants and state- or federally-listed animals like Texas Tortoises (Gopherus berlandieri), Texas Horned Lizards (Phrynosoma cornutum), Texas Indigo Snakes (Drymarchon melanurus erebennus), Black-spotted Newts (Notophthalmus meridionalis), and Aplomado Falcons (Falco femoralis).
Methods
Palo Alto Battlefield NHP has 10 permanently marked vegetation monitoring plots distributed within the park’s main contiguous unit. Nine of the plots were established in 2019, based on a random distribution across all the park’s vegetated areas. A tenth plot was added in 2023 as a nonrandom plot targeting one of the park’s northern lomas. This loma is relatively high in elevation (6.5 meters at plot center) and has a history of agricultural use. The nine primary plots were first visited during the summer of 2019 to install plot markers, tag trees, and conduct the first round of sampling (details in Carlson 2020). Crews returned in June 2023 to sample the nine primary plots for the second time and the targeted loma plot for the first time. Both sampling events followed the methods published by Carlson et al. (2018), in the protocol “Monitoring Terrestrial Vegetation in Gulf Coast Network Parks” and its 11 standard operating procedure documents. All plant species were identified in each 400-meter2 (20 x 20 meter) plot, and their coverages and relative frequencies were recorded in nested sampling frames. Data were also collected on condition, growth, recruitment, and mortality for the four species in I&M plots that were classified as trees: honey mesquite, huisache, Texas ebony (Ebanopsis ebano), and retama (Parkinsonia aculeata).
Key Findings
Vegetation Communities Sampled
The most well-represented vegetation type among the park’s long-term plots was Mixed Prairie Savanna, with four plots total (Figure 4). The adjacent Loma Shrubland or Woodland habitat type was less common in the sample, represented by only two plots. These two habitat types together encompassed the relatively upland areas of the park, with a range in elevations of 4.7-6.5 m. Soils for the Loma Shrubland or Woodland were Laredo Silty Clay Loam, which was characterized by a sandy loam surface and relatively good drainage. The Mixed Prairie Savanna plots were on three different soil types, including Lomalta clay, Benito clay, and Chargo silty clay; see Supplementary Materials for more on plot soils.
Both of the upland habitat types featured some woody plants, but varied widely in vegetation structure. Mixed Prairie Savanna was mainly represented by semi-open areas with trees, shrubs, or cacti, intermixed with a groundcover of grasses and wildflowers, also called forbs (e.g., Ba03, Ba06, Ba07). Less often, it encompassed fully open areas with low-growing grasses, forbs, and cacti, with infrequent woody plants (e.g., Ba02). The two Loma Shrubland or Woodland plots had dissimilarities as well; one plot was mainly in Tamaulipan thornscrub (Ba05), and the other was in mesquital –a post-disturbance community featuring mesquite trees, prickly pear cactus, and a relatively open understory (Ba10B). The range in woody plant growth among upland plots was a function of underlying differences in soils, elevation, historic farming practices, and the park’s more recent brush clearing activities. See Supplementary Materials for more on land use, including plot-level land cover change interpreted from aerial imagery since 1934.
The remaining four plots represented the park’s lowlands, with three in Salt Prairie and one in an Intermittent Herbaceous Wetland (Figure 4). The range in elevations for these plots was 4.1-4.6 m. Soils were Lomalta clay, known for very poor drainage and in places, high salt content. Two of the Salt Prairie plots were a mix of cordgrass and salt flats, whereas the third plot had more continuous cordgrass. Finally, the Intermittent Herbaceous Wetland plot included some Mixed Prairie Savanna on its margins, but it was mainly in a resaca bed, home to a unique assemblage of wetland plants that vary in abundance depending on drought and soil saturation levels during the growing season.
Park-Wide Richness Summaries and Notable Species
Across all 10 plots sampled in 2023, I&M staff recorded 103 plant taxa. For the nine primary plots that were resampled in 2023, there were 94 taxa, and the newly-added Ba10B contributed nine more (See Supplementary Materials for the full species list). Ninety-eight percent of the total could be identified to species level, leaving two taxa as unknown due to a lack of distinguishing features and non-reproductive plants.
The 2023 plot sampling event added four new species to the park species list. These species were not on the Lonard (2004) plant inventory of 243 species, nor were they recorded during the 2019 I&M event. Among these was hairy ayenia (Ayenia pilosa), which was found as one small individual in Ba10B. This species is limited in range to southern Texas, southern New Mexico and northern Mexico. It is related to the federally-listed Texas ayenia (Ayenia limitaris) of shady riparian habitats in deep south Texas, which is not known to occur within the boundaries of the park.
Since the Gulf Coast I&M Network began work at Palo Alto Battlefield NHP, a total of 33 new plant species have been added to the park species list. This includes the four from the 2023 event, eight from the 2019 event, and 21 from observations made by network or park staff outside of vegetation monitoring plots. Five the records from outside I&M plots were in or near planted areas, but these native species may also occur naturally elsewhere in the park. The addition of 33 new records brings the park-wide species list to 276. These new records are listed in the Supplementary Materials document, and they also have been added to the online park species list on NPSpecies.
The most widespread species in the I&M sample –found in all 10 plots– was a native low-growing plant called tornillo (Prosopis reptans). After tornillo, there were five species found in eight of 10 plots; these included the non-native grass Kleberg bluestem (Dichanthium annulatum; Figure 1A) and four native species: sea ox-eye daisy, honey mesquite, wolfberry (Lycium carolinianum), and American false-mallow (Malvastrum americanum). Cordgrass was present in seven plots, although it was abundant in only a few of these (see following sections for details).
A total of eight non-native species were identified in I&M plots within the park, of which seven were grasses. This represents fewer than half of the 21 non-natives that are known to occur in the park, based on the 2004 inventory and subsequent observations. All but two plots had one or more non-native species present, and several of these were widespread. Leading this list was the previously mentioned Kleberg bluestem, followed by perennial cupgrass (Eriochloa pseudoatricha; Figure 1C) in four of 10 plots. Being present in most plots indicates that a non-native is widely-distributed within the park, but the greatest cause for concern is when non-natives come to dominate the communities where they occur and outcompete native species. Percent cover values for non-natives and other dominant species in the plots are presented further below.
None of the species recorded in 2023 were threatened or endangered, based on state or federal lists. The I&M sample nevertheless contained several globally rare species, i.e., they have small geographic ranges restricted to southern Texas and northern Mexico. One of these species,littleflower roseling (Callisia micrantha), is nearly completely endemic to a handful of counties in South Texas, and for that reason, it is listed as vulnerable on NatureServe (NatureServe 2025). It was also included on the park's rare plant species list by Carr et al. (1998). The clapp-daisy (Clappia suaedifolia) has an even smaller distribution in the U.S. and is considered a Tamaulipan endemic. Fourteen other species recorded by I&M in 2023 have larger ranges but are still limited to portions of Texas and northern Mexico. These include fishhook cactus (Thelocactus setispinus; Figure 2A), tornillo (Prosopis reptans), bearded swallowwort (Cynanchum barbigerum), Texas nightshade (Solanum triquetrum), sticky florestina (Florestina tripteris), two color croton (Croton leucophyllus), Matamoros saltbush (Atriplex matamorensis), Berlandier’s trumpets (Acleisanthes obtusa), all-thorn goatbush (Castela erecta), coyotillo (Karwinskia humboldtiana), desert yaupon (Schaefferia cuneifolia), snake eyes (Phaulothamnus spinescens), brasil (Condalia hookeri), and Texas ebony (Ebenopsis ebano). The park has several more species that were not found in I&M plots but have similarly-restricted geographic ranges (see Supplementary Materials). A list of the area’s plant Species of Greatest Conservation Need, according to Texas Parks and Wildlife Department, is in Carlson (2020).
Richness Comparisons for 2023 and 2019
Given that 2023 was the second round of sampling for the park, some context may be gained from informal comparisons with the 2019 summaries. The nine plots that were sampled in both years had a total of 96 species in 2019 and 94 species in 2023. Of the cumulative list of 108 species for those nine plots, 76% were recorded both times. It is unsurprising that composition changed over time, given that plant populations are dynamic, and both annual and perennial species can shift locations through recruitment, mortality, and rhizomatous spread.
Weather can be a major contributor as well, and the two sampling years had slightly different rainfall patterns. Based on weather station data from nearby Brownsville, April and May were relatively dry in 2019 (<3 cm per month), whereas they were relatively wet in 2023 (13-14 cm per month). By the sampling dates at the end of June, however, this pattern had reversed. There were only 3 cm of rainfall in June prior to sampling in 2023, as compared to 14 cm in 2019. This drying down in 2023 caused moderate drought stress just before and during sampling, based on that month’s water deficit values from water balance models (Tercek et al. 2021). Short-term drought stress may have eliminated that year’s growth of the most sensitive herbaceous species. Indeed, 67% of the species seen exclusively in 2019 were forbs, as compared to only 33% of those seen exclusively in 2023. Analyses that account for the impacts of rainfall, water deficit, and other agents of change on species richness and abundance will be made after several additional rounds of data collection.
Plot-Level Richness Summaries
Long-term monitoring plots at Palo Alto Battlefield NHP each contained 29 plant species on average, with a range of 11 to 47 species (Table 1; Figure 4). The richest plot was Ba05 in Loma Shrubland or Woodland, and it was dominated by Tamaulipan thornscrub. The two most species-poor plots were in Salt Prairie, with only 11 or 12 species per plot. The low richness of these plots was unsurprising, given that saline soils exclude many species, and cordgrass is known for forming single-species stands. The third Salt Prairie plot had more intermediate richness, but it also reached higher elevations than the other two plots (maximum elevation within the plot of 4.66 m) and apparently included areas with less saline soils.
Plots were not equally rich in all growth forms (Table 1). Nearly half of all species in each plot were forbs, which are defined here as non-woody flowering plants excluding graminoids and vines, plus one fern. The next richest category was graminoids, which includes all species of grasses and sedges. Plots with higher total richness tended be those with the most forb species and, in all but one case, with three or more shrub species. Plot Ba06 was the exception with three shrub species and low richness, but its richness was likely depressed by a heavy invasion of the non-native Kleberg bluestem. Unique among plots in this study, Ba06 occurred in an upland area of the park that was previously used to grow sorghum and was part of a reforestation project in 1997.
Table 1. Plant species richness per plot in 2023, with plots organized by increasing elevation of the plot centerpoint. Species counts include all species recorded in each plot, whether they are rooted in, overhanging, or prostrated across the plot, including unidentified species with unknown nativity status. The tree and vine growth forms are not included in the table; across all 10 plots, there were four tree species and four vine species total. In the "Broad Habitat Type" column, "Wetland" = Intermittent Herbaceous Wetland, "Prairie" = Mixed Prairie Savanna, "Shrubland" = Loma Shrubland or Woodland.
| Plot ID | Broad Habitat Type | Elev. (m) | Total Plot Richness, All Species |
Non- Native Rich- ness |
Gram- inoid Rich-ness |
Forb Rich- ness | Shrub Rich- ness | Cactus and Yucca Richness |
| Ba09 | Salt Prairie |
4.1 | 12 | 0 | 3 | 7 | 0 | 0 |
| Ba01 | Salt Prairie |
4.5 | 25 | 3 | 11 | 10 | 0 | 1 |
| Ba04 | Salt Prairie |
4.5 | 11 | 0 | 3 | 6 | 0 | 0 |
| Ba08 | Wetland |
4.6 |
40 |
3 |
13 |
19 |
3 |
1 |
| Ba07 | Prairie |
4.7 |
40 |
3 |
8 |
17 |
6 |
3 |
| Ba03 | Prairie |
4.8 |
24 |
2 |
10 |
9 |
1 |
3 |
| Ba02 | Prairie |
4.9 |
35 |
4 |
13 |
16 |
0 |
4 |
| Ba06 | Prairie |
5.3 |
17 |
3 |
3 |
9 |
3 |
0 |
| Ba05 | Shrubland |
5.4 |
47 |
3 |
13 |
20 |
6 |
2 |
| Ba10B | Shrubland |
6.5 |
38 |
3 |
6 |
19 |
6 |
5 |
| Plot-level Average | - |
4.9 |
29 |
2 |
8 |
13 |
3 |
2 |
| Cumulative for Park | - |
- |
103 |
8 |
32 |
48 |
10 |
5 |
Of the nine plots sampled in both 2019 and 2023, the three highest richness and three lowest richness plots retained the same ranks over time, reflecting a measure of stability in these sites (see Supplementary Materials for plot means in 2019). Even so, the top two plots declined in total counts between 2019 and 2023, by eight species each. One additional plot showed a marked change, Ba02, which increased from 26 species in 2019 to 35 in 2023. Although the causes for these temporal changes are unclear, the relative dryness of the 2023 sampling event may have contributed by favoring certain species in one year but not the other.
Ground- and Mid-Story Percent Cover
To determine which species dominated the ground- and mid-story of each plot, percent cover was estimated for each species within four 10-m2 microplots, for all foliage and stems up to 5 m above ground level. To examine patterns across broad habitat types, percent cover of each species was averaged for all microplots in each of Intermittent Herbaceous Wetland, Salt Prairie, Mixed Prairie Savanna, and Loma Shrubland or Woodland. A major finding was that sea ox-eye daisy was consistently within the top three species for mean percent cover in all four habitat types, and both honey mesquite and tornillo were within the top fourteen species for each type. Another focal species was cordgrass, which was in the top nine species for coverage for all habitat types except Intermittent Herbaceous Wetland. In Salt Prairie, cordgrass was the top species in terms of cover, with an average of 43% cover and a range of 0-100% in individual microplots. Average cover values for each of the top 15 species in each habitat type are shown in Supplementary Materials.
Given the high variability within habitat types, dominant taxa and growth forms were compared across individual plots as well. Plot-level percent cover estimates were combined into woody shrubs, cacti and yuccas, forbs, non- native grasses, cordgrass, and other native grasses. One notable finding was that non-native grasses were prevalent in many areas of the park (Figure 5). Five of the 10 I&M plots had ≥10% cover of invasive grasses, and this included two plots that reached over 55% invasive cover. Collectively, these plots spanned both northern and southern areas of the park, with different species dominating in each area. Guinea grass (Megathyrsus maximus; Figure 1B) had the highest cover in Ba10B (17% mean coverage), whereas Kleberg bluestem was dominant in Ba06 (60%), Ba01 (41%), and Ba07 (21%). Plot Ba01 had a second invasive grass with fairly high coverage: perennial cupgrass at 14%. For the five remaining plots with less than 10% invasive grass cover, three had at least one invasive grass species present. These results highlight the persistent problem of invasive grasses in the park, with the notable exception of the two lowest elevation Salt Prairie plots, where saline, poorly-drained clay soils exclude most non-native and native species alike.
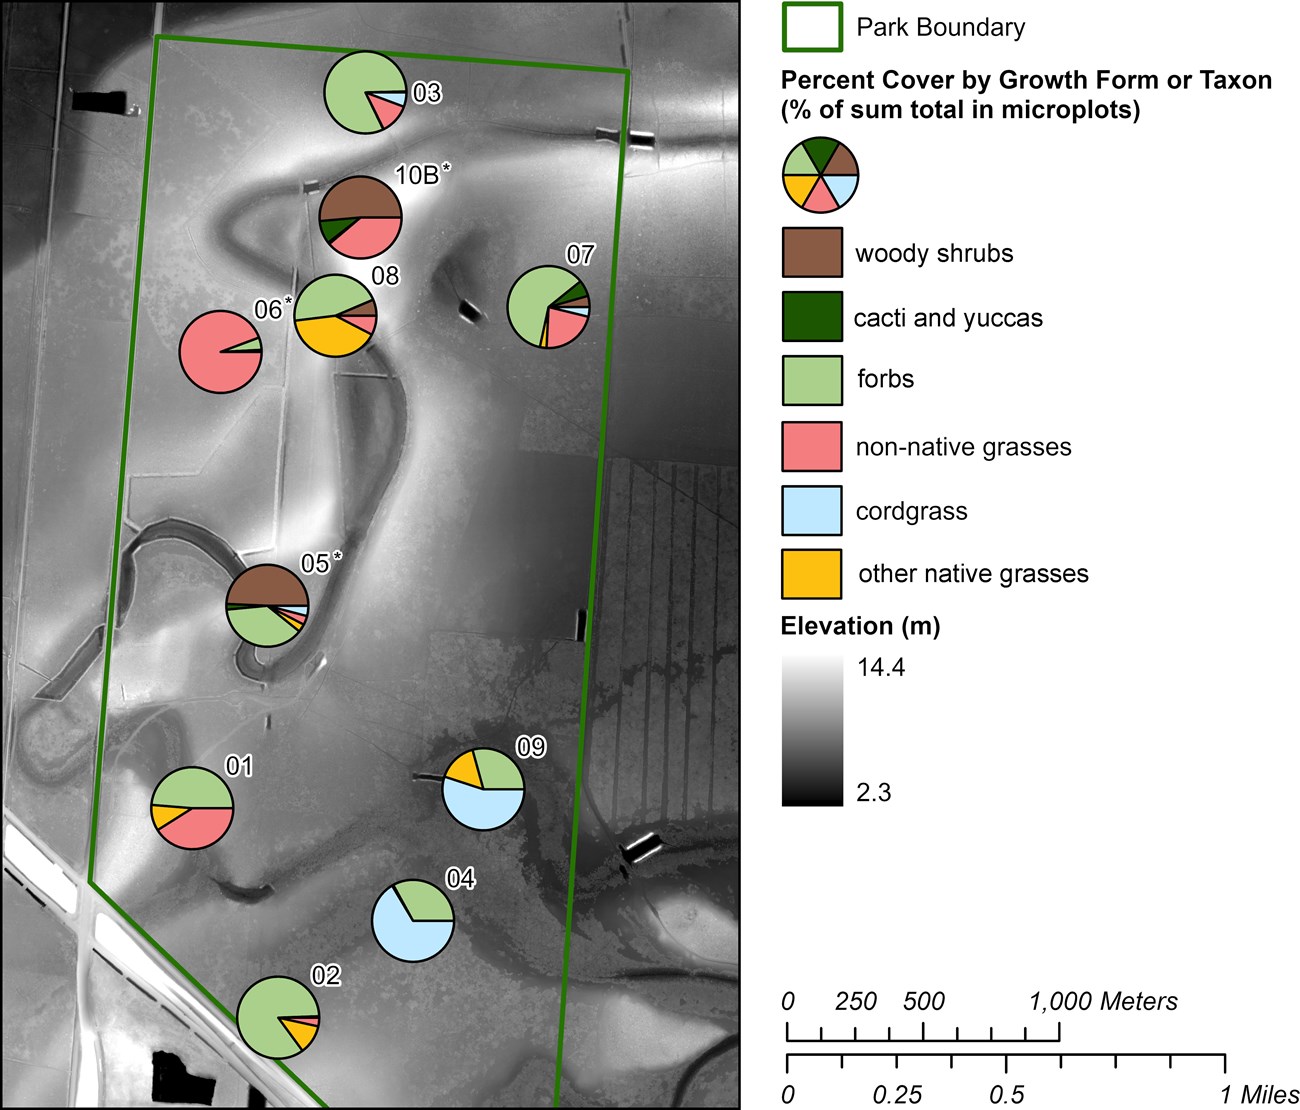
Relative percent cover excluded contributions of tree species, which were mainly honey mesquite; instead, an asterisk was added to show the plot had greater than 5% tree cover.
In contrast to invasive grasses, native graminoids were found to have relatively little cover in most plots (Figure 5). Salt Prairies were the main exception, with high coverage of cordgrass in the prairie portions (43% on average) and shoregrass in the salt flats (10% on average). Other than Salt Prairies, only the Intermittent Herbaceous Wetland plot Ba08 had ≥10% relative cover of native grasses. The dominant species there was long tom (Paspalum denticulatum), a grass of southern marshes and ditches.
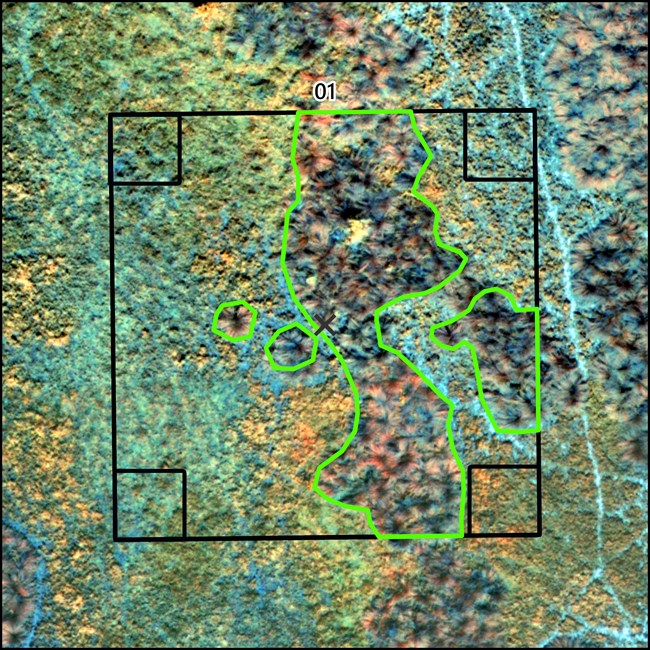
Although percent cover estimates provide useful insights into a plot’s dominant plants, this approach had some limitations. Percent cover is based on only 10% of the total plot area, which is a manageable scale for field crews, but leaves some plot species without cover estimates. For example, cordgrass was listed as present in Ba01, but it was only found outside the four corner microplots. A plot-level cordgrass estimate from high-resolution aerial imagery, in contrast, showed a patch that amounted to 33% cover in the full plot (Figure 6; see also Supplementary Materials). All other plots had better alignment between imagery-based and on-site estimates for cordgrass, but even then, imagery remained useful for providing the full plot picture. Imagery-based assessments can work for distinctive, large-statured species like cordgrass, although most other herbaceous species would be difficult or impossible to differentiate. Given the utility of this approach for cordgrass and the importance of this species to the park, future I&M plot sampling would benefit from synchronized capture of near-surface imagery, to better track local expansion or loss of cordgrass over time.
Temporal comparisons of cover values for major taxa or key growth forms revealed no striking differences between plots in 2019 and 2023. Data were visualized for cover of cordgrass, for all non-native grasses combined, for all forbs combined, and for all graminoids combined. Although there were slightly fewer forb species per plot in 2023 than 2019, this did not result in detectable differences in cover. More in-depth examination of ground and mid-story cover, including statistical analyses, will take place after several more rounds of sampling.
Tree Metrics
Forest health metrics were recorded in all plots that contained at least one tree, i.e., at least one woody stem with DBH ≥ 10 cm. Five of the 10 plots met this threshold in 2023, for a total of 17 trees. Communities with trees included Loma Shrubland or Woodland (Ba05 and Ba10B), Intermittent Wetland (Ba08), and Mixed Prairie Savanna (Ba03 and Ba06). Most of these plots contained between one and three trees per plot, but Ba10B was an exception with eight trees. Nearly all trees were honey mesquite, but there was one retama in Ba08 and one huisache in Ba06. Multiple stems from the same base were tagged and measured separately, as long as they met the DBH threshold individually. Eight of the 17 trees had two tagged stems per trunk, including seven honey mesquite and one huisache.
The 2023 tree data showed that the park's woodlands and shrublands contained mainly young or small-statured trees. The mean plot DBH was only 13 cm and the range was 10-16 cm. The growth rate of the most common tree species, honey mesquite, was also strikingly slow, changing less than a centimeter between 2019 and 2023. None of the tagged trees died between events, but there was some mortality of smaller huisache and honey mesquite trees (DBH < 10 cm) in three of the lower elevation plots. Circumstantial evidence suggests the die-back was in response to an unusually long high-water event, lasting from July 2021 to May 2022, when soils may have remained saturated beyond the flood-tolerance limits of those two species.
Conclusions
Vegetation monitoring results from 2023 demonstrate that the park’s plant communities are not particularly rich, with a handful of species being common throughout. This pattern of low richness and dominance by a small subset of species can be attributed to several, well-known processes acting at local and regional levels. First, the semi-arid climate and poor soils place a strong filter on species occurrence, particularly for species with low drought tolerance, or for the Salt Prairie, salt and flood tolerance. A corollary to this, however, is that these uniquely harsh conditions can favor a handful of narrowly-distributed species, such as the two Tamaulipan endemics found in I&M plots, clapp daisy and littleflower roseling. These nominally harsh habitats are also home to state- or federally-listed animals. Long-term vegetation monitoring therefore provides conservation-relevant data for these rare plants and animals of the Tamaulipan Biotic Province.
A second factor contributing low richness of park plant communities is its land use history. Over the last 175 years, park parcels have been subject to brush clearing, ditch and pond digging, plowing, cultivation, chaining, and other modifications. Agricultural practices largely ceased in the 1990s when NPS took ownership, but their legacy remains in the form of disrupted hydrology, degraded soil conditions, and changes to plant community composition. Cattle grazing continued on some parcels until 2001, which understandably further reduced cover of native grasses and forbs. These past agricultural practices impacted all of the park’s major habitats, although not all to the same degree.
Perhaps the least-altered of the park’s plant communities is the Salt Prairie. Cordgrass was present during the battle of Palo Alto, and it still covers large expanses of the park today, suggesting a degree of resiliency over time. The species resprouts readily after fire, which occurred during the park’s namesake battle and later as farmers burned prairies to improve forage quality for cattle. Even with these broad tolerances, however, the park’s cordgrass population has suffered losses. For example, a 26 hectare [65 acre] parcel within the core battlefield has lost its cordgrass cover, presumably due to intensive plowing that began in the 1950s and ended with NPS ownership. Woody plants have also encroached on the Salt Prairie, particularly along the upslope transition zone where soils are less saline (e.g., plot Ba01). To address brush encroachment, park staff routinely clear woody plants and prickly pear in the Salt Prairie and along its margins. Natural resource staff have also conducted restoration plantings of cordgrass, to help return the historic battlefield to its original 1846 landscape. Long-term vegetation monitoring allows NPS staff to track the condition of the prairie and document how it responds to both active management and natural environmental change. An upcoming high-resolution cordgrass map will enhance this work to help inform future management practices and priorities.
The park’s other three broad habitat types were more strongly impacted by past agricultural practices, and their recovery trajectories appear slower. Our monitoring data suggests that these three habitat types are in a mid-successional state, as the landscape is “normalizing” after years of farming and ranching. For example, the Mixed Prairie Savanna spans the elevation gradient between Salt Prairie and Loma Shrubland or Woodland and is currently more ruderal than either one. Like other parts of the park, it is believed to be drier than its 1846 counterpart. This change in soil moisture can again be attributed to land conversion and hydrological alterations, making its lower elevations more favorable to woody plants. For the more heavily wooded Loma Shrubland or Woodland, past land clearing activities resulted in excessive regrowth of honey mesquite and prickly pear. Although the two plots in this habitat type were relatively rich compared to other monitoring plots, they lacked the expected richness for their physiographic setting. Ongoing monitoring efforts will help track the condition of these areas, where a rich Tamaulipan thornscrub community is desirable and hosts a unique assemblage of animals. This includes Texas tortoises, which are also monitored by the Gulf Coast Network during annual survey events within in each of the park’s major lomas.
Invasive grasses are widespread throughout the park, especially in the two higher-elevation habitat types. Guinea grass has recently expanded in south and central Texas and poses a growing threat in the region (see also the 2023 I&M report for San Antonio Missions NHP). The park is also home to two non-native animals: the feral hog (Sus scrofa) and an ungulate from India known as the nilgai (Boselaphus tragocamelus). The impacts of these animals on vegetation are not well understood, but their movements throughout the park likely play a role in seed dispersal. Control measures for both the nilgai and feral hogs have been considered by park management but have not been fully implemented. The park continually works toward controlling the spread of invasive grasses; however, the region’s growing human population creates more opportunities for non-native plants to invade, after which wild and domesticated animals contribute to their dispersal. Treatment methods need to become increasingly creative to address these challenges in the park’s already-impacted plant communities. Long-term monitoring in these areas will continue to inform management decisions and help serve the park into the future.
Acknowledgements
Participants in the 2023 vegetation monitoring field effort at Palo Alto Battlefield NHP included the authors, I&M program intern Kimberly Bowman, and Lee Bragg, a Palo Alto Battlefield NHP Biological Technician. Data entry, quality checks, and species lists assembly were completed by Jane Carlson, Fabi Speyrer, Whitney Granger, and Kimberly Bowman. Jeff Bracewell created the maps. Editorial support came from Martha Segura, network program manager.
Article created by Jane E. Carlson, Ph.D., Ecologist, and Jeff Bracewell, GIS Specialist, Gulf Coast I&M Network.
- Carlson, J.E., J. Bracewell, W. Granger, and M. Segura. 2018. Monitoring vegetation in Gulf Coast Network parks: Protocol implementation plan. Natural Resource Report NPS/GULN/NRR—2018/1746. National Park Service, Fort Collins, Colorado.
- Carlson, J.E. 2020. Trip Report for Vegetation Monitoring at Palo Alto Battlefield National Historical Park 2019. Gulf Coast I&M Network, Lafayette, Louisiana. https://irma.nps.gov/DataStore/Reference/Profile/2274315
- Carr, W., J. Karges, and M. Gallyoun. 1998. Rare plant and animal species on National Park Service lands. Texas Conservation Data Center, The Nature Conservancy of Texas. San Antonio, Texas. https://irma.nps.gov/DataStore/Reference/Profile/573866.
- Cooper, D.J. and J.I. Wagner. 2013. Tropical storm driven hydrologic regimes support Spartina dominated prairies in Texas. Wetlands 33: 1019-1024.
- Farmer, M. 1992. A natural resource survey of Palo Alto National Battlefield. National Audubon Society, Brownsville, Texas. 24 pages.
- Haecker, C.M., M. Farmer, E.A. Ratliff, N.L. Richard, A.T. Richardson, and K.R. Young. 1994. A Thunder of Cannon: Archeology of the Mexican-American War Battlefield of Palo Alto. National Park Service - Southwest Cultural Resources Center, Southwest Regional Office. Santa Fe, New Mexico.
- Lonard, R.I., A.T. Richardson and N.L. Richard. 2004. The vascular flora of the Palo Alto National Battlefield Historic Site, Cameron County, Texas. Texas J. Sci 56(1): 15-34.
- NatureServe. 2025. NatureServe explorer. Arlington, Virginia.NatureServe. https://explorer.natureserve.org/
- Richard, N. L., and A. T. Richardson. 1993. Biological inventory, natural history, and human impact of Palo Alto National Battlefield. Report to the National Park Service.
- Ramsey, E. 2006. Palo Alto Battlefield National Historic Site landscape classification and historic analysis. Unpublished report.
- Tercek, M.T., D. Thoma, J.E. Gross, K. Sherrill, S. Kagone,G. Senay. 2021. Historical changes in plant water use and need in the continental United States. PLOS ONE 6(9): e0256586.https://doi.org/10.1371/journal.pone.0256586.
- U.S. Geological Survey. 2018. 3D Elevation Program 1-Meter Resolution Digital Elevation Model, TX South B8 2018. accessed March 5, 2025 at URL https://www.usgs.gov/the-national-map-data-delivery
- U.S. Geological Survey. 2025. Unoccupied Aerial Systems (UAS) imagery of a monitoring plot at Palo Alto Battlefield. accessed April 2025 at URL https://www.usgs.gov/media/images/unoccupied-aerial-systems-uas-imagery-a-monitoring-plot-palo-alto-battlefield-texas
Supplementary Materials
Supplementary materials to this report are available in the NPS datastore, as are all previous project briefs. Follow the link below for the 2023 Supplementary Materials, which links to all other project materials.
