Last updated: November 1, 2021
Article
Fire Extent and Frequency Resource Brief for the Arctic Network

NPS/Jennifer Barnes

The Status of Fire Extent and Frequency in the Arctic Network
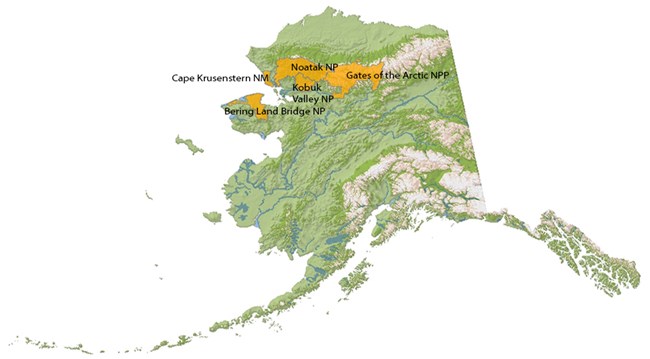
Fire affects all 5 parks within the Arctic Network (ARCN). The first fires in the network were officially recorded in 1956, although the history of fire in these parks, based on charcoal records dates back to at least 6,000 years ago. Since 1956, 547 fires have occurred in ARCN parks, burning nearly 1.1 million acres, an area almost twice the size of Cape Krusenstern National Monument. The vast majority of these fires (97%) were started by lightning.
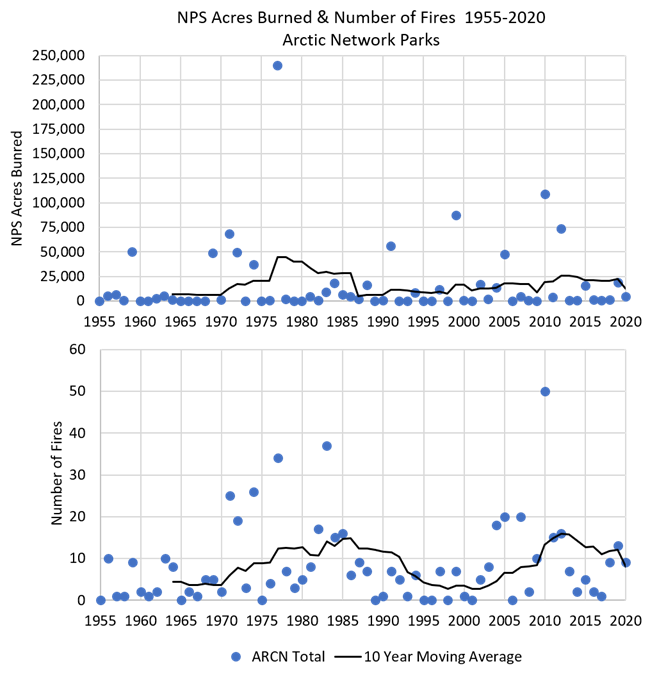
On average, ARCN parks have a total of 8 fires per year and burn roughly 16,000 acres annually. However, this varies widely between years. Some years, or period of years, there will be few to no fires and others will have 20 to 30, even up to 50 fire starts per year, as observed in 2010 (Figure 1). Fire extent and frequency also varies geographically by park and over time (Figure 2). For example, fires occur most frequently in Noatak National Preserve with 232 fires and are the least common in Cape Krusenstern National Monument with only 12 fires (6 of which started in 2018 – a record for that park unit). Noatak also has the most total area burned of the ARCN parks (over 550,000 acres). While Bering Land Bridge National Preserve holds no winning records for either frequency or extent, when fires do occur in this unit, they can be quite large – the largest fire on record for ARCN burned 121,524 acres within the Preserve boundaries in 1977.


A Blast into the Past— New Improvements to Historical Fire Records in the Arctic
Careful investigation of historical fire reports (from 1956 to 2020) and archived satellite imagery has led to significant improvements to both the official NPS fire records and the statewide Alaska Fire History – Perimeters (a geospatial database that includes mapped fire perimeters dating back to 1940). Fires reported within ARCN parks were verified against imagery to determine the most accurate point of origin, acres burned, mapped perimeter and other important features. Through this process, 253 NPS historical fire records were improved and 137 perimeters were updated, including the discovery of 72 new perimeters (Figure 3). This amounted to a change of over 208,000 acres of area burned.
Mapping improvements to the 1987 Fire in Cape Krusenstern National Monument


Left image
The black and white dashed line shows the original fire perimeter for the 1987 fire in Cape Krusenstern. It was likely digitized from a hand drawn map.
Right image
The perimeter was updated (blue line) using a LANDSAT 5 satellite image collected later that same year, after the fire was declared out. The 1987 fire actually burned 3,082 acres more than originally mapped and reported.

NPS/Dan Stevenson
Why Monitoring Fire is Important
Alaska is experiencing dramatic changes in climate and extreme weather events, some of which include warmer temperatures, earlier snow melt, vegetation/tundra “greening” and longer growing seasons – all factors that influence the pattern of fires on the landscape and their ecological effects over time (fire regimes). Such evidence suggests that fire regimes in northern regions, including ARCN, may also change rapidly with increasing numbers of fires and more area burned. Although the current trend has remained relatively flat due to the annual variability of fire activity in these 5 parks, we have observed an increase in the 10-year averages (Figure 1). It is now more important than ever to gain an accurate understanding of historical fire patterns in the parks and continue monitoring current fire parameters. This provides essential information used to determine: 1) long-term trends in frequency and area burned, 2) departures from the natural fire regime and 3) how parks may change in response to climate, vegetation changes, fuel moisture, ignition sources and other factors.
How We Monitor Fire Extent & Frequency
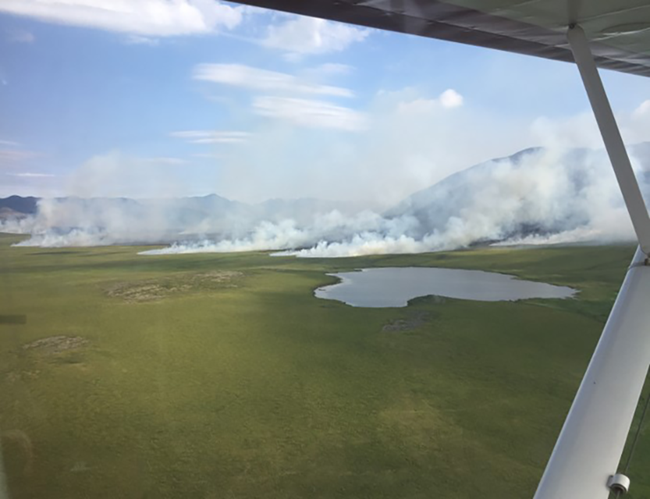
When a fire occurs in a park, fire protection agencies in Alaska collect information on the fire location, when it started, the size of the fire, what fuel type (vegetation) the fire is burning in, and the fire perimeter is often mapped. National Park Service staff assist with monitoring and mapping active fires via aircraft or by using remotely sensed imagery. This data is incorporated into two important fire history geospatial data layers: all reported fires (represented by points) and all mapped fire perimeters. Fire extent is calculated from either the fire perimeter or from the acreage in the national fire reporting system when no perimeter is available. At the end of each year, the data is summarized to look at trends in fire history across ARCN parks.
What We Want to Know About Fire Extent & Frequency
Fire extent and frequency is just one component of our fire monitoring activities. Documenting where, when, how many fires occur and to what extent fires burn provides the necessary information to monitor long-term trends and changes in fire regime that influence many other ecological processes.Our objectives are to determine the variability and decadal-scale trends in:
-
Fire frequency (number of fires/year)
-
Average fire size
-
Maximum fire size
-
Total area affected by fire
How Monitoring Fire Extent & Frequency Can Help Park Managers
Understanding fire regimes and how they are changing are essential for fire management planning, strategic decision making, evaluating risk, and determining ecological impacts. The fire ecology program provides scientific information necessary to help make sound management decisions and to support research, education and public awareness regarding fire and fire effects in our national parks. More information on the Fire Vital Sign including fire frequency, extent, severity and fire effects in Arctic Network parks can be found at: https://www.nps.gov/im/arcn/fire.htm

Tags
- bering land bridge national preserve
- cape krusenstern national monument
- gates of the arctic national park & preserve
- kobuk valley national park
- noatak national preserve
- fire monitoring
- arcn
- arctic network
- arctic
- wildland fire
- wildland fire management
- alaska national parks
- wildfires
- climate change
- fire effects monitor
- fire ecology
- alaska
- resource brief
- vital sign
- fire
