Last updated: March 18, 2025
Article
Climate and Water Monitoring at Casa Grande Ruins National Monument: Water Year 2022
NPS
Overview
Together, climate and hydrology shape ecosystems and the services they provide, particularly in arid and semi-arid ecosystems. Understanding changes in climate, groundwater, and surface water is key to assessing the condition of park natural resources—and often, cultural resources.
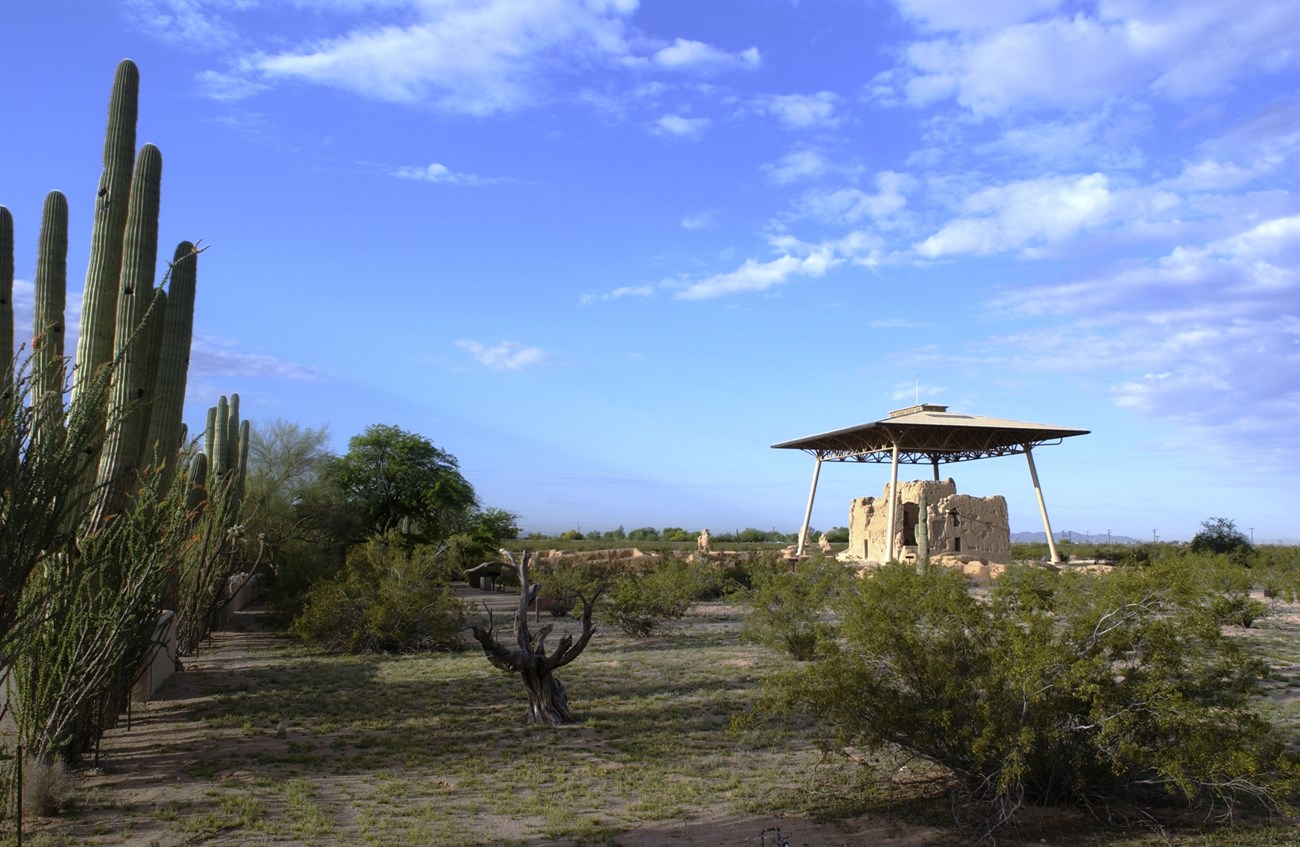
At Casa Grande Ruins National Monument (Figure 1), Sonoran Desert Network scientists study how ecosystems may be changing by taking measurements of key resources, or “vital signs,” year after year—much as a doctor keeps track of a patient’s vital signs. This long-term ecological monitoring provides early warning of potential problems, allowing managers to mitigate them before they become worse. At Casa Grande Ruins National Monument, we monitor climate and groundwater, among other vital signs.
Groundwater conditions are closely related to climate conditions. Because they are better understood together, we report on climate in conjunction with water resources. Reporting is by water year (WY), which begins in October of the previous calendar year and goes through September of the water year (e.g., WY2022 runs from October 2021 through September 2022).
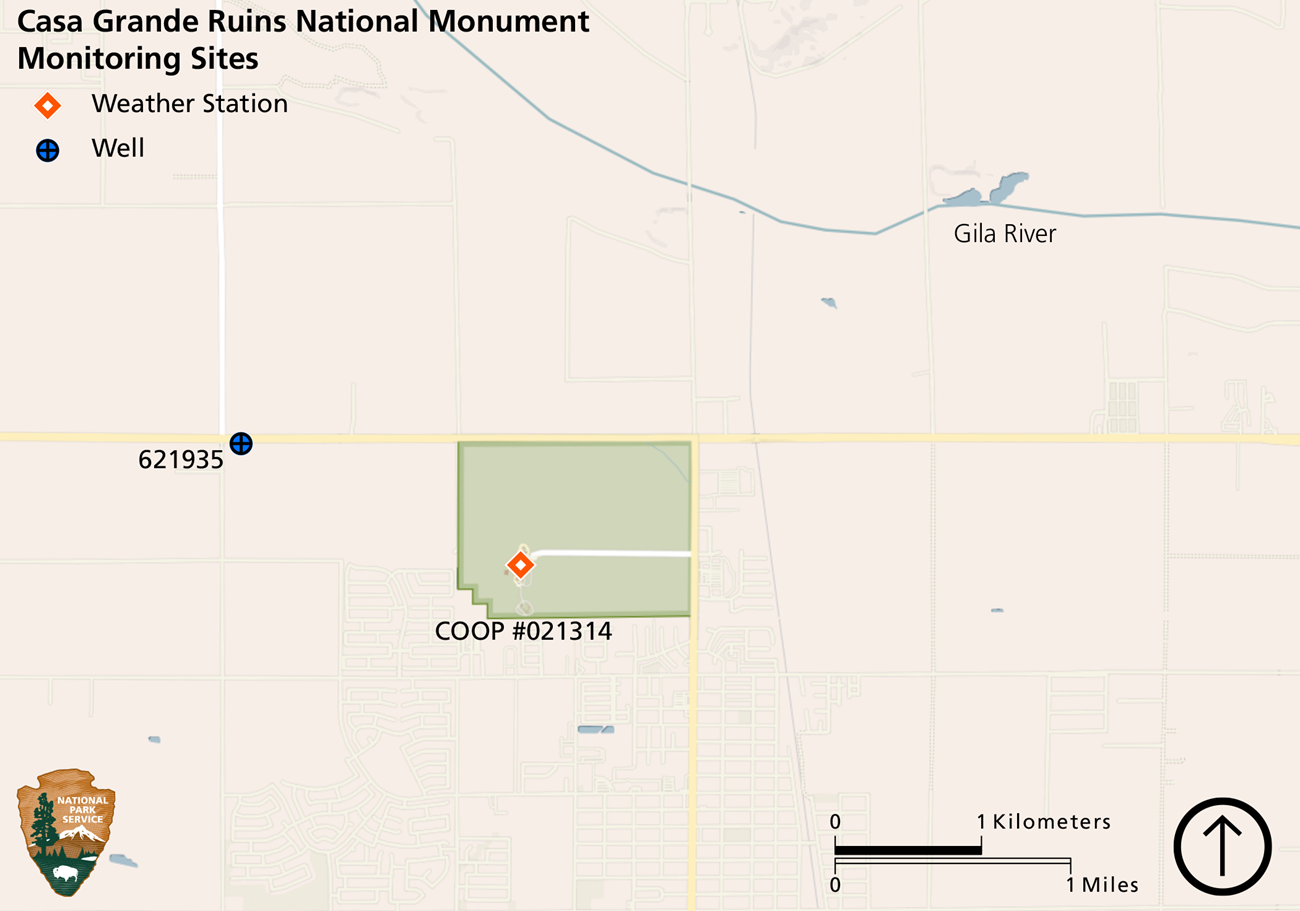
This article reports the results of climate and water monitoring at Casa Grande Ruins National Monument (Figure 1) in WY2022.
NPS
NPS
Climate and Weather
There is often confusion over the terms “weather” and “climate.” In short, weather describes instantaneous meteorological conditions (e.g., it’s currently raining or snowing, it’s a hot or frigid day). Climate reflects patterns of weather at a given place over longer periods of time (seasons to years). Climate is the primary driver of ecological processes on earth. Climate and weather information provide context for understanding the status or condition of other park resources.
Methods
A National Oceanic and Atmospheric Administration (NOAA) Cooperative Observer Program (COOP) weather station, Casa Grande 021314, has been operational at Casa Grande Ruins National Monument since 1906 (see Figure 1). This station typically provides a reliable climate dataset. However, in WY2022 the station was missing data for 40 days. As a substitute, climate analyses for this report use 30-year averages (1991–2020) and gridded surface meteorological (GRIDMET) data from the location of the station. Subsequent reports may revert to the weather stations as the data source, depending on future data quality.
GRIDMET is a spatial climate dataset at a 4 km resolution that is interpolated using weather station data, topography, and other observational and modeled land-surface data. Temperature and precipitation estimated from GRIDMET may vary from actual weather at a particular location, depending on the availability of weather station data and the difference in elevation between the location and that assigned to a grid cell. Data from both the weather stations and GRIDMET are accessible through Climate Analyzer.
Results for Water Year 2022
Precipitation
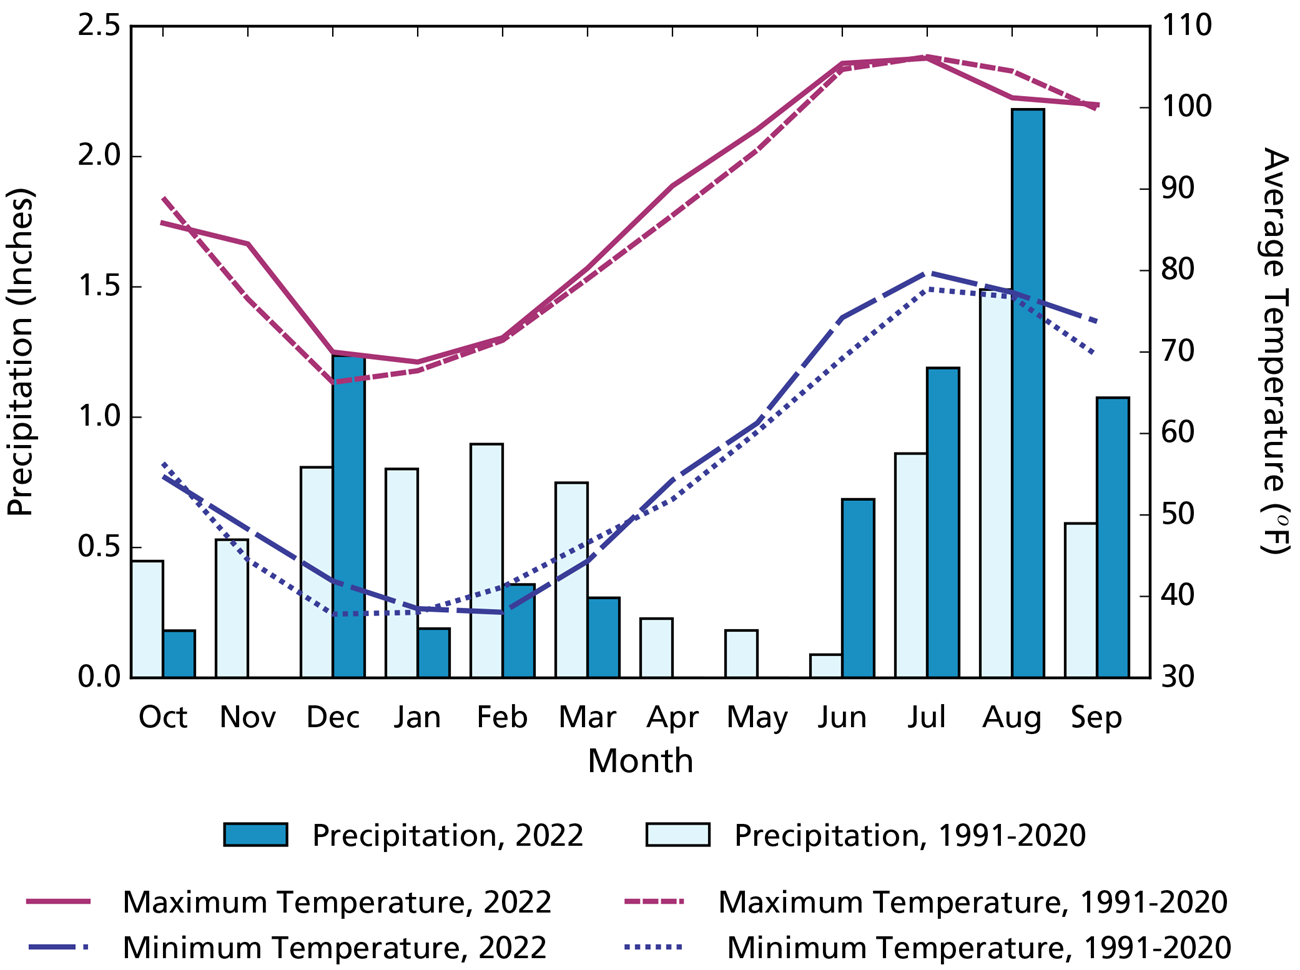
Annual precipitation at Casa Grande Ruins National Monument in WY2022 was 7.40″ (18.8 cm; Figure 2), which was 0.27″ (0.7 cm) less than the 1991–2020 annual average. Monthly precipitation in WY2022 during the monsoon season and December was higher than the 1991–2020 averages, especially in June, which received 0.69″ (1.8 cm)—nearly eight times the average rainfall. All other months received no rainfall or ≤ 41% of the 1991–2020 averages.
Air Temperature
The mean annual maximum temperature at Casa Grande Ruins National Monument in WY2022 was 88.5°F (31.4°C), 1.2°F (0.6°C) above the 1991–2020 average. The mean annual minimum temperature in WY2022 was 57.3°F (14.1°C), 1.4°F (0.8°C) above the 1991–2020 average. Mean monthly maximum and minimum temperatures in WY2022 were generally warmer than the 1991–2020 monthly averages, differing by as much as 6.8°F (3.8°C; see November as an example, Figure 2).
NPS
Drought
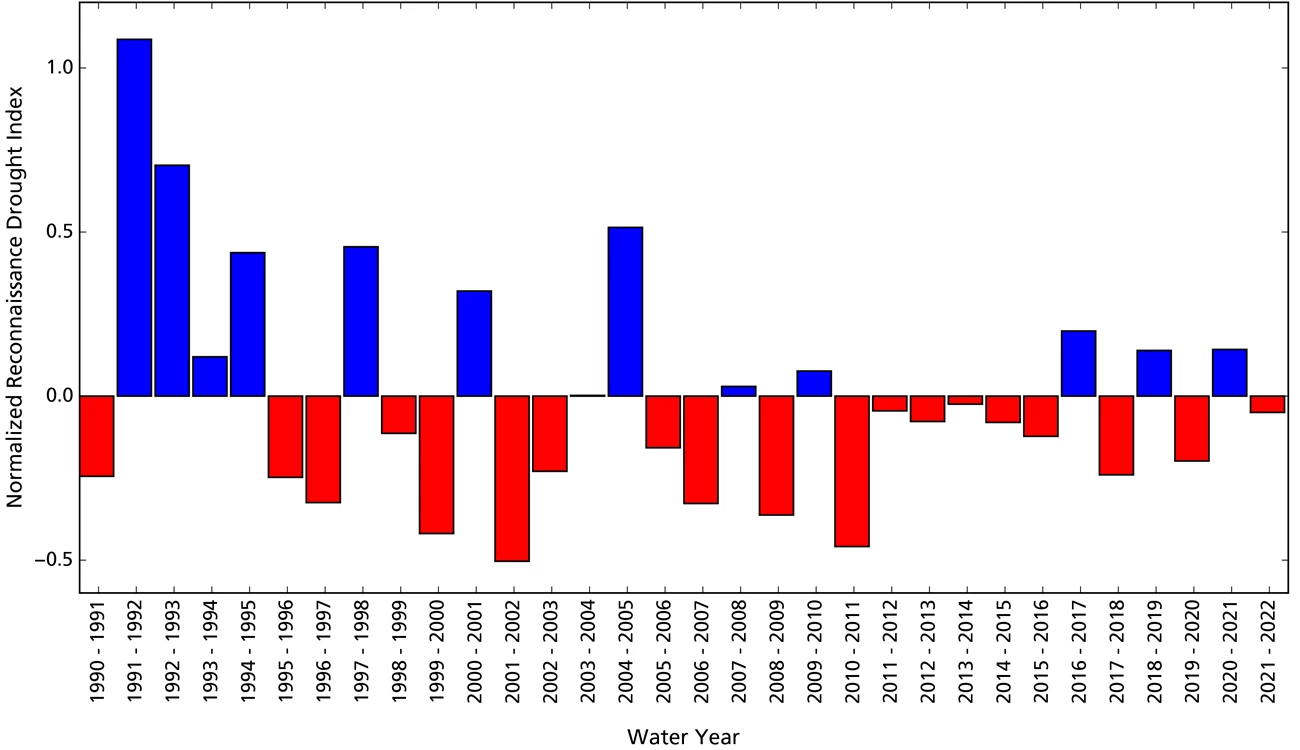
Reconnaissance drought index (Tsakiris and Vangelis 2005) provides a measure of drought severity and extent relative to the long-term climate. It is based on the ratio of average precipitation to average potential evapotranspiration (the amount of water loss that would occur from evaporation and plant transpiration if the water supply was unlimited) over short periods of time (seasons to years). The reconnaissance drought index for Casa Grande Ruins National Monument indicates that WY2022 was slightly drier than the 1991–2022 average from the perspective of both precipitation and potential evapotranspiration (Figure 3).
Reference: Tsakiris G., and H. Vangelis. 2005. Establishing a drought index incorporating evapotranspiration. European Water 9: 3–11.
NPS
NPS
Groundwater
Groundwater is one of the most critical natural resources of the American Southwest, providing drinking water, irrigating crops, and sustaining rivers, streams, and springs throughout the region.
Methods
At Casa Grande Ruins National Monument groundwater is monitored at one well, Well 621935, which is located outside the park approximately 1.3 mi northwest of headquarters (Figure 1). This well is monitored annually by the Arizona Department of Water Resources (ADWR); data are available at the Arizona Department of Water Resources Well Registry.
Results for Water Year 2022
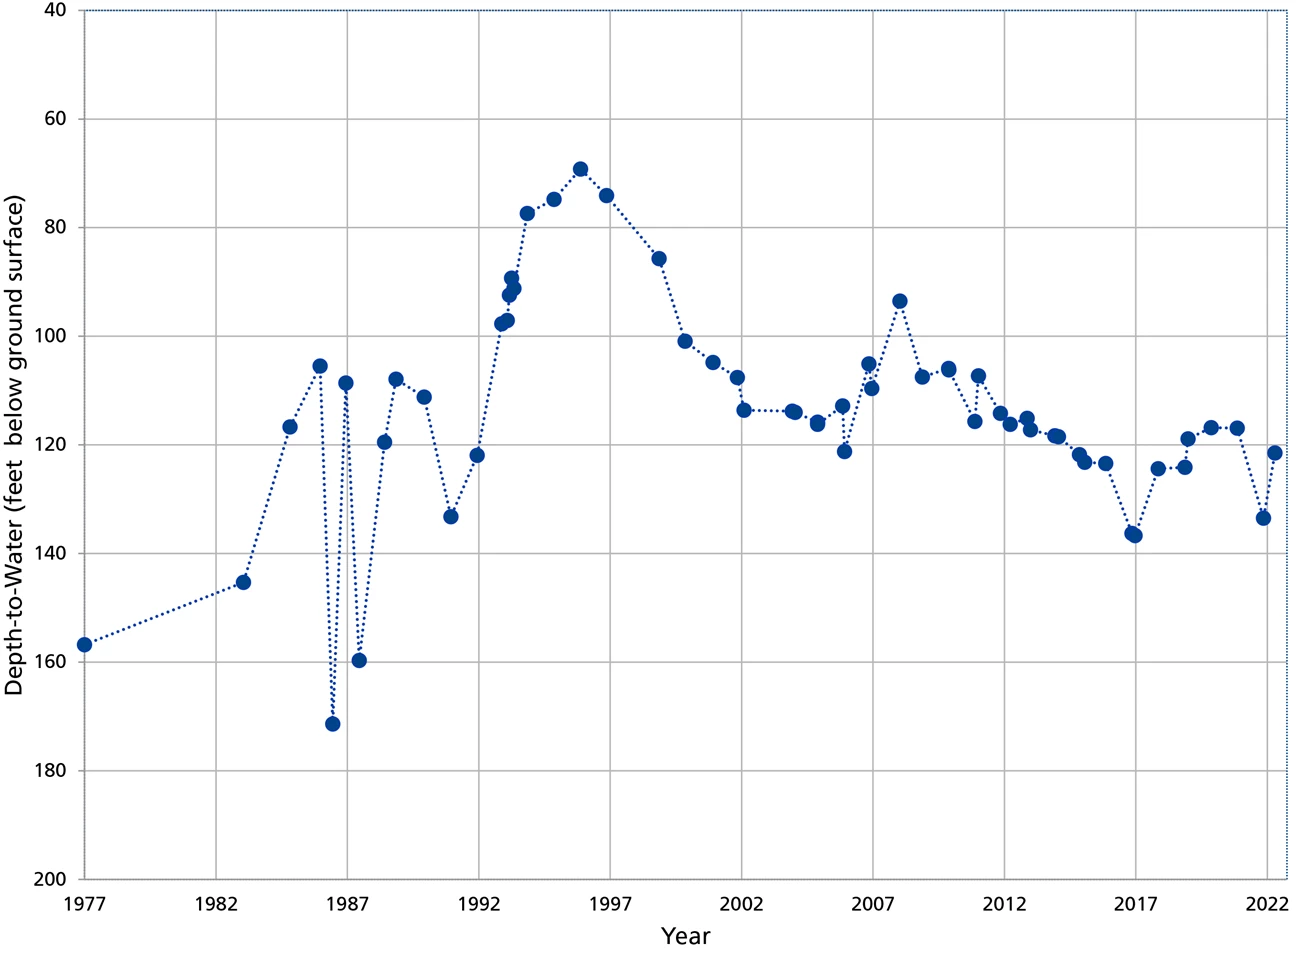
Well 621935 was measured twice in WY2022. Water levels were 133.60 ft (40.72 m) below ground surface (bgs) on 9 November 2021, and 121.50 ft (37.03 m) bgs on 18 April 2022 (Table 1). Both measurements are within the historical range of water levels in the well which has varied 102.2 ft (31.15 m), with a low of 171.40 ft (52.24 m) bgs in June 1986 and a high of 69.20 ft (21.09 m) bgs in November 1995, following a large flood event on the Gila River. During the last decade water levels have been relatively stable (Figure 4).
| State Well Number | Wellhead Elevation (ft amsl) |
Average Depth to Water (ft bgs) |
Average Water Level Elevation (ft amsl) |
Elevation Change From WY2021 (± ft) |
Elevation Change From Earliest Recorded Water Level (± ft) (WY) |
|---|---|---|---|---|---|
| 621935 | 1,409.00 | 127.50 | 1281.50 | -10.60 | 29.30 (1977) |
NPS
Report Citation
Authors: Kara Raymond, Andy Hubbard, Cheryl McIntyre
Raymond, K., A. Hubbard, and C. McIntyre. 2024. Climate and Water Monitoring at Casa Grande Ruins National Monument: Water Year 2022. Sonoran Desert Network, National Park Service, Tucson, Arizona.
