Last updated: October 28, 2021
Article
Climate and Groundwater Monitoring at Casa Grande Ruins National Monument, 2017

Climate and hydrology shape the structure and function of ecosystems. This is particularly true in the Sonoran Desert, where water is the primary limiting factor in the lives of plants and animals. At Casa Grande Ruins National Monument, the Sonoran Desert Network monitors climate and groundwater. Understanding changes in these closely linked environmental factors is key to assessing the condition of park flora and fauna, as well as key cultural resources.
The climate of Casa Grande Ruins National Monument is classified as “arid.” This characterization is based on an aridity index. Used globally to classify climate zones, an aridity index considers long-term average annual precipitation relative to average annual potential evapotranspiration (the amount of water that would evaporate or be used by plants if water was unlimited).

Recent Findings
Findings are reported by water year (WY), which begins in October and ends the following September. Climate data are available at The Climate Analyzer.
Climate
Temperature. In WY2017, air temperatures at Casa Grande Ruins NM were generally higher than normal for most of the year (up to 7.0°F), with the exception of slightly below-normal temperatures during the summer months (up to -1.5°F). In WY2016, air temperatures were generally below normal (-1 to -4°F) from November through January, but soared in February and March relative to 1981–2010 normals. Minimum air temperatures were generally above normal throughout the warm season. Extremely cold days (<30°F) occurred less frequently (5 days vs. about 17 days) than average in WY2017, and were in the normal range in WY2016.

Precipitation. Annual precipitation at Casa Grande Ruins NM was only 73% of normal (6.73" vs. 9.18") in WY2017, and 72% of normal (6.57" vs. 9.18") in WY2016 when compared to normalized climate data for 1981–2010. Precipitation was below normal (69%, -1.68") for the fall and winter of WY2017. Winter rains tapered off early, and February and March rainfall was less than 39% and 35% of normal, respectively. An extremely dry spring and September resulted in total rainfall for the warmer months being 80% of normal despite slightly above-normal precipitation in July and August. In WY2016, very little precipitation fell during December, February, and March, which are typically among the monument’s wettest months. Yet in June, precipitation was about five times normal (0.25" vs 0.05").
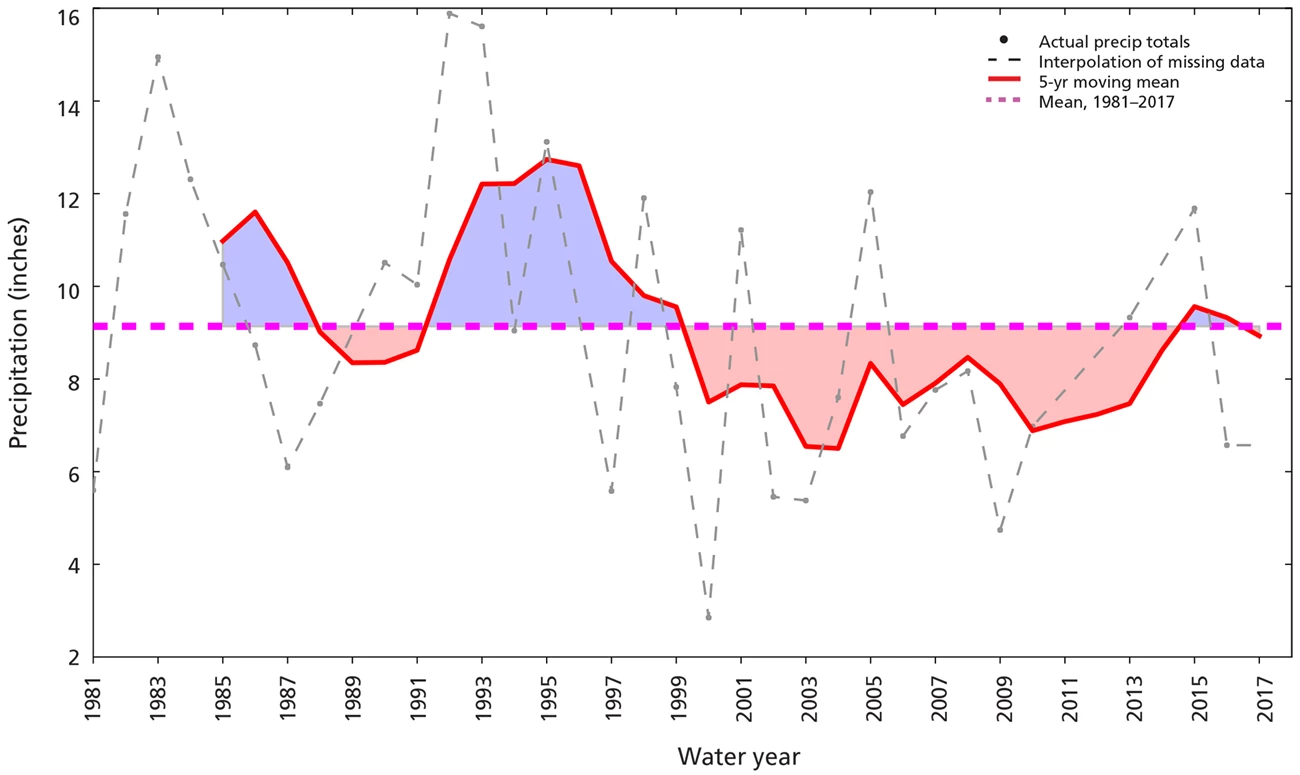
The reconnaissance drought index, a measure of drought severity and extent relative to long-term climate, reflects the extended regional drought since 2000. The five-year moving mean of total annual precipitation from 1981 to 2017 (see below) suggests that the monument experienced a brief water surplus in recent years—but the below-average rainfall in WY2016 and WY2017 has caused the five-year moving mean to fall below the mean for 1981–2017. There were no extreme precipitation events (>1") in WY2016 or WY2017, reflecting the overall drier-than-normal conditions.

Graphic generated by www.climateanalyzer.org

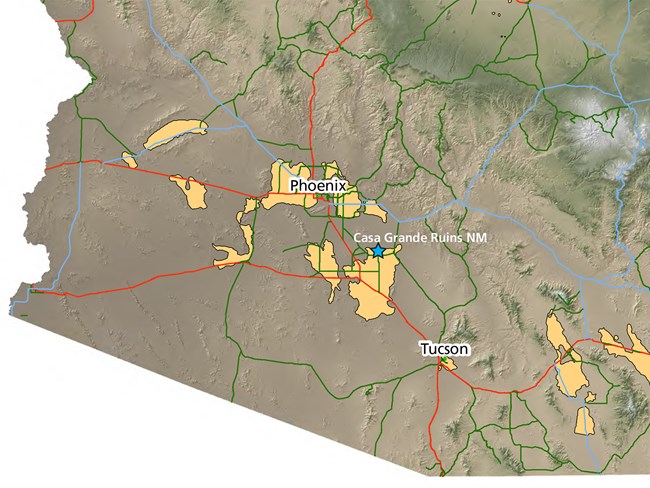
Arizona Department of Water Resources
Groundwater
Groundwater conditions have important implications for Casa Grande Ruins National Monument and the surrounding area. The monument is located in the north-central section of the Eloy groundwater subbasin. Since the early 20th century, the Eloy subbasin has been in groundwater deficit. More water has been pumped out of the aquifer than has been naturally replenished. This has resulted in substantial changes to the natural flow regime, declining water levels, and land subsidence (gradual collapse, fissuring or slumping in areas where deep basins filled with alluvial sediments are de-watered).
In the monument and the adjacent city of Coolidge, groundwater is the potable water source. Groundwater loss has the potential to affect the water supply as well as the stability of structures at the monument. Groundwater levels near Casa Grande Ruins National Monument in WY2017 declined 13.3 feet from WY2016, consistent with a general downward trend since 1995. In the area of the monument, land subsidence between 2010 and 2016 was 0–1 centimeter. From March 2016 to April 2017, subsidence was 0–1 centimeter in most of the monument, and up to two centimeters in some areas of the monument. Only a few minor fissures are known in the Coolidge area. Online viewing of natural hazards around the state, including earth fissures, is available from the Arizona Geological Survey.
Information on this webpage was summarized from: Filippone C., and K. Raymond. 2018. Status of climate and water resources at Casa Grande Ruins National Monument: Water year 2016 and Raymond, K., and C. Filippone. 2018. Status of climate and water resources at Casa Grande Ruins National Monument: Water year 2017.
