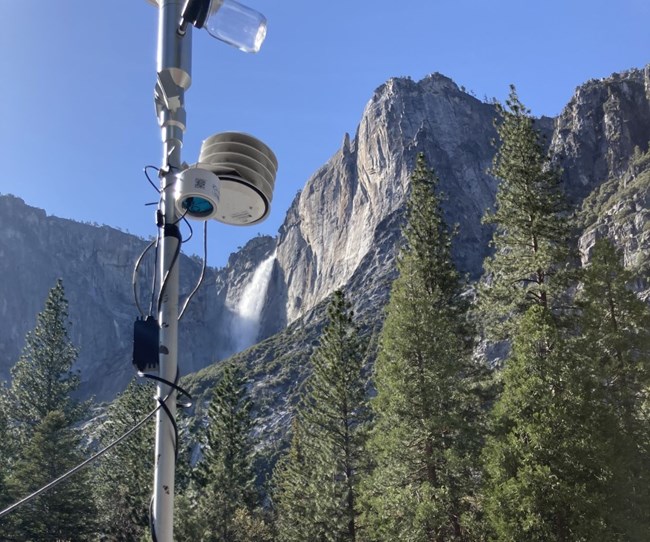
Wildfires generate large quantities of smoke that can be harmful to human health and affect how well and how far people can see. In addition to local impacts, smoke can be transported hundreds and even thousands of miles downwind. For example, a large wildfire in the west can impact air quality throughout the United States. This makes smoke an issue for all national parks, not just the ones with active wildfires.
The NPS monitors smoke in parks across the country to better understand and communicate about smoke impacts to air quality. The Smoke Monitoring Network measures and documents levels of particulate matter (PM), a primary component of smoke. Especially during wildfires, these data can help park staff track air quality, share information about potential health risks, and inform park management decisions.

NPS Photo
Who is monitoring and where?
PM is monitored across the U.S. by the NPS, states, tribes, and private citizens using a wide variety of instruments. These include permanent air quality monitors, temporary monitors just for smoke events, and low-cost sensors. The NPS has more than 100 in-park smoke monitors in 65 park units across almost 30 states and in American Samoa. A few parks have regulatory grade monitors that use the most accurate method for determining PM mass. However, the NPS typically uses low-cost sensors because they are significantly more cost-effective. Low-cost sensors are known to have large errors when PM concentrations are low, but they reliably measure high PM levels associated with smoke events. Low-cost sensors also work well in relatively remote locations.
What equipment do we use and how does it work?
The NPS primarily uses PurpleAir sensors to estimate smoke levels in many parks. PurpleAir sensors measure PM from all sources including smoke, dust, and man-made pollutants. Very high levels of PM are most often the result of smoke from wildfires. Along with information on current fires, these low-cost sensors provide valuable information about smoke levels in national parks. PM is reported as a mass concentration, that is the mass of particles in a given volume of air, usually given in micrograms (millionths of a gram) per cubic meter (μg/m3).
PM scatters and absorbs light. PurpleAir sensors work by measuring the amount of light scattering to estimate the total amount of PM in the air. To make the estimate, a fan is used to draw air into a small chamber within the PurpleAir sensor. Inside the chamber, a small laser illuminates the air sample and a detector located perpendicular to the laser light measures the scattered light. Because scientists know how much light particles typically scatter, the amount of scattered light can be used to estimate how much PM is in the air.
- Duration:
- 1 minute, 16 seconds
PurpleAir sensors are used by national park service scientists to monitor air quality and send live updates to nps.gov. In this video, take a closer look at how PurpleAir sensors work.
The calculated mass concentration estimate depends on the number and size of particles in the sample as well as the mix and types of particles present and the relative humidity. Variations in these factors can affect the accuracy of the PM estimate. In general, mass estimates are reasonably accurate for smoke. The NPS applies a correction factor developed by the Environmental Protection Agency (EPA) to all NPS data that makes the results even more reliable. In addition, each PurpleAir contains two sensors that operate at the same time and are compared against each other. This helps to ensure data quality. Additional quality control measures are also in place to remove data that do not meet certain quality standards. The PurpleAir collects data continuously, and hourly averaged data are reported on the NPS live weather and air quality data page.

How are the data used?
The NPS live weather and air quality data page displays real-time data from the Smoke Monitoring Network. The PM data are shown in terms of EPA’s Air Quality Index (AQI). The AQI provides a measure of the level of pollutants in the air to allow people to make informed decisions and take steps to protect their health. The color-coded scale runs from green, (0; good) to maroon (500; hazardous). Values above 500 are simply called “Beyond the AQI” and are considered extremely hazardous to human health. The AQI for PM is typically calculated using data from a 24-hour period. However, data from the Smoke Monitoring Network are displayed in terms of EPA’s NowCast AQI, which is responsive to rapidly changing air quality conditions such as during a wildfire.
Data from the NPS Smoke Monitoring Network are included along with data from regulatory instruments and other sensors outside of parks as part of the EPA Fire and Smoke Map webpage. This webpage also shows wildfire locations and smoke detections from satellite observations.
Last updated: April 19, 2023
