Submerged Cultural Resources Study:
USS Arizona and Pearl Harbor National Historic Landmark

|
USS ARIZONA MEMORIAL Submerged Cultural Resources Study: USS Arizona and Pearl Harbor National Historic Landmark |
|
|
Chapter IV: Biofouling And Corrosion Study Biofouling of Vertical Surfaces Results Approximately 25 common taxa of fouling organisms and 25 common species of fish were observed near the ship (Table 4.1). The checklist of organisms includes only macroorganisms that were readily identifiable and that collectively comprised more than 90 percent of the living biomass on or near the ship. The limits of time and survey resources excluded the inventory and identification of organisms that were rare, microscopic or cryptic in nature. Such organisms probably contribute little over all biomass or stability to the fouling communities and are only minimally relevant to the ship's corrosion. Table 4-1. Phyletic checklist of common organisms observed on USS ARIZONA. Plant Kingdom CYANOPHYTA (Blue-green Algae) -- film and filamentous blue-green
algae Animal Kingdom PROIFERA (Sponges) CNIDARIA (Coelenterates) ANNELIDA (Segmented worms) ARTHROPODA (Arthropods) MOLLUSCA (Molluska) ECTOPROCTA (Moss Animals) CHORDATA (Chordates) Ten taxa of fauna and five taxa of flora comprised the bulk of fouling observed on vertical hull and superstructure stations (Table 4.2). A combination of dead and live fouling covered an estimated 99+ percent of all surface area around all vertical stations. Zonation of organisms was evident, with maximum diversity and abundance of animals occurring in areas of higher water motion, such as in shallower depths and near the ship's bow and stern. In particular, the abundance of biofouling -- such as sponges (especially erect forms), foliaceous form of Schizoporella errata (bryozoan), large feather-duster worms, and Salmaoina dysteri (sagebrush tube worm) -- decreased with depth and the greater coverage of diatom/detritus mat. Vertical surfaces near the bottom (at depths of about 28 feet or more) were generally covered by a high percent of diatom/detritus mat and Branchiomma cingulata (colonial feather-duster worms). |
| Table 4-2 Composition and thickness of fouling at vertical hull and superstructure stations. | ||
| Key: | % = % areal coverage * = photo station #/m2 = no. of individuals per square meter |
abun = abundant (% areal coverage given if greater than 20%) pres = present in low abundance com = common b/g = blue/green; grn = green |
| Station | Water Depth (ft.) |
Sponges | Schizoporella | Branchiomma | Annelids lg. Sabellida |
Salmacina | Mollusks | Tunicates | Diatoms/ detritus |
Algae | Fouling Thickness (in.) | |||
|---|---|---|---|---|---|---|---|---|---|---|---|---|---|---|
| encrust. | erect | Vermetids | Oysters | Solitary | Colonial | |||||||||
| VS 1 | 12 | 65% | 10% | 5% | com | 5/m2 | 1% | com | 15/m2 | 10% | .75-2.5 | |||
| 2* | 22 | 65% | 10% | 5% | com | 5/m2 | 1% | com | 10/m2 | 20% | 1.0-3.0 | |||
| 3 | 28 | 55% | 10% | 3% | com | 5/m2 | 1% | com | pres | 10/m2 | 25% | .75-2.5 | ||
| 4 | 12 | 45% | 5% | 5% | pres | 4/m2 | com | pres | 10/m2 | 10% | 1.0-2.5 | |||
| 5 | 25 | 45% | 5% | 5% | pres | 4/m2 | com | pres | 10/m2 | 15% | 1.0-2.5 | |||
| 6 | 30 | 10% | 1% | com | pres | 20/m2 | 10% | red 80% | .75-3.0 | |||||
| 7 | 30 | 10% | 1% | com | pres | 20/m2 | 1% | 35% | .75-3.0 | |||||
| 8 | 32 | 10% | 1% | com | pres | 40/m2 | 35% | .75-3.0 | ||||||
| 9 | 21 | 10% | abun(50%) | pres | 12/m2 | 90% | .75-2.0 | |||||||
| 10 | 20 | 10% | 2% | abun(50%) | pres | pres | 12/m2 | 90% | .75-2.5 | |||||
| 11* | 13 | 20% | 7% | 1% | pres | 2/m2 | pres | pres | 15/m2 | 20% | b/g 7% red 10% | .75-2.0 | ||
| 12* | 27 | 25% | 5% | 2% | com | 1/m2 | com | 10/m2 | 15% | b/g 7% | 1.0-3.0 | |||
| 13 | 31 | 20% | abun(50%) | 5/m2 | 90% | 1.3-3.0 | ||||||||
| 14 | 7 | 20% | 5% | 1% | pres | 10/m2 | com | 20% | .63-2.0 | |||||
| 15 | 16 | 20% | 20% | pres | 10/m2 | pres | pres | 5/m2 | 20% | 1.3-3.0 | ||||
| 16 | 28 | 25% | abun(40%) | 3/m2 | 75% | 1.0-3.0 | ||||||||
| 17* | 8 | 15% | 5% | 15% | pres | 10/m2 | 5/m2 | 20% | b/g 7% | .75-3.0 | ||||
| 18 | 17 | 15% | 10% | 1% | pres | 10/m2 | pres | pres | 20/m2 | 30% | b/g 5% | .5-2.0 | ||
| 19 | 23 | 40% | pres | 10/m2 | 90% | red 40% | 1.0-3.0 | |||||||
| 20 | 14 | 60% | 15% | 1% | pres | 30/m2 | pres | pres | 10/m2 | 40% | 1.0-3.0 | |||
| 21* | 22 | 30% | 10% | 2% | pres | 1/m2 | pres | pres | 5/m2 | 50% | red 10% | 1.0-3.0 | ||
| 22 | 28 | 10% | 5% | abun(30%) | pres | 90% | .75-3.0 | |||||||
| 23 | 15 | 75% | 2% | pres | 10/m2 | com | 12/m2 | 20% | 1.5-3.0 | |||||
| 24 | 23 | 70% | 2% | com | 1/m2 | pres | pres | 20% | .75-3.0 | |||||
| 25 | 28 | 10% | 5% | abun(80%) | pres | 90% | .75-3.0 | |||||||
| 26 | 17 | 40% | 5% | 1% | pres | 15/m2 | 10/m2 | 20% | .75-3.0 | |||||
| 27 | 24 | 25% | 10% | 4% | pres | 5/m2 | 25% | red 20% | .75-3.0 | |||||
| 28 | 29 | 10% | abun(40%) | pres | 90% | .75-3.0 | ||||||||
| 29 | 17 | 30% | 20% | 5% | pres | 1/m2 | abun | pres | 5/m2 | 20% | 2.0-4.0 | |||
| 30* | 27 | 40% | 5% | 10% | pres | 1/m2 | pres | pres | 10/m2 | 15% | red 60% grn 2% | .75-3.0 | ||
| 31 | 32 | 30% | abun(40%) | 3/m2 | 100/m2 | 50% | red 20% | |||||||
| 32 | 17 | 75% | 10% | 2% | com | 10/m2 | 1% | com | 10/m2 | 15% | .50-2.0 | |||
| 33* | 28 | 25% | 20% | 2% | com | 1/m2 | com | 30/m2 | 2% | 15% | grn 15% | .50-2.5 | ||
| 34 | 32 | 5% | 5% | 1% | abun(75%) | 4/m2 | com | 10/m2 | 10% | red 40% | .75-2.0 | |||
| 36 | 17 | 15% | 15% | 5% | pres | 5/m2 | 1% | abun | 12/m2 | 20% | red 50% | .75-3.0 | ||
| 37 | 24 | 70% | 10% | 10% | com | 15/m2 | pres | 12/m2 | 40% | .75.-2.5 | ||||
| 38 | 32 | 20% | 30% | 5% | abun(50%) | 3/m2 | pres | 20/m2 | 50% | 1.0-2.5 | ||||
| 39 | 17 | 50% | 10% | com | 10/m2 | com | 12/m2 | 25% | .75-3.0 | |||||
| 40 | 26 | 20% | 5% | 1% | pres | 12/m2 | pres | 15/m2 | 60% | red 25% | .75-3.0 | |||
| 41 | 31 | 20% | 1% | abun(60%) | pres | 50/m2 | 90% | red 20% | .75-3.0 | |||||
| 42 | 18 | 50% | pres | 3/m2 | pres | pres | 10/m2 | 40% | 1.0-3.0 | |||||
| 43* | 24 | 50% | 5% | 2% | pres | 5/m2 | 40% | red 10% grn 3% | 1.0-3.0 | |||||
| 44 | 29 | 10% | abun(60%) | 20/m2 | 90% | .75-2.5 | ||||||||
| 45* | 9 | 40% | 10% | pres | 8/m2 | com | 50/m2 | 30% | red 15% b/g 5% | .75-3.0 | ||||
| 46 | 14 | 30% | 10% | 1% | pres | 5/m2 | pres | 20/m2 | 50% | .75-3.0 | ||||
| 47 | 27 | 5% | abun(50%) | pres | 5/m2 | 80% | .75-2.5 | |||||||
| 48 | 10 | 50% | 5% | 5% | pres | 10/m2 | abun | 10/m2 | 15% | red 20% | .75-3.5 | |||
| 49 | 18 | 50% | 5% | abun(20%) | pres | pres | 30/m2 | 80% | 1.0-3.0 | |||||
| 50 | 27 | 1% | abun(20%) | pres | pres | 30/m2 | 80% | .75-3.0 | ||||||
| 51 | 12 | 20% | 5% | 10% | pres | 10/m2 | com | 5% | red 20% | 1.5-3.5 | ||||
| 52* | 20 | 5% | 2% | 1% | abun(40%) | pres | 30/m2 | 50% | 1.0-2.5 | |||||
| 53* | 17 | 5% | 2% | 1% | abun(80%) | 5/m2 | 1% | 15/m2 | 90% | b/g 1% | .75-3.0 | |||
| 54 | 17 | 5% | 2% | 2% | abun(80%) | 1% | 15/m2 | 90% | .75-3.0 | |||||
| 55 | 28 | 10% | 3% | abun(80%) | pres | 20/m2 | 40% | .75-2.5 | ||||||
| 56 | 27 | 5% | abun(75%) | pres | 5/m2 | 70% | 1.0-3.0 | |||||||
| 57 | 11 | 50% | 15% | 2% | pres | 5/m2 | 1% | com | 100/m2 | 10% | .75-3.0 | |||
| 58 | 18 | 75% | 12% | 1% | pres | 25/m2 | com | pres | 100/m2 | 20% | .75-3.0 | |||
| 59 | 24 | 25% | 10% | 1% | abun(50%) | com | pres | 100/m2 | 25% | 1.0-3.0 | ||||
| 60 | 10 | 50% | 10% | 15% | pres | 5/m2 | 1% | pres | pres | 100/m2 | 1% | 10% | .75-3.0 | |
| 61* | 17 | 70% | 10% | 5% | com | 5/m2 | 1% | pres | pres | 100/m2 | 30% | .75-3.0 | ||
| 62 | 27 | 10% | 5% | 1% | abun(80%) | 1% | 5/m2 | 90% | red 30% | .75-3.0 | ||||
|
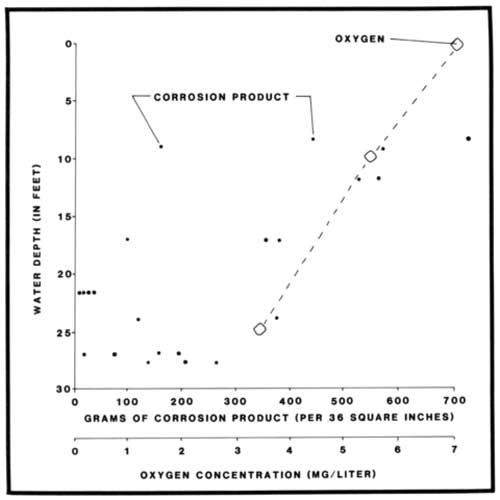
Although vermetid mollusks and oysters were not observed at some vertical stations, it is likely they were present at the majority of those stations but not readily visible because of coverage by encrusting biofouling. Hard fouling at all stations was found to consist of entwined masses of oyster and vermetid shells. Hard fouling extended beneath the bottom silt on hull surfaces, and was exposed by digging holes about 3 feet into the silt at representative locations; that hard fouling layer had apparently grown on the lower hull areas-before they were covered with silt by sedimentation or hull settling. No correlation was found to exist between water depth and thickness of hard fouling, indicating that, over the long term, growth of oysters and vermetids had been relatively unaffected by depth and water motion. Hard fouling averaged about 3/4-inch thickness on vertical stations, where that layer serves as a primary barrier in protecting underlying steel/oxides from corrosive effects of overlying water and, at present, appears to be stable and well-bonded to the hull. Dry weights of fouling growth scraped from 36-inch-square areas at the photo biostations ranged from 45 to 197 grams (Table 4.3). No correlation exists between fouling dry weight (or hard fouling thickness) and the amount of dry-weight corrosion product underlying that fouling. However, a plot of grams of corrosion product per scraping area versus water depth (Figure 2) indicates that formation of corrosion products has been maximal at shallower depths and has occurred at lower rates at depths of 20 to 30 feet. This correlation is consistent with the fact that oxygen, which accelerates corrosion by serving as a cathodic depolarizer, also declines with depth in Pearl Harbor waters.
No traces of coral growth were found on or mixed in any of the hard fouling examined on the hull or superstructure surfaces. Lack of any coral growth on the USS ARIZONA hull, which had been submerged for nearly 45 years at time of study, agrees with observations that live hard corals have apparently not existed in Pearl Harbor in historic times. Data regarding the presence/absence of biofouling and the rate of coverage was obtained by examination of the biostation photographs combined (averaged) with in situ visual data, presented here in Table 4.2. The photo slides are in the possession of NPS (Arizona Memorial) for comparison with photos of the same biostation areas that may be obtained in future monitoring studies. Biofouling now present on the USS ARIZONA consists largely of filter-feeding organisms that depend primarily on plankton and suspended detritus for food. The high concentrations of those food items found in Pearl Harbor are in turn dependent on abundant supplies of dissolved nutrients (primarily nitrogen and phosphorus compounds) derived from freshwater influx (streams and springs) and domestic sewage. As nearly all sewage discharge has been terminated in recent years, it is expected that plankton populations will decline drastically in abundance as residual nutrients are slowly discharged from the harbor. Because it is not known how long "excess" nutrients will be recycled or stored in the harbor, it is difficult to assess potential time frames and degrees of effects that sewage diversion will have on Pearl Harbor fouling communities. Additionally, data relating to the biological condition of Pearl Harbor prior to accumulation of sewage (nutrient) pollutants is very sparse and of no predictive value. It should be noted that even if it were known with certainty that fouling communities would be reduced significantly by declines in pollution, that there are probably no practical ameliorative measures that could halt those declines. A recommended strategy is to establish a long-term program to monitor fouling growth on the hull. Annual inventory of density and composition of fouling at the photo biostations (which are marked by attachment studs) would probably be sufficient to define changes in the biofouling layer that would be of possible consequence to corrosion potential of the hull.
http://www.nps.gov/usar/scrs/scrs4b.htm Last Updated: 27-Apr-2001 | ||||||||||||||||||||||||||||||||||||||||||||||||||||||||||||||||||||||||||||||||||||||||||||||||||||||||||||||||||||||||||||||||||||||||||||||||||||||||||||||||||||||||||||||||||||||||||||||||||||