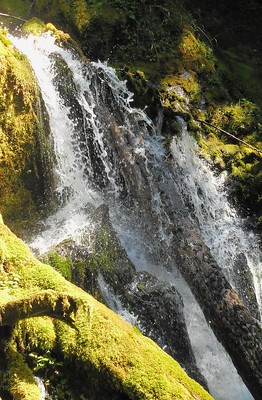
NPS Photo Rainfall That MattersWater and air are necessities of life for people, other animals, and plants alike. The amount of water that falls in Olympic National Park is part of what makes it famous, as it provides life for some of the largest trees. The Hoh Rainforest gets an average of about 140 inches (3.55 meters) of precipitation each year. As that rain falls week to week, scientists are able to understand more of our atmosphere.The National Atmospheric Deposition Program, or NADP, has been operating studies on the rainfall in the Hoh Rainforest since May 20, 1980! The data logs show trends throughout that time. The NADP tests a variety of sites across the US to compare water quality including the acidity, conductance, and salinity, as well as the presence of minerals such as calcium, magnesium, potassium, sulfates, nitrates, chloride, and ammonium. While some of these are naturally occuring and can be beneficial in rainwater, unnatural levels of these can be indicators of an imbalance in the atmosphere. For example, while rainwater is naturally slightly acidic, if the balance changes, acid rain can occur. This phenomenon can be detrimental to forests and waterways. Acid rain is a prime example of the consequences of pollution in the atmosphere. The National Trends Network of NADP tests and compares over 250 locations! The Hoh Rainforest is such an important site due to the cleanliness of the rainfall. It acts as a control to compare other sites against. As most sites are, the Hoh monitoring site is a fantastic candidate due to its location. It is far from urban areas and point sources of pollution that could change data points. The collection system is automated to assure quality and the collector is only opened when it becomes wet. The samples are collected weekly on Tuesday mornings by park staff and shipped out to be analyzed. Then, certified cleaned recepticles are redistributed for the next week's data. Studies such as this allow scientists a closer look at the health of our atmosphere. Acid rain and unnatural pollutants found in rainwater are indicators of potentially poor air quality. Being able to understand the pollution in our rainfall is a primary step on the path to protecting our natural areas. 
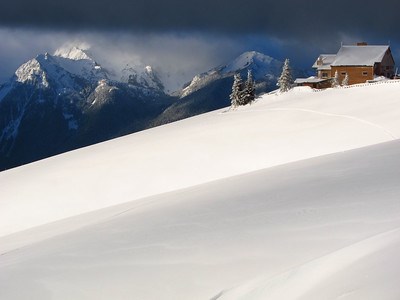
NPS Photo The Impact of SnowpackSnow in the Olympic mountains can been seen all year long. It is important to note in order to be prepared, as snow can lead to more dangerous recreation and road closures. The testing of snowpack helps to give the most up-to-date information on weather conditions, avalanche conditions, road conditions, trail conditions and what to expect during a visit on any given day! The snowfall also tells a story of the year to year and season to season changes.This story is montiored by scientists through in-person studies and SNOTEL (Remote Snow Telemetry) equipment. There are four SNOTEL monitoring sites on the Olympic Peninsula. They were installed in 1990, 1999, 2000, and 2008. To understand daily conditions as well as trends through the snow season, this equipment tests a number of factors in the snowpack. Snowpack is the hardened, or packed, snow that has accumulated throughout a season. Looking within these snowpacks is like reading the rings of a tree. Each snowdrift tells the amount of snow that fell on any given day, how wet or dry the snow was, and how much it started to melt after falling. The daily testing consists of learning the total volume of water in a certain snowpack, the total amount of precipitation over a period of time, and the total snow depth in hourly updates and daily summaries. The day to day changes highlight the gain/loss for snow depth, snow water, and precipitation. This is vital information to be able to recreate safely and responsibly. For example, wetter, heavier snow, along with periods of melts and freezes, can cause weak points in the snow along slopes which can greatly increase the risk of avalanches. These daily changes can be compared to previous years to track differing trends. The ability to track these trends over time sheds light on the impacts of climate change in Olympic, particularly on the snowfall and glaciers. It can even give a projection for the future climate and weather patterns anticipated for the area. As we continue to monitor the snowpack in Olympic, we stay prepared for the changes in weather and climate. As visitors hike, snowshoe, and ski over the fresh-fallen flakes, the science of the snow pack builds below and a deeper understanding builds in our minds. |
Last updated: September 7, 2020
