Scientists, park managers, and others must be able to “see” data collected from dynamic ecosystems. Visualizing data that are collected over time—sometimes decades—is one way to do this. Displaying data using maps, charts, and graphs helps people identify and understand relationships between and among landscapes, climate, and natural resources. These data visualizers complement the scientific reports that result from our long-term monitoring program.
-
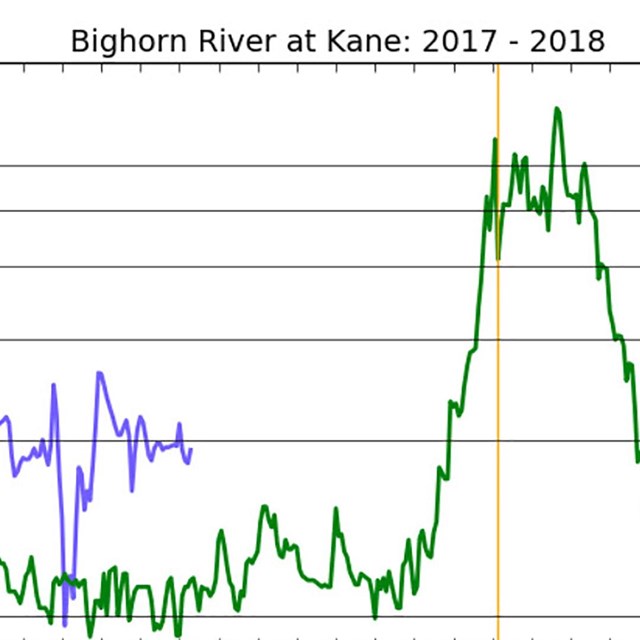 Climate Analyzer
Make your own climate graphs and tables based on precipitation and air temperature data from weather stations in and around national parks
-
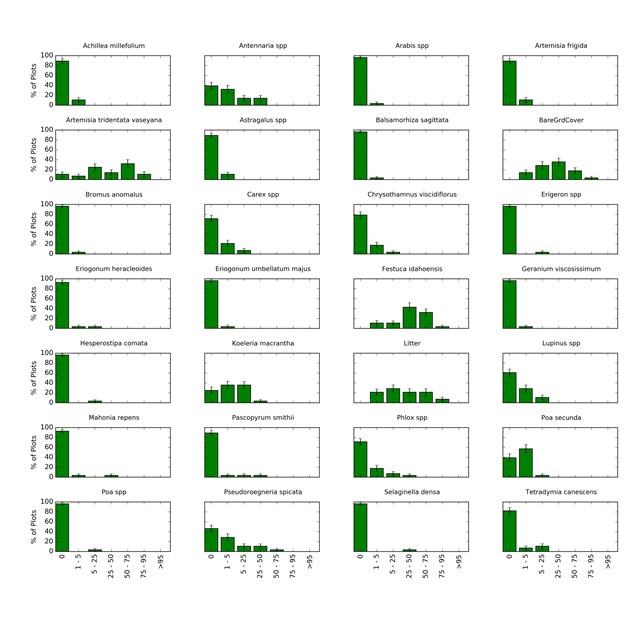 Vegetation Visualizer
Find graphs, maps, and tables of select plant species' cover in the Columbia Basin and the Greater Yellowstone Ecosystem
-
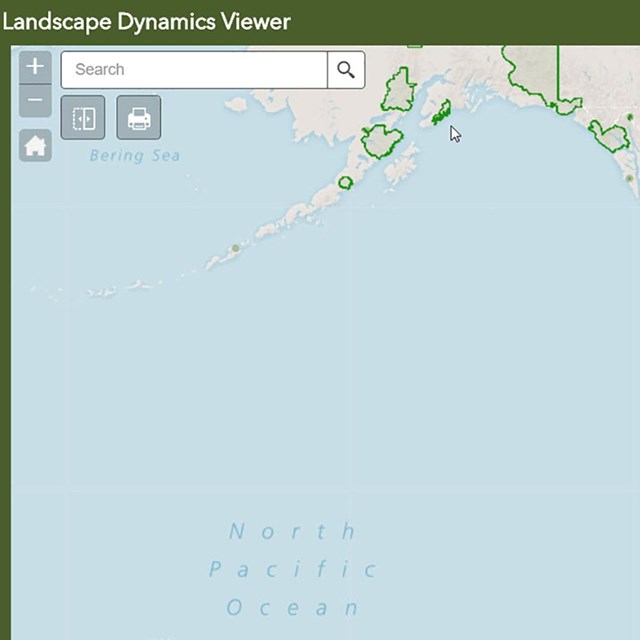 NPS Landscape Dynamics Viewer
Explore landscape dynamics data with this user-friendly, interactive map designed for GIS specialists and non-GIS specialists alike
Last updated: June 20, 2019