Last updated: February 15, 2026
Article
STARFire: Strategic budgeting and planning for wildland fire management
By Douglas B. Rideout, Andrew G. Kirsch, Yu Wei, and Nicole J. Kernohan
Lengthening fire seasons (Westerling et al. 2006), increasing fuel loads (USDOI and USDA 2014), flat budgets, and a growing wildland-urban interface have increased the complexity of wildland fire issues facing the National Park Service and other land management agencies. The National Cohesive Wildland Fire Management Strategy was initiated in 2009 (USDOI and USDA 2014) to address these and other wildfire management challenges across the United States. The strategy was completed in 2014 and identifies key goals of restoring and maintaining fire-resilient landscapes while considering “wildfire risk, values at risk, and appropriate response to wildfire at different temporal and geographic scales.” In addition to balancing wildfire management decisions between these objectives, the US Government Accountability Office (GAO, formerly the US General Accounting Office) continues to recommend that land management agencies improve the cost-effectiveness of fire programs with better accountability for spending (GAO 2002, 2005, and 2009). Similarly, the Cohesive Strategy (USDOI and USDA 2014) recommends performance measures and metrics for assessing the accomplishment of its outlined goals. The complexities of providing such metrics are highlighted in a report by the USDOI Office of Policy Analysis (2012). This analysis stresses that “[o]ne of the greatest challenges with comparing costs and benefits [of wildfire] is in characterizing everything in terms of a common metric, such as dollars, especially as nonmarket goods and services are often difficult to quantify and monetize.”
A collaborative effort, initiated about 2008, among the National Park Service, Colorado State University, and other USDOI bureaus (the Bureau of Land Management and the US Fish and Wildlife Service) led to the development of the spatial budgeting and planning system called STARFire to address this suite of wildfire management issues. STARFire was initially designed to address resilient landscapes by accounting for diverse landscape values (including nonmarket values), ecosystem condition, and management costs. As such, STARFire enables planners and managers to evaluate the risks of wildland fire while restoring and maintaining resilient landscapes in a cost-effective manner.
The inputs (management costs, burn potential, and fire-affected values) support calculations for STARFire’s performance metric of return on investment (ROI). This metric is tightly integrated within STARFire to support efficiency in data acquisition, storage, and system computations. This enables STARFire to support comparisons across management programs and accommodates analysis at varying geographical scales. For example, STARFire can be applied at individual parks (or planning units) or expanded to address regional- and national-level analyses. At the park level, STARFire’s ROI computation can account for, compare, and defend management decisions while supporting appropriation requests. At the national scale, STARFire provides efficient decision support for federal agencies to allocate money received from the Congress. Additionally, STARFire can prioritize expenditures to different locations across the country while identifying how that money would be spent to promote return on investment on fire management. It can quantify return on investment for planning alternatives and assess the impact of budget increases/decreases across fire programs. In particular, STARFire provides decision support and performance accountability for wildfire risk, fuel treatment programs, and preparedness programs.
STARFire’s analysis modules include the following:
Wildfire Risk Assessment—identifies where wildfire is expected to produce the most loss (considering all values) and where it can generate the greatest ecosystem benefit.
Landscape Value Added from Wildfire Management Activities—calculates the expected present value added to the landscape through management activities. For instance, this quantifies the potential to add value by conducting a fuel treatment or by engaging in protection through preparedness programs. This intermediate product is used to integrate the Fuel Treatment and Preparedness modules.
Fuel Treatment Analysis and Locator—aids fire planners in locating and prioritizing fuel treatments that reduce hazards or improve the ecosystem condition to provide the highest return on investment across the landscape. Optimal treatment locations can be modeled by STARFire or input by the analyst to be evaluated and prioritized.
Preparedness Analysis—preparedness is about getting ready for the fire season with crews and equipment, and STARFire models the return on investment across a range of potential preparedness budgets and values at risk.
Interprogram Analysis—STARFire analyzes the program balance between fuels and preparedness. Managing this balance, while including the interactions of these parameters, is a key element necessary for efficient management and budgeting.
The STARFire system and each of its analysis modules were created and programmed through a series of research agreements under the Colorado Plateau unit of the Cooperative Ecosystem Studies Unit (CESU) Network. Additional funding has been provided by the McIntire-Stennis research program at Colorado State University and by the Joint Fire Science program.
The STARFire analyses
Each STARFire module is supported by a set of common inputs, including fire-affected values, management costs, fire history, and burn probabilities. The landscape is rasterized for analytical purposes using a consistent cell size. Fire-affected values consider the entire spectrum of values, including property, infrastructure, and nonmarket goods and services such as critical habitat and watershed condition. Fire-affected values are defined spatially and their associated values are estimated using a structured elicitation process known as MARS (Marginal Attribute Rates of Substitution) (Rideout et al. 2008). This process requires convening a set of subject-matter experts with responsibility for managing the natural and ecological resources and for planning and managing fire at the site. During the elicitation process, experts identify and define the set of fire resources that are positively and negatively affected by fire. They then estimate the magnitude of the fire effect on resource value relative to each of the other resources in the value set (per cell). These values are also elicited by fire intensity and by ecosystem condition. These are defined economically as “rates of substitution” and kept in a nonmonetized internal currency in the analysis but can be easily converted and expressed in dollars (Rideout et al. 2008). The currency’s numeraire is highly valued property that is common across all areas to facilitate comparisons across the full range of values and across planning units; it is expressed in units occasionally dubbed WUIcoin, short for Wildland Urban Interface coin. For example, each planning unit has developed housing or its equivalent. A comparison of independently elicited values among several national parks (Rideout et al. 2012) demonstrates a remarkable consistency in the relative protection of and improvement in values of national park resources.
By introducing cost information and comparing it with values and probabilities, we are able to use expected return on investment as a single performance metric. The metric supports the direction given by the Government Accountability Office and addresses the challenge identified in the 2012 policy analysis document of comparing disparate values introduced in nonmarket valuation. The ROI metric enables efficient comparisons among management programs and among planning units within an agency. It also facilitates potential comparisons among agencies (with disparate values and missions) and across national programs. Fire behavior (generated from FlamMap or similar) and fire history information is used to estimate burn and ignition probabilities. The fuel models and fire behavior modeling parameters can be adjusted to model alternative scenarios such as longer fire seasons and increased fire loading. Fire behavior modeling outputs are static and vary by cell, are calculated for each burnable cell on the landscape, and are stored for use. Probabilities are then applied in two separate approaches: the first is to assess wildfire risk and the second is to assess the potential to add value on the landscape from wildfire management activities such as fuels treatment and preparedness budgeting. These analysis modules are described further later in this article.
STARFire analysis modules
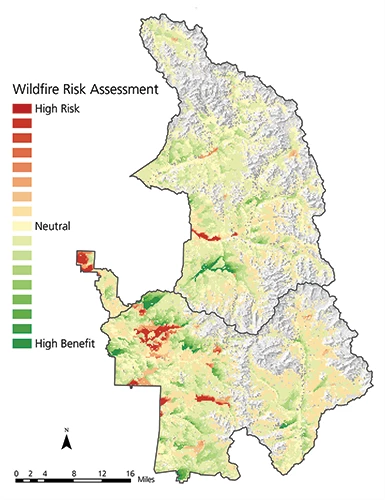
Wildfire Risk Assessment
This module can help managers visualize the appropriate response to wildfire anywhere on the landscape, and it can also be used to support post-fire reviews. STARFire builds a custom fire footprint based on conditional burn and spread probabilities for each ignitable cell on a gridded landscape (Rideout et al. 2008). Conditional probabilities refer to burn probabilities estimated given an ignition. Combining the probabilistic footprint with the fire-affected value information, STARFire estimates the expected net benefit of the fire footprint and stores it back at the ignition cell. The resulting output (fig. 1) quantifies the expected value of wildfire risk and benefit for each burnable cell on the landscape. The red cells indicate expected net loss and the green cells indicate expected net benefit from fires originating in that cell. A cell may be colored red because it contains a highly valued resource that would be damaged if burned. A cell may also be colored red because, if it ignites, it has the potential to burn into a sensitive value based on fire spread and the cell’s probabilistic fire footprint.
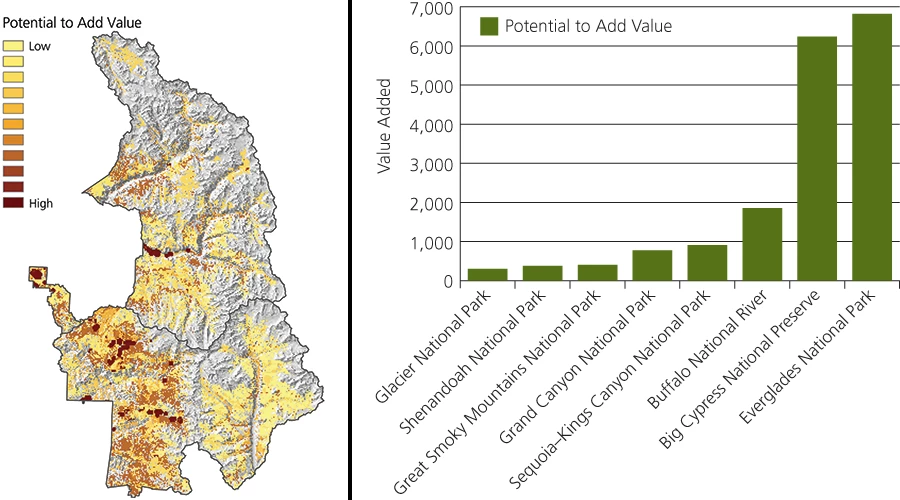
Landscape Value Added from Wildfire Management Activities
STARFire calculates the potential to add value from wildfire management activities (fig. 2, panel A) by combining the burn probability information, fire behavior, and the fire-affected value information. Burn probabilities are calculated for each cell on the landscape using fire behavior information and ignition probability information (generated from the fire history). The potential value added on each cell is given by the loss (benefit) of it burning and its probability of burning. Measuring the expected value added (VA) across the landscape enables the integration of STARFire program components such as fuels treatment and preparedness budgeting. In addition to assessing the potential to add value to a particular landscape, the measurement enables comparisons across planning units. For example, figure 2, panel B, demonstrates how the potential to add value from fire management activities can be compared across national parks (or other planning units) using the common currency of WUIcoin, described earlier.
Fuel Treatment Analysis and Locator
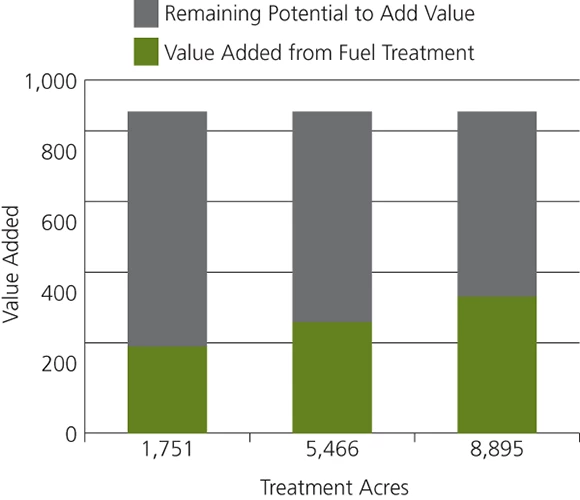
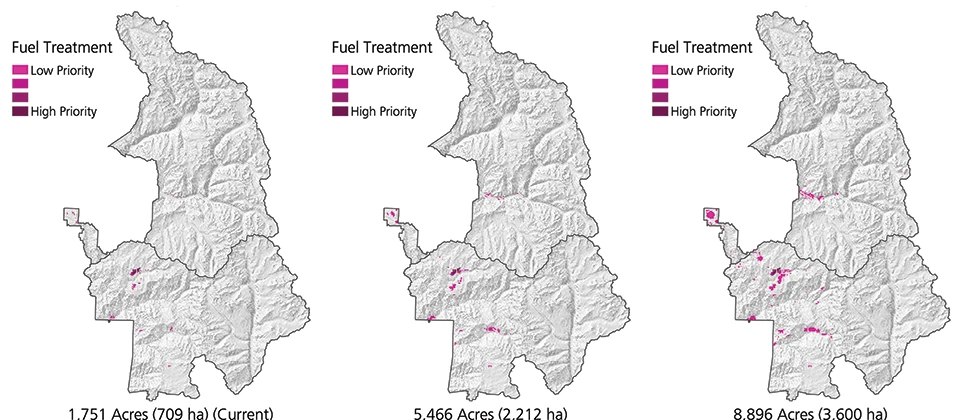
Land management agencies use fuel treatments to reduce hazardous fuels and to improve ecosystem condition, and these benefits often occur jointly. Guided by return on investment as a performance measure, STARFire optimizes and prioritizes fuel treatment locations to account for these effects and management costs (Rideout et al. 2014). The management costs often include considerations such as cover type, ecosystem condition (maintenance vs. restoration), treatment type, accessibility, and region. STARFire can identify optimal fuel treatment locations on the landscape based on return on investment, or alternatively, it can apply user-defined treatment schedules. To quantify the effect of the fuel treatment on the landscape, post-treatment fire behavior data are estimated (using FlamMap or something similar) by updating the fire modeling landscape to reflect the effects of the treatment (e.g., updated fuel models). The altered fire behavior (fire intensity, rates of spread, and spread direction) is then used to adjust STARFire’s use of fire-affected values and burn probability calculations. The value added by the treatment plan is assessed by comparing post- and pretreatment surfaces. This quantifies the amount of value added to the landscape from hazard fuel reduction and the expected benefit from the completed treatment. Figure 3, panel B, shows the STARFire recommended fuel treatment locations for three different acreage budgets. Panel A shows the value added from alternative budget levels. The results allow land management agencies to demonstrate the return on investment from their fuel treatment programs and how budget declines can reduce the value of the landscape.
NPS/Sequoia–Kings Canyon National Park (3)
Preparedness Analysis
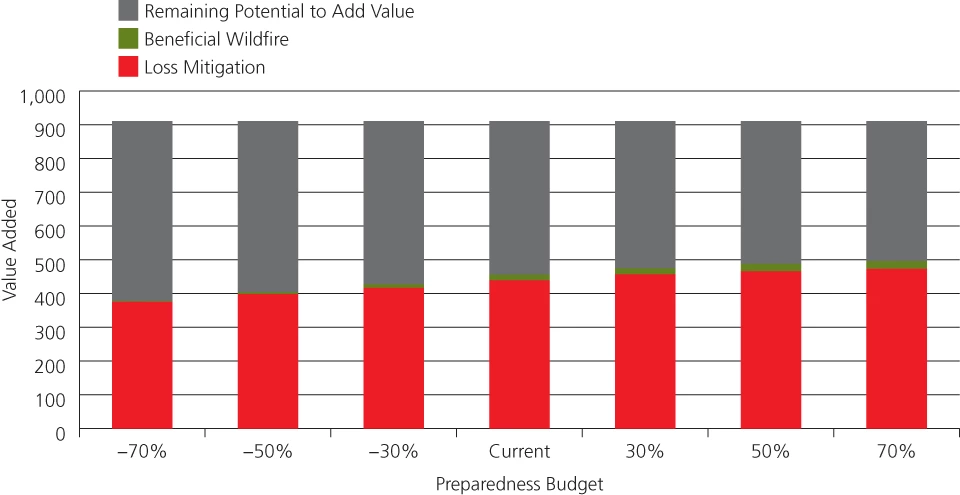
In planning and budgeting for preparedness, the National Park Service and other land management agencies are interested in the dual importance of reducing wildfire risk to highly valued resources (via initial attack) and the management of beneficial wildfire (BWF) for resource improvement or ecological restoration. Beneficial wildfire has been discussed under several aliases, such as “appropriate management response” and “wildland fire use.” To manage these dual purposes, agencies employ a similar set of resources, including crews, equipment, and planning. STARFire provides the unique ability to allocate a single “preparedness” budget to these dual purposes and assess how much value added and return on investment each component contributes (Rideout et al. 2016). For the risk reduction component, STARFire compares fire spread rates with arrival times for deployed resources using principles of diminishing returns and standards for initial attack success (Rideout et al. 2016). For the management of beneficial wildfire, STARFire uses diminishing returns to relate the preparedness budget with the expected value of benefit that incorporates the singular concept of relating BWF program size with program budget. Program size, for a given budget, is also uniquely related to the distance that any potential BWF cell is to a cell containing a valuable resource to protect, under the assertion that cells close to protection resources are more complex and costly to manage for beneficial wildfire (Rideout et al. 2016). Figure 4 shows the amount of value added by the preparedness program at alternative levels of funding for risk reduction (red bars) and the promotion of beneficial wildfire (green bars). Note that the amount of value added, including the benefits from wildfire, increases as budgets increase. STARFire can assess the potential value added from beneficial wildfire (green portion of the bars) and the value added from loss mitigation (red portion of the bars) by budget level.
Interprogram Analysis
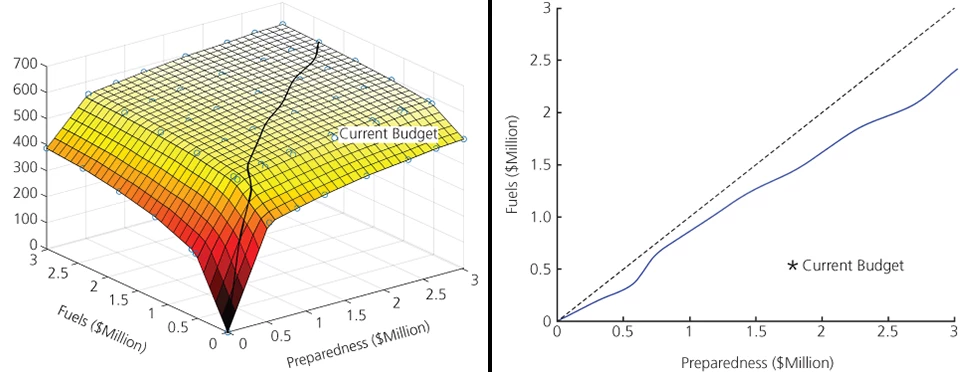
Another novel feature of STARFire is its ability to integrate the fuel treatment and preparedness analyses to guide more efficient management and budgeting for the fire program. Fuel treatments for hazardous fuel reduction typically reduce fire intensity and spread rates of future wildfires (Stratton 2004). Reduced spread rates improve the ability of the firefighting operation to contain fires successfully in initial attack, and lower intensities often reduce expected losses across the full range of resources at risk. Fires contained in initial attack are typically much less costly than those that spread. This is a key linkage between the preparedness program and the fuels program, and STARFire can quantify and provide decision support for managing the trade-off of this interaction. For example, figure 5, panel A shows an interpolated surface of the relationship of fuel treatment (y-axis) and preparedness (x-axis) funding levels. The height of the surface (z-axis) shows the amount of expected landscape value added by all combinations of the programs (Wei et al. 2016). The black line (expansion path) shows how increased funding would be allocated to the two programs. Starting at a zero budget, it balances the program funding alternatives to generate the greatest increase in value added without disrupting either program. This gives an intuitive interpretation of how funding allocations between the two programs affect value added to the landscape from the fire program. In panel B, the dotted line represents an equal balance of preparedness and fuel treatment funding and is used as a visual reference for equal funding between the two programs. The solid blue line was constructed from the expansion path in panel A. The white circle in panel A indicates the current mix of funding. Land managers can use STARFire’s interprogram analysis as a contextual guide on the allocation of funding between fuel treatment and preparedness programs. This example suggests that a relatively balanced allocation between fuel treatment and preparedness programs would yield optimal results for available funds.
Conclusions
STARFire represents the first science-based spatial planning and budgeting system available to the National Park Service and other bureaus of the Department of the Interior. The system reflects the stringent design criteria outlined in the Cohesive Strategy (USDOI and USDA 2014), especially pertaining to the inclusion and promotion of resilient landscapes and the protection of highly valued resources, while incorporating the key elements highlighted by the USDOI Office of Policy Analysis. To address the policy analysis concerns, STARFire uses a foundational analysis and common performance metric that is tightly integrated across each program component from risk analysis to the interaction of the fuels and preparedness programs. As such, the system enables land management agencies to plan and budget their wildfire programs in accordance with national directives. It is scalable from the local planning unit to regions and to national program analysis (Wei et al. 2016). For example, it can be used at the unit level to inform appropriate response to wildfire, optimize fuel treatment locations, and demonstrate the impact of budget changes on fire programs. At the program level, it helps agencies allocate their budgets for optimal return on investment, provides metrics for supporting budgeting decisions and appropriation requests, and aligns national and regional budgets with the goals and objectives of local units.
While STARFire was originally developed as a risk management tool to be applied at the planning unit level, its core principles, common metric, and modular design enabled it to grow into a comprehensive planning and budgeting system at the strategic level. With its rapid growth, the system has been tested on approximately 20 of the nation’s national parks. It has become part of the NPS national budgeting framework, where it is being evaluated for use at the regional level, including park groups in Alaska. Within the next three years, STARFire is planned to be completed in more than 50 locations that include all parks where wildland fire management actions occur. Because of its flexibility and scalability, it was also used to aid in the evaluation of fuel treatments on more than 15 million acres (6 million ha) of greater sage-grouse habitat in the northern Great Basin. It is currently being used to support fire management planning on BLM districts across the state of Idaho where the entire state will be processed singularly. These applications will provide crucial feedback as the system is developed for future implementations.
References
Rideout, D. B., J. B. Loomis, P. S. Ziesler, and Y. Wei. 2012. Comparing fire protection and improvement values at four major U.S. national parks and assessing the potential for generalized value categories. International Journal of Safety and Security Engineering 2(1):1–12.
Rideout, D. B., P. S. Ziesler, and N. Kernohan. 2014. Valuing fire planning alternatives in forest restoration: Using derived demand to integrate economics with ecological restoration. Journal of Environmental Management 141:190–200.
Rideout, D. B., P. S. Ziesler, R. Kling, J. B. Loomis, and S. J. Botti. 2008. Estimating rates of substitution for protecting values at risk for initial attack planning and budgeting. Forest Policy and Economics 10:205–219.
Rideout, D. B., Y. Wei, A. G. Kirsch, and N. K. Kernohan. 2016. Strategic planning and budgeting of wildland fire preparedness programs for risk management. International Journal of Safety and Security Engineering 6(2):246–253.
Stratton, R. D. 2004. Assessing the effectiveness of landscape fuel treatments on fire growth and behavior. Journal of Forestry 102:32–40.
US Department of the Interior and US Department of Agriculture (USDOI and USDA). 2014. The national strategy: Final phase in the development of the National Cohesive Wildland Fire Management Strategy. 93 pages. Accessed 28 July 2016 at https://www.forestsandrangelands.gov/strategy/documents
/strategy/CSPhaseIIINationalStrategyApr2014.pdf.
USDOI Office of Policy Analysis. 2012. Wildland Fire Management Program benefit-cost analysis: A review of relevant literature. US Department of the Interior, Office of Policy Analysis, Washington, DC, USA. Accessed 1 April 2016 at https://www.doi.gov/ppa/upload/Wildland_fire_literature_review
_060812FINAL.pdf.
US General Accounting Office (GAO). 2002. Wildland fire management: Improved planning will help agencies better identify fire-fighting preparedness needs. Report GAO-02-158. US General Accounting Office, Washington, DC, USA. 35 pages.
US Government Accountability Office (GAO). 2005. Wildland fire management: Forest Service and Interior need to specify steps and a schedule for identifying long-term options and their costs. Testimony GAO-05-353T. US Government Accountability Office, Washington, DC, USA. 15 pages.
———. 2009. Wildland fire management: Federal agencies have taken important steps forward, but additional, strategic action is needed to capitalize on those steps. Report GAO-09-877. US Government Accountability Office, Washington, DC, USA. 49 pages.
Wei, Y., D. B. Rideout, A. Kirsch, and N. Kernohan. 2016. Comparing alternative budget allocation models to support strategic wildland fire program analysis across US national parks. International Journal of Safety and Security Engineering 6(2):238–245.
Westerling, A. L., H. G. Hidalgo, D. R. Cayan, and T. W. Swetnam. 2006. Warming and earlier spring increase western US forest wildfire activity. Science 313:940–943.
About the authors
Douglas B. Rideout (doug.rideout@colostate.edu), professor, is with the Western Forest Fire Research Center (WESTFIRE), Department of Forest and Rangeland Stewardship, Colorado State University, Fort Collins, Colorado, USA. Andrew G. Kirsch, wildland fire management analyst, is with the National Park Service, National Interagency Fire Center, Boise, Idaho, USA. Yu Wei, associate professor, and Nicole J. Kernohan, research associate, are with WESTFIRE.
Tags
- sequoia & kings canyon national parks
- park science journal
- ps v33 n1
- research report
- budgeting
- bureau of land management
- department of the interior
- economics
- fuels treatment
- gis
- national cohesive wildfire management strategy
- national park service
- planning
- spatial planning
- preparedness
- return on investment
- scale
- natural resource management
- management tools