Last updated: August 23, 2019
Article
Forest Regeneration 2018
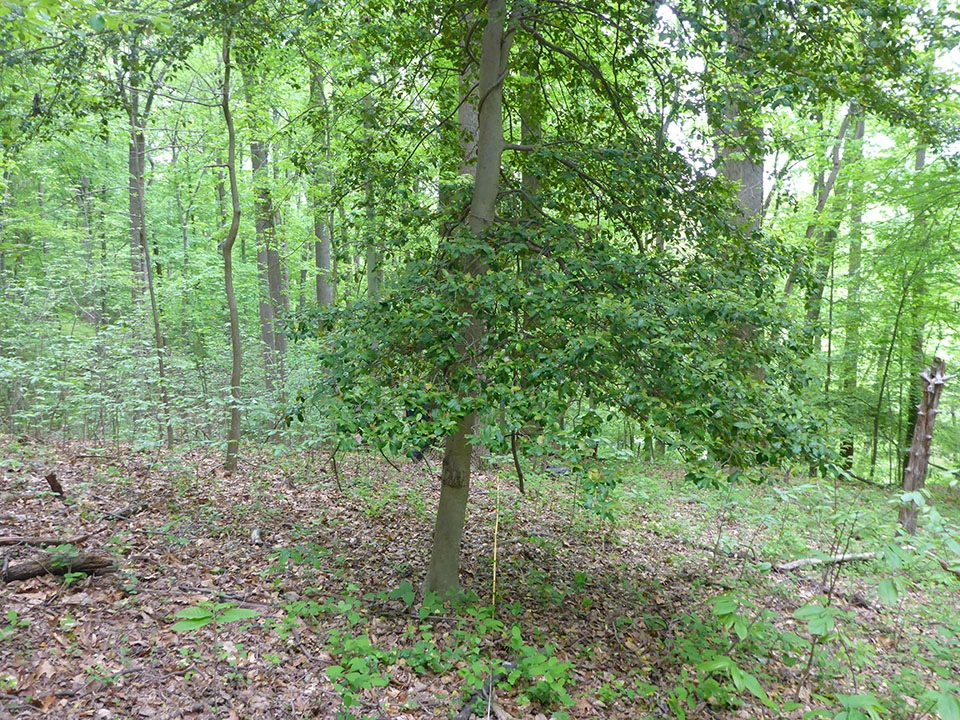
A Forest Plot at Rock Creek Park in 2012 and 2016 Showing Seedling and Understory Regrowth
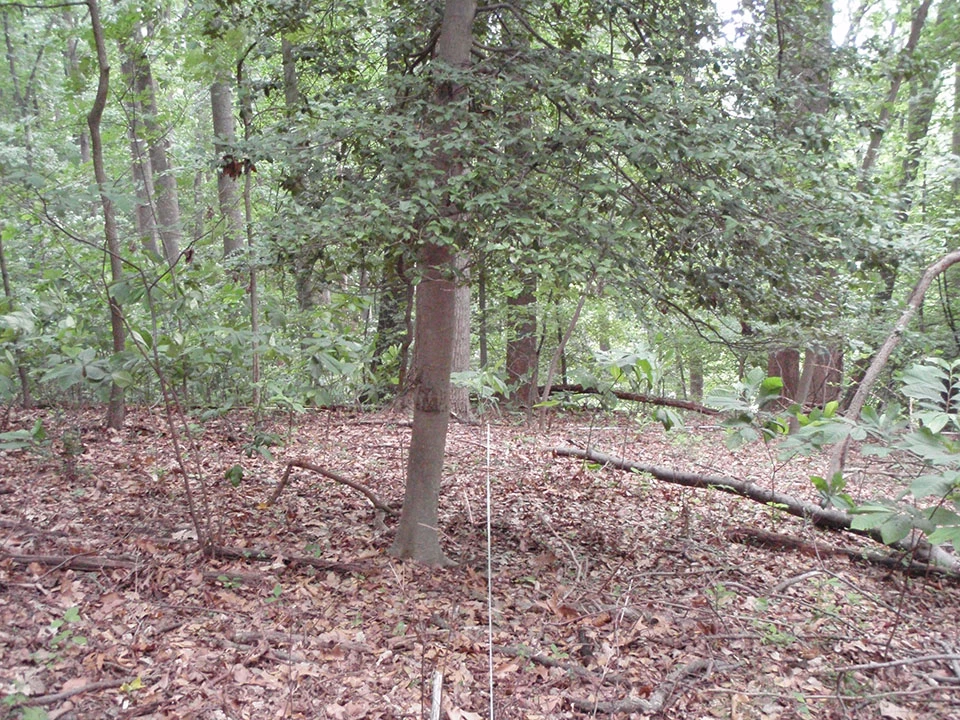
Left image
2012
Right image
2016
Importance
Forests make up about three quarters of the landcover in National Capital Region (NCR) parks, and their continued regeneration (the survival of seedlings and saplings to replace large forest trees as they die) is a growing concern.
If the forests of NCR parks were to gradually decline and diminish instead of regenerating, the parks would not only lose part of the distinct character, leafy shade, and cool microclimates that visitors enjoy, but the survival of animals and plants of all kinds that depend on the forests would be threatened. From the tiniest, most specialized insects and pollinators, to forest floor salamanders, to flying squirrels and wildflowers, an incredible number of species depend on the forests they live in.
Large white-tailed deer populations (>8/km2 per Horsley et al. 2003), like the levels found in the NCR, can not only significantly reduce forest regeneration, but can also reduce tree species diversity, density, and the average height of seedlings.
Assessing Regeneration
To assess forest regeneration, we analyzed long-term forest data from the National Capital Region Network, Inventory & Monitoring program (NCRN I&M). We used the number of seedlings and small saplings present, their size, and their distribution to calculate regeneration potential on a plot-by-plot basis with a formula called the “Stocking Index.” (See Citations)
Results - Low Regeneration Levels
Forest regeneration levels are low throughout National Capital Region parks (Figure 1). The stocking index threshold for healthy forest regeneration requires that 67% of forest plots should be adequately stocked with seedlings and small saplings. As with previous years, no park exceeded 30%.

NCRN forest data show tree seedlings present in all parks, with some improvements over time (Figure 2). However, because the stocking index includes both seedlings and small saplings, and assigns higher values to larger individuals, the increase in seedlings takes time to nudge up a stocking index score.

Where there are large deer populations, the seedlings that are present are often those less palatable to deer including species like American beech (Fagus grandifolia), pawpaw (Asimina triloba) - a non-canopy species, or the invasive tree of heaven (Ailanthus altissima).
The overall lack of forest regeneration throughout the National Capital Region remains a cause for concern and stocking index scores have changed very little since 2006-2009. As these low levels of regeneration persist, and as non-canopy species replace canopy species, forests may enter a period of long-term decline.
Park Forest Management
Catoctin Mountain Park, Rock Creek Park, Antietam National Battlefield, Monocacy National Battlefield, Manassas National Battlefield Park, and Chesapeake and Ohio Canal National Historical Park are all currently reducing their deer populations to help boost forest regeneration. Other NCR parks continue to work through the environmental compliance and funding processes to address forest regeneration and health through deer management.
While stocking index scores remain low at Catoctin Mountain Park, the abundance of small seedlings has surged since park deer reductions began in 2009. Seedlings grew from about 630 per hectare (2006-2009) to about 7060 per hectare (2015-2018). Similarly, at Rock Creek Park which began deer management in 2013, seedling numbers rose from 2,240 per hectare (2006-2009) to 5000 per hectare (2015-2018). These increases are not yet visible in the stocking index.
Since it takes 4 years to sample all park plots used in the stocking index, and deer management began less than 4 years ago at Antietam and Monocacy (2016), and Manassas and C&O Canal (2017), full results are not yet available for these parks. An increase in the stocking index for any of the parks pursuing deer management will be an important indicator of the effectiveness of this management.
Citations
For more detail on how the Stocking Index is calculated, refer to: Schmit, JP. and M. Nortrup. 2013. NCRN Resource Brief: Forest Regeneration 2013.
Learn More about the National Park Service's Inventory & Monitoring Efforts
To help protect natural resources ranging from bird populations to forest health to water quality, National Park Service scientists perform ecological Inventory & Monitoring (I&M) work in parks across the country. The National Capital Region Network, Inventory & Monitoring program (NCRN I&M) serves national parks in the greater Washington, DC area. To learn more about NCRN I&M forest monitoring, you can visit the NCRN forest monitoring webpage.
Printable versions of this resource brief (for 2018) and previous briefs on this topic from 2011 to 2017 are also available.
Tags
- antietam national battlefield
- baltimore-washington parkway
- catoctin mountain park
- chesapeake & ohio canal national historical park
- george washington memorial parkway
- greenbelt park
- harpers ferry national historical park
- manassas national battlefield park
- monocacy national battlefield
- national capital parks-east
- piscataway park
- prince william forest park
- rock creek park
- wolf trap national park for the performing arts
- forest
- tree
- regeneration
- stocking index
- seedlings
- ncrn
- i&m
- eastern deciduous forest