The glacier was [a] great plough set at work ages ago to grind, furrow, and knead over, as it were, the surface of the earth. Louis Agassiz

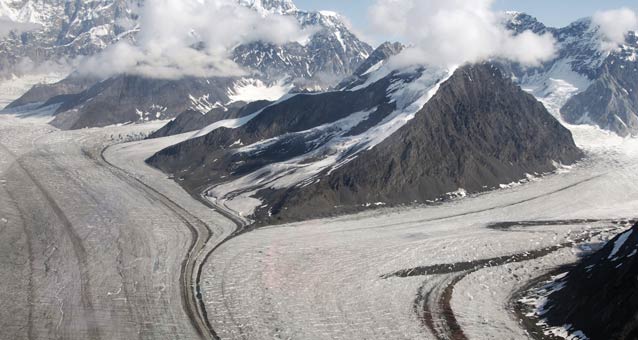
Climbers who spend nights on the Kahiltna Glacier during their ascent of Mount McKinley fall asleep to the unsettling creak, crack, rumble, and groan of the huge river of ice that slowly grinds its way down from the high valleys of the Alaska Range, plucking rocks from the sidewalls and valley floor.
The Kahiltna Glacier and many of the other icy ribbons in Denali National Park and Preserve flow from the “roof of North America” in the middle of a very cold land mass at a high latitude. Because of the latitude and altitude, Denali is a stronghold of glaciers. The land area of the park occupied by glaciers is about 16 percent. But are Denali’s glaciers shrinking because of climate change?
To learn more about Denali’s vast, icy resources, Denali resources staff, cooperating researchers, and citizen scientists (volunteers and field seminar participants) are engaged in a number of activities to monitor glaciers over time. The protocols are being incorporated into the Central Alaska Network’s glacier monitoring “vital sign” for Denali National Park and Preserve.
Index Glaciers: Kahiltna and Traleika
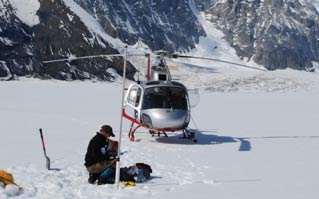
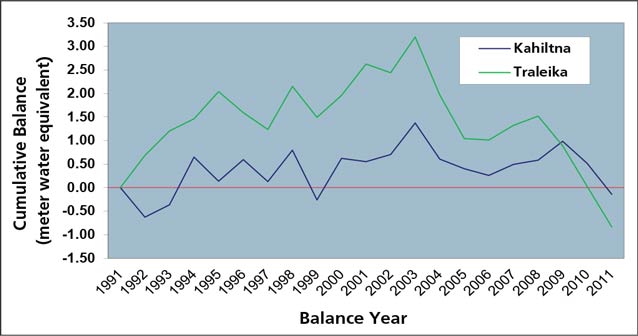
An important focus for glacier studies in the park is the re-measurement of the Traleika and Kahiltna glaciers, in order to monitor long-term glacier flow and mass balance changes. These glaciers were selected to compare glaciers on the north (Traleika) and south (Kahiltna) sides of the Alaska Range. Since 1991, each spring and fall, resources staff take measurements of snow/ice gain or loss at an “index” stake placed in the ice near the long-term balance point between snow accumulation and ablation (melting). The goal is to track the annual balance, that is, the net gain or loss of snow water equivalent—the amount of water held in the snow and ice—of the glacier. The annual balance sums the total winter snowfall and summer melt. For both glaciers, in 2011 the cumulative sum of annual balances since 1991 dropped below the balance that was measured in the initial year of measurement (see graph below).

NPS Photo
Changes in Glacier Area
Researchers also have taken a broad view of all glaciers in the park using a combination of satellite images and topographic maps to determine how the land area of glaciers has changed. A glacier extent map for Denali was produced in 2011 through a cooperative agreement with glaciologists at the University of Alaska Fairbanks (UAF) and Alaska Pacific University. The area of Denali glaciers has decreased by 8 percent over the ~60 years prior to 2010. Most of the loss in glacier area occurred on small- to medium-sized glaciers at mid-elevations between 4,600 and 5,900 feet (1,400 and 1,800 m).
A few glaciers, most notably the Muldrow and Peters glaciers, increased in area due to surging (fast glacier flow unrelated to climate change). When a glacier surges, water flow and the pulverized bedrock under the glacier become a conveyor belt for accelerated movement. The Muldrow surged most recently in 1956-1957 and the Peters Glacier in 1986-1987. Glaciologists have been monitoring and remapping the Muldrow Glacier in its quiescent phase to understand the thresholds that trigger surging. Another surge is predicted by the 2020s.
The map below shows the footprint of glaciers in the 1950s and today. Where red bleeds out past blue, a glacier has shrunk. Where blue extends beyond red, a glacier has surged.
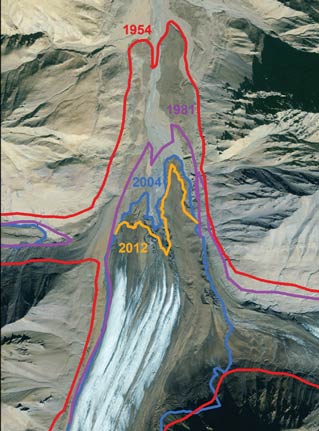
To track glacier trends over ~10 years, glaciologists and park staff have mapped and remapped the terminus outlines of several glaciers. These efforts use topographic maps, aerial photography, and satellite imagery, as well as ground surveys using GPS. Repeat measurements highlight changes in glacier area and terminus location. For example, in the case of the Middle Fork Toklat Glacier, from 1954 to 2012 the glacier retreated 82 feet (~25 m) per year. Rock debris commonly obscures the ice at the terminus, making mapping Denali’s glaciers a challenge. The debris cover also can insulate the terminus, so that the glacier area remains the same while the glacier is actually losing ice volume by thinning.

Image courtesy of IKONOS
Changes in Glacier Thickness
Tracking changes in glacier thickness gives the best information on a glacier’s response to climate change. UAF glaciologists have repeated surface elevation surveys using a sophisticated laser range finding instrument mounted on a small airplane for several glaciers, including the Middle Fork Toklat, Kahiltna, Traleika, Muldrow, Ruth, and Tokositna. Results of these surveys show a consistent pattern of ice thinning over the last 20 years, with some glaciers showing increasing rates of thinning since 2008. The Middle Fork Toklat Glacier’s rate of thinning increased from 5 feet/year (1.5 m/yr) during 2001- 2008 to 6.5 feet/year (2.0 m/yr) during 2008-2010.
Repeat Photography
Early scientists such as Stephen R. Capps (1910s and 1920s) and Bradford Washburn (1940s) captured quality photos of Denali’s glaciers during their explorations. Many of these images have been repeated to reveal dramatic changes between the past and today.
Learn more about the use of repeat photography in measuring glacier changes.

The chart above shows the cumulative balance for Denali’s index glaciers from 1991 to 2011. Both glaciers show a strong negative trend since 2004. The balance measured in 1991 was adjusted to be zero (red line).
Status of Denali’s Glaciers
Resources staff continue to collaborate with university glaciologists to integrate the findings from multiple approaches to glacier monitoring. What emerges is a more comprehensive picture of what is happening to Denali’s glaciers as a result of climate change. The rumble of ice that climbers hear may not be different in recent years due to climate change, but the evidence is clear that Denali’s glaciers are thinning and retreating.
Last updated: April 21, 2016
