Last updated: July 13, 2023
Article
Cascades Butterfly Project
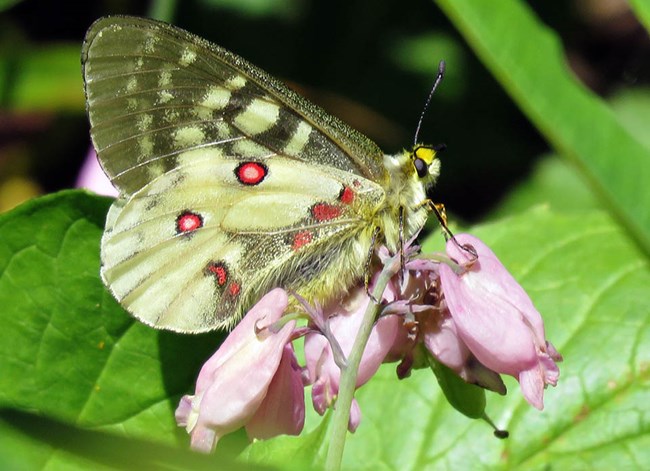
NPS / Cathy Clark
MAY 2018
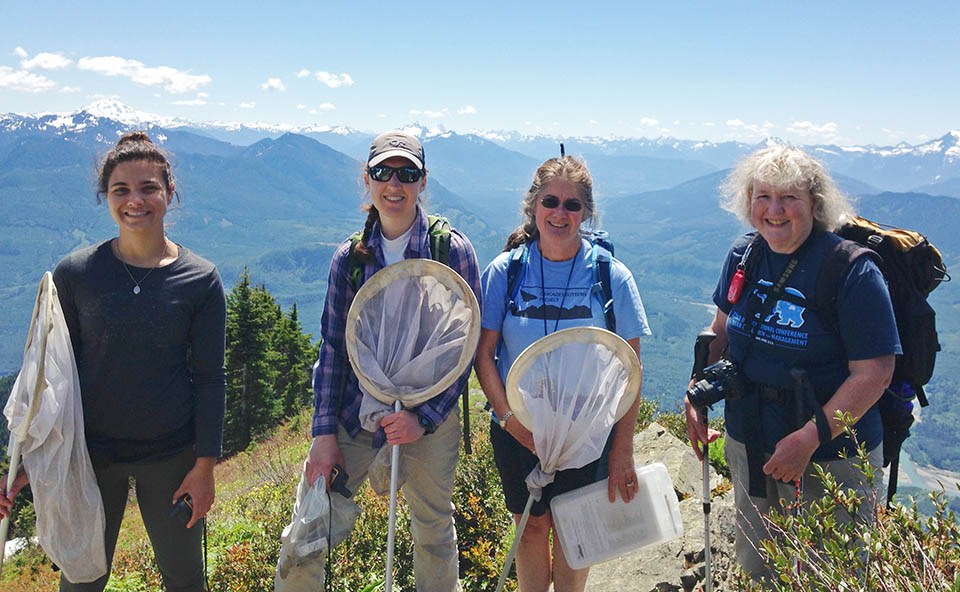
The Cascades Butterfly Project is a long-term monitoring program where citizen scientists (volunteers) and National Park Service Biologists monitor subalpine butterflies and plant phenology.
Butterflies and plants are sensitive indicators of climate change because air temperature influences their life cycles and their geographic distribution. As butterflies develop from egg to larvae to pupae and finally to full maturation, temperature thresholds may trigger these changes. Plant budburst, flowering, and fruiting times are also influenced by temperature and precipitation. Butterflies depend on plants as host plants – providing nectar or shelter for eggs and developing larvae.
NPS
Climate models project warmer summers, earlier snowmelt, more frequent forest fires, and changes in distributions of plants and animals, but not details on how species in our area will respond to these conditions. Studies in Europe and California have documented range shifts in butterflies in response to changing temperatures. Some species have moved northward or to higher elevations to track their optimal temperature range.
We are monitoring butterflies and plant flowering patterns to understand pollinators to understand how species in our parks are being influenced by warmer climates.
What Are We Doing?
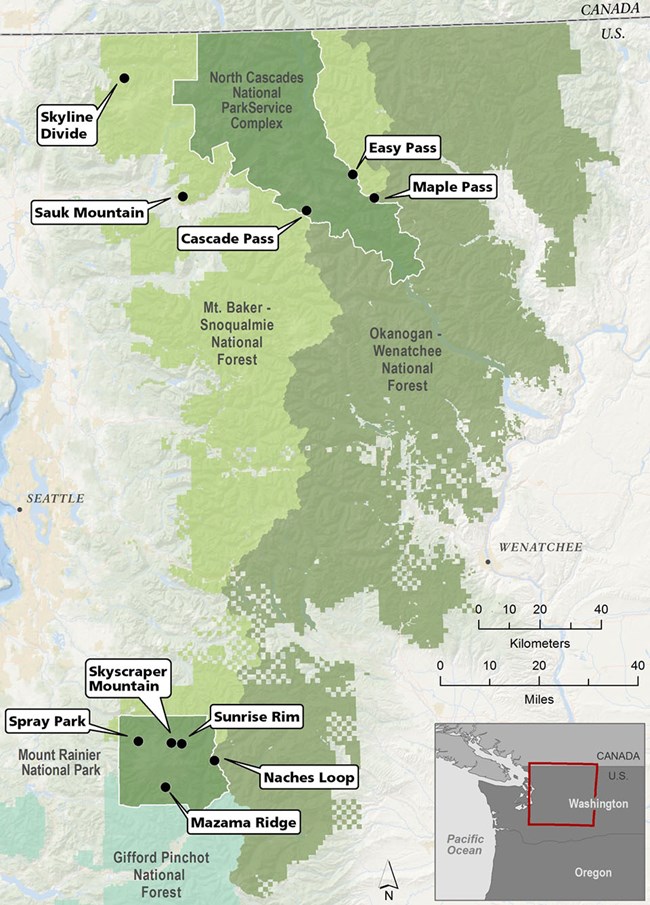
We are monitoring butterfly abundance and plant phenology at ten permanent survey sites in two national parks and two national forests:
- North Cascades National Park Service Complex
- Mount Rainier National Park
- Mount Baker-Snoqualmie National Forest
- Okanogan-Wenatchee National Forest
Monitoring Objectives
- Monitor long-term trends in butterfly species richness and population abundance in select areas
- Monitor long-term trends in plant phenology
- Engage citizen scientists in collection of data and communication of information to the general public
- Provide field science internship opportunities to young scientists
- Provide data to national parks and forests to inform and adapt land management practices as climate changes
NPS
Monitoring Methods
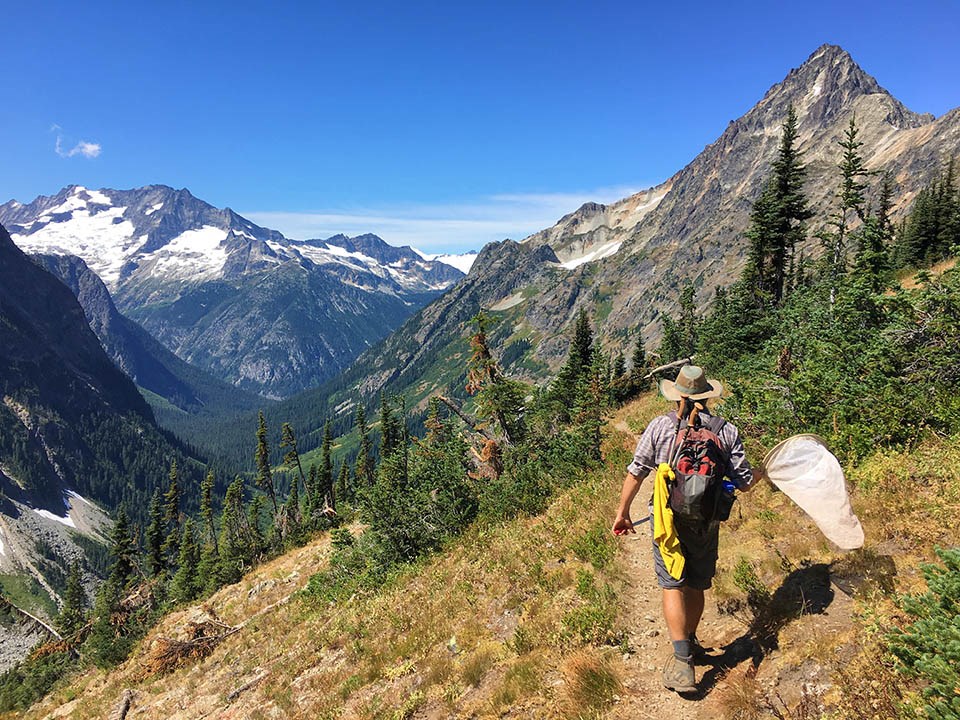
- Butterfly abundance and plant phenology is monitored along ten 1-kilometer survey routes in two national parks and two national forests
- Monitoring is conducted weekly from snow-melt (~early July) until the first frost (~early September)
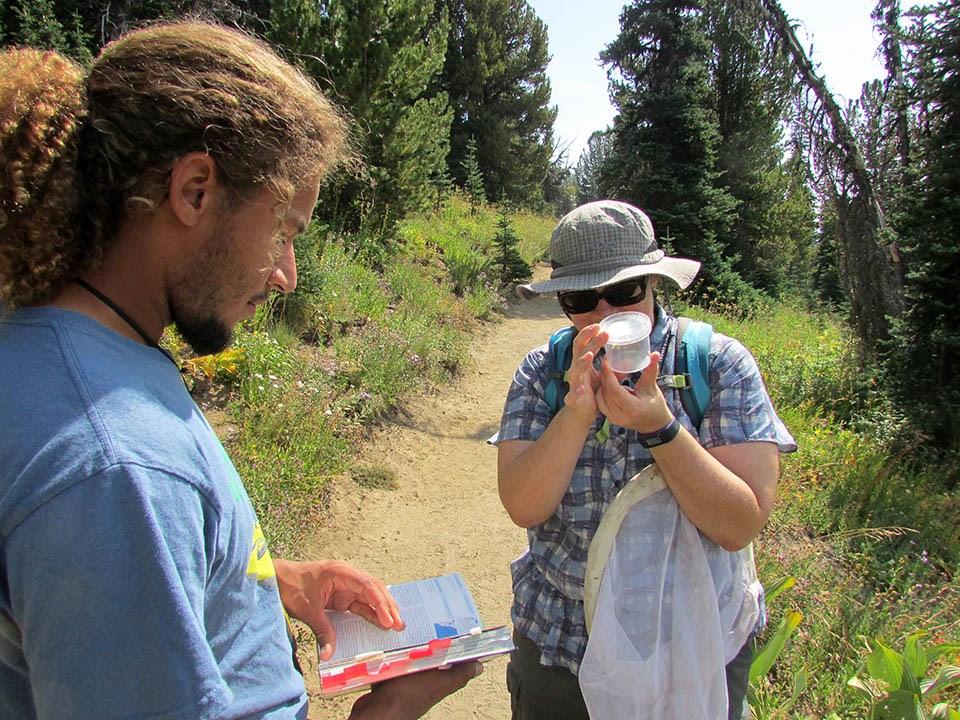
- Butterfly abundances are monitored using the Pollard Walk method
- Butterfly data are stored in partnership with the North American Butterfly Monitoring Network’s Pollard Base database (NABA) and Butterflies and Moths of North America
What Have We Found
Each year we have completed more surveys and documented more species with our volunteers and interns.
|
Year |
# Surveys |
# Species |
# Butterflies |
|---|---|---|---|
|
2011 |
29 |
23 |
819 |
|
2012 |
29 |
21 |
480 |
|
2013 |
34 |
21 |
1,585 |
|
2014 |
65 |
30 |
2,519 |
|
2015 |
100 |
36 |
4,431 |
|
2016 |
82 |
37 |
3,573 |
|
2017 |
88 |
34 |
3,276 |
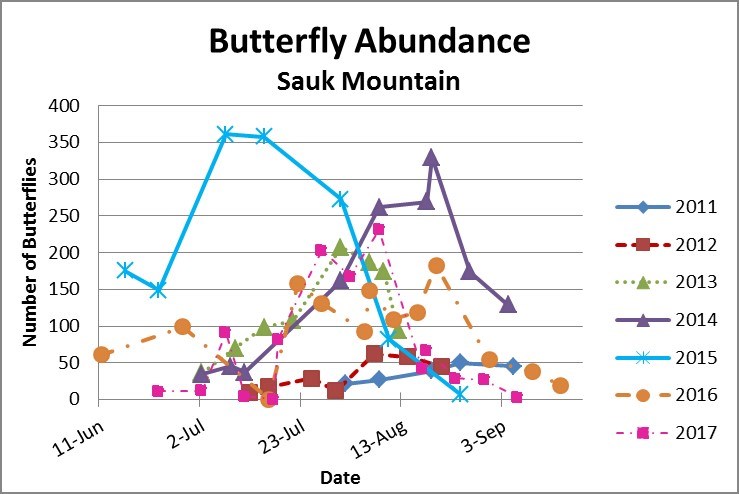
We have also found that peak butterfly abundance changes each year as snowmelt and summer temperatures change. In the graph below you can see the total number of butterflies found each week on surveys of Sauk Mountain in the Mount Baker-Snoqualmie National Forest. Notice the light blue line for 2015 which was a very warm and dry year with early snowmelt. Butterfly numbers peaked July 2-18 – about 3 weeks earlier than most other years. The table lists the dates of peak butterfly abundances on each route for 2015, 2016, and 2017. We are busy analyzing plant flowering times, but they seem to follow a similar pattern (earlier in warm, dry years).
| Site | 2017 Date | # Butterflies | 2016 Date | # Butterflies | 2015 Date | # Butterflies |
|---|---|---|---|---|---|---|
| Cascade Pass | Aug 17 | 71 | Aug 29 | 116 | Aug 11 | 111 |
| Easy Pass | Jul 25 | 132 | Aug 4 | 118 | Jul 14 | 169 |
| Maple Pass | Aug 2,9 | 40 | Aug 3 | 35 | Jul 14 | 24 |
| Sauk Mountain | Aug 7 | 231 | Aug 19 | 183 | Jul 7 | 361 |
| Skyline | Aug 9 | 78 | Aug 15 | 67 | Jul 7 | 125 |
| Mazama | Aug 4 | 45 | Aug 25 | 87 | Jul 6 | 242 |
| Naches | Aug 11 | 66 | Aug 19 | 59 | Jul 8 | 96 |
| Skyscraper | Jul 25 | 99 | Aug 15 | 58 | Jul 15 | 99 |
| Sunrise | Aug 1 | 88 | Aug 16 | 90 | Jun 30 | 113 |
| Spray Park | Jul 31 | 56 | Aug 24 | 49 | Jul 15 | 72 |
NPS
For More Information
Learn about volunteering for the Cascades Butterfly Project
Protocols & Procedures
Rochefort RM and McLaughlin JF. 2017. The Cascades butterfly project: A protocol for monitoring subalpine butterflies and plant phenology in the Cascade Mountains of Washington. Natural Resource Report. NPS/NOCA/NRR—2017/1440. National Park Service. Fort Collins, Colorado
Rochefort RM. 2017. The Cascades Butterfly Project: Survey routes, standard operating procedures, and field forms. North Cascades National Park Service Complex. Sedro-Woolley, Washington
