Last updated: August 8, 2018
Article
2018 Harbor Seal Monitoring Updates
Molting Season Summary
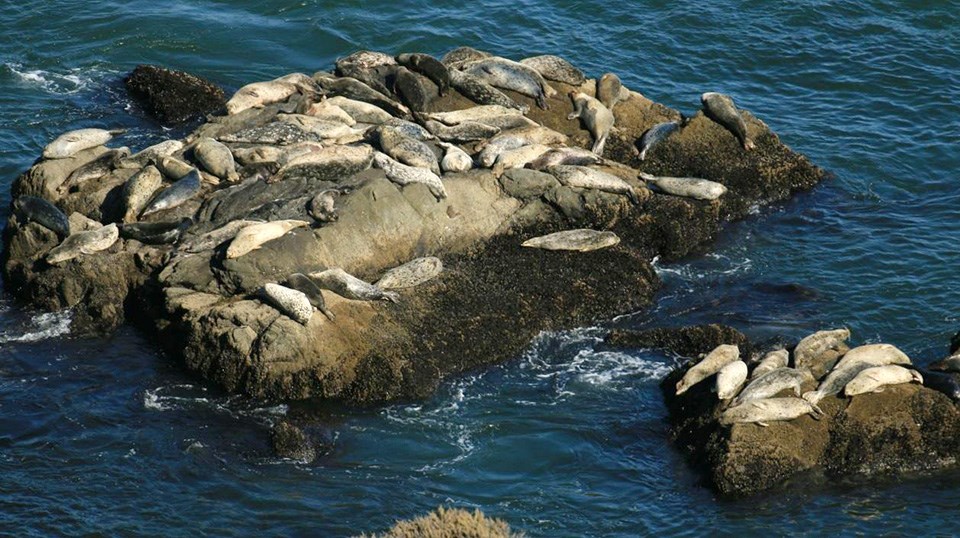
August 6, 2018 - Following the breeding season, harbor seals of all age classes and sexes haul out on a daily basis to molt. The molt process consists of seals shedding their old fur and growing a new layer. Seals need to molt on land to reduce their heat loss and because sunlight stimulates hair follicle growth. It takes an individual seal about three weeks to complete the molting process.
NPS / David Donnenfield
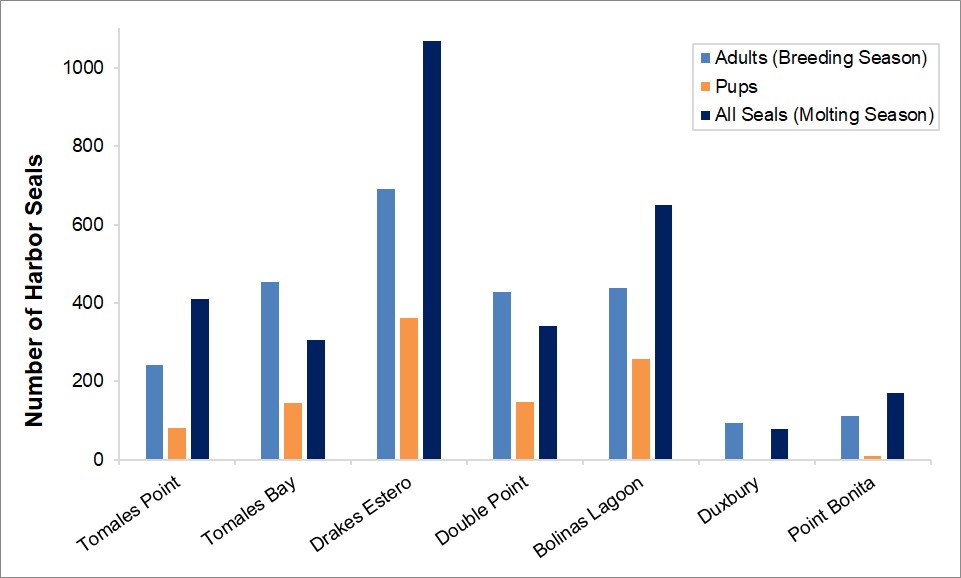
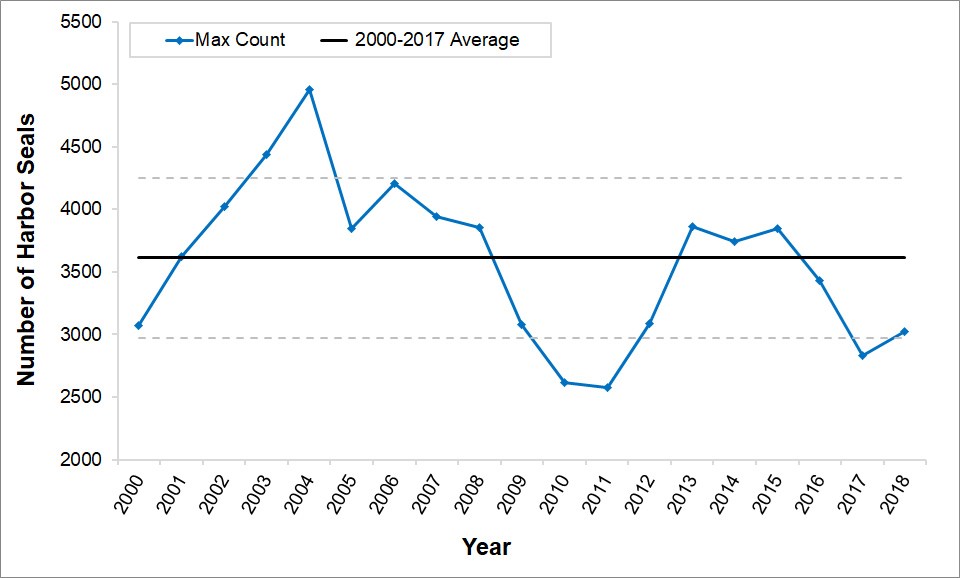
During the 2018 molt season, a total count of 3,022 seals was recorded at Marin County locations. This maximum count is lower than the 18-year average of approximately 3,600 seals and is similar to the low count in 2017 (2,800). The peak counts at each site vary in time, and we recorded site-specific peaks between the end of June and mid-July.
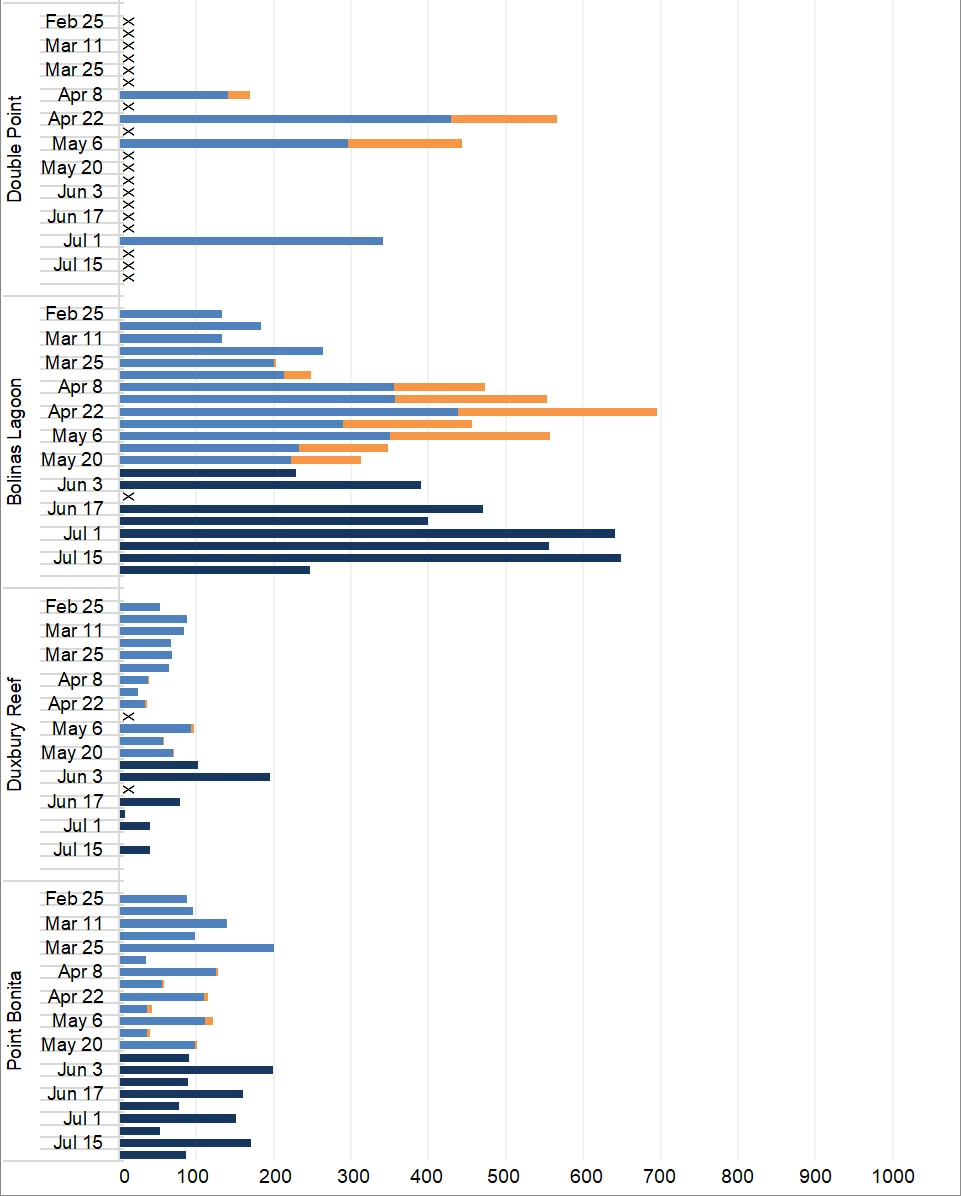
Drakes Estero had the largest number of seals with almost 1,100, followed by Bolinas Lagoon with 650 seals. Bolinas Lagoon has had a large increase in seals since 2014 and has an 18-year average of 500 seals. Double Point, which for many years had been a top site and has an 18-year average of 930 seals, continues the decline that started in 2015 with only 340 seals recorded during the 2018 molt season. The Tomales Bay site was also lower than its average of 400 seals with 300 seals recorded in 2018. During molt season surveys in 2018, there were many disturbances caused by clammers on the mudflats, which may have led to lower counts. The remaining sites, Duxbury Reef, Tomales Point, and Point Bonita, all had average harbor seal counts.
Breeding Season Summary
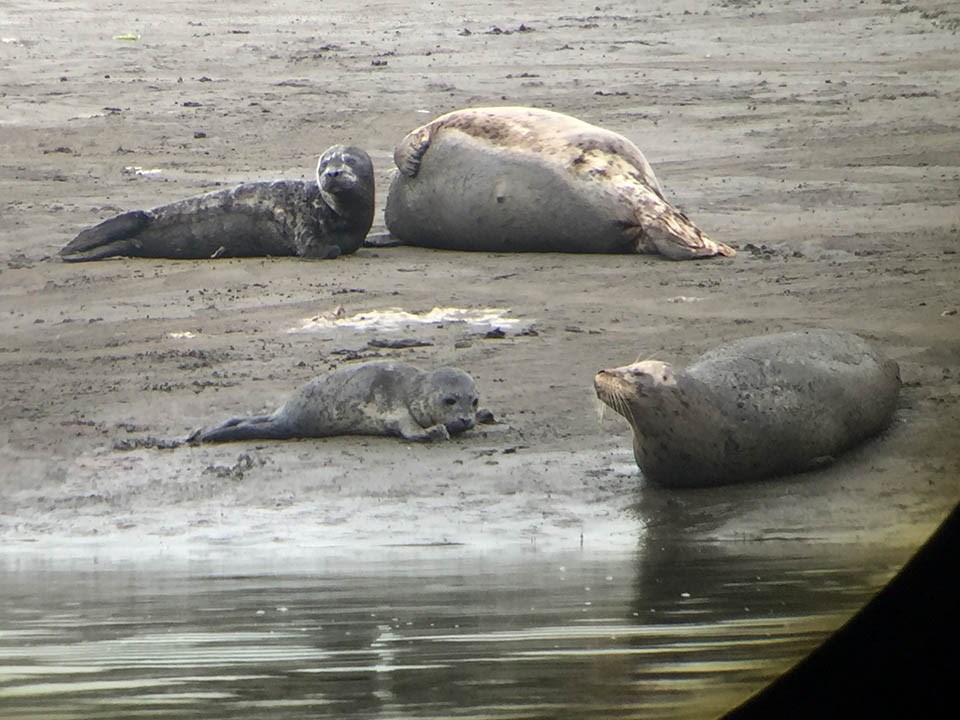
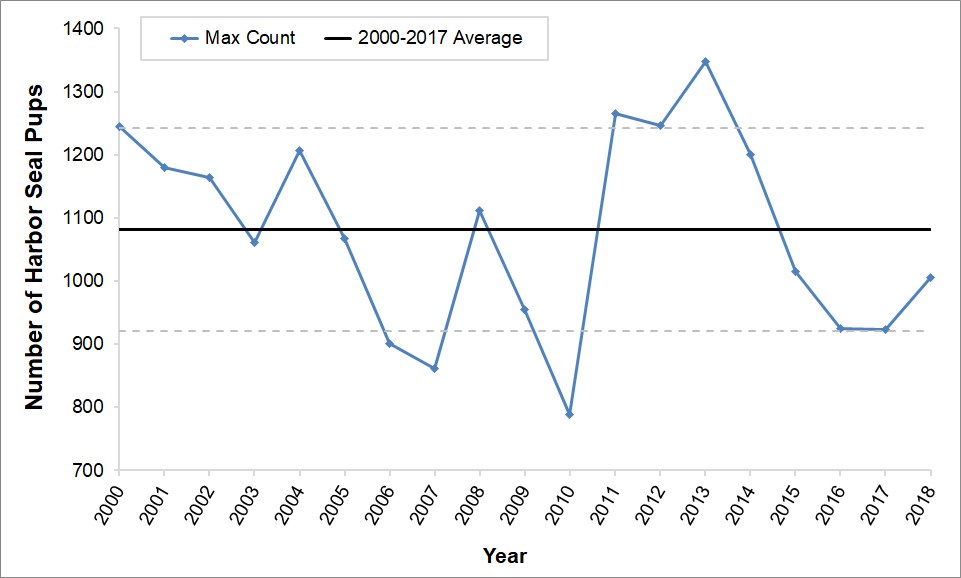
June 7, 2018 - The San Francisco Bay Area Network's Pinniped Monitoring Program recorded the first harbor seal pups of the 2018 breeding season at Drakes Estero and Tomales Bay on March 23rd, which was right on schedule. Pups were seen at all sites by the week of April 8th. The peak of pupping occurred during late April and early May, with a maximum number of approximately 1,000 pups recorded throughout Marin County locations. This peak is similar to the 16-year average of 1,080 pups. Drakes Estero and Bolinas Lagoon were the two top sites with approximately 360 and 260 pups, respectively. Bolinas Lagoon has had increased pup counts over the last six years and is now about 60% greater than its site average.
NPS / Sarah Codde
The number of surveys at Double Point has been reduced due to safety concerns at the observation spot. Surveys are now concentrated during the peak of pupping and, along with last year, we are seeing very low pup numbers at this site. This year’s peak of 150 pups is about 50% less than the site’s average. It is unknown why this site is declining, but could be due to an increase in coyotes and habitat effects from the large storms in 2017.
Preliminary Data
Maximum Harbor Seal Count By Site
Maximum Harbor Seal Pup Counts, 2000-2018
Maximum Harbor Seal Molt Counts, 2000-2018
The Details: Weekly Maximum Harbor Seal Counts By Site

For More Information
Contact
Webpages
San Francisco Bay Area Network - Pinniped Monitoring
Pacific Coast Science and Learning Center - Harbor Seals
The National Park Service shall not be held liable for improper or incorrect use of the data described and/or contained herein. These data and related graphics are not legal documents and are not intended to be used as such. The information contained in these data is dynamic and may change over time. The data are not better than the original sources from which they were derived. It is the responsibility of the data user to use the data appropriately and consistent within the limitations of geospatial data in general and these data in particular. The related graphics are intended to aid the data user in acquiring relevant data; it is not appropriate to use the related graphics as data. The National Park Service gives no warranty, expressed or implied, as to the accuracy, reliability, or completeness of these data. It is strongly recommended that these data are directly acquired from an NPS server and not indirectly through other sources which may have changed the data in some way. Although these data have been processed successfully on computer systems at the National Park Service, no warranty expressed or implied is made regarding the utility of the data on other systems for general or scientific purposes, nor shall the act of distribution constitute any such warranty. This disclaimer applies both to individual use of the data and aggregate use with other data. The National Park Service requests that the data user refrain from publishing these data and related graphics and wait until data is available in official, published reports.
