Last updated: January 11, 2024
Article
Shifting Gears: Leveraging Monitoring Data to Move from Weather to Ecological Forecasts
- David Thoma, Ecologist, Northern Colorado Plateau Network and Greater Yellowstone Network, National Park Service
- Andy Ray, Program Manager, Southern Plains Network, National Park Service
- Mike Tercek, Ecologist, Walking Shadow Ecology
- Alice Wondrak Biel, Public Affairs Specialist, Inventory & Monitoring Division, National Park Service
- John Gross, Ecologist, Climate Change Response Program, National Park Service
- Tom Olliff, Program Manager, Collaborative Conservation and Climate Change, National Park Service
- Dave Lawrence, Climate Change Ecologist, Climate Change Response Program, National Park Service
- Ann Rodman, Physical Scientist, Yellowstone National Park, National Park Service
- Amber Runyon, Climate Change Ecologist, Climate Change Response Program, National Park Service
- Kirk Sherrill, Data Manager, Rocky Mountain Network, National Park Service
- E. William Schweiger, Ecologist, Rocky Mountain Network, National Park Service
- Carolyn Livensperger, Ecologist, Northern Colorado Plateau Network, National Park Service
- Morgan Wehtje, Biologist, Capitol Reef National Park, National Park Service
- Jim Roche, District Ranger, Routt National Forest, formerly Integrated Resource and Science Manager, Capitol Reef National Park, National Park Service
- Joseph Ceradini, Ecologist, Capitol Reef National Park, National Park Service
Abstract
Drought duration and intensity in southwestern parks is severe and the threat is projected to worsen this century. This will place enormous strain on park ecosystems and managers. Because the past is no longer a good indication of the future, we must find new methods to help managers shift gears from reactive management to proactive mitigation of climate change impacts. Here we make a case for ecological forecasting based on lessons from long-term monitoring. This involves combined analysis of climate data with vital-signs responses to determine climate sensitivities. This analysis can be used to deliver ecological forecasts on Climateanalyzer.org and provide insights for long-range scenario planning. We demonstrate a few examples here but need managers’ help to refine and build new forecasting tools that meet park needs.

NPS/Joseph Ceradini
The Legacy and Promise of Monitoring
Mandated by Congress in 1998, the National Park Service (NPS) Inventory & Monitoring Division (IMD) conducts long-term monitoring of selected park “vital signs”—key physical, biological and ecological processes that indicate broader ecological health. In short, IMD’s primary task is to determine a scientifically sound understanding of baseline conditions of natural resources in national parks, and to track change in those conditions over time. Monitoring makes that possible by looking back at data collected in the past (Fancy et al. 2009). Backward-looking approaches make sense in a steady-state equilibrium where resource conditions fluctuate around a normal condition. But climate change puts resources on a collision course with continuous change with no expectation for a return to normal. In the U.S. Southwest, increasing temperature comes with increasing aridity. Adapting to this new “abnormal” or continuous change away from any sort of baseline will place stress on park ecosystems, ecological function, and managers dealing with these changes.
Monitoring has been used historically to inform management and instill confidence in decisions by providing early warning when undesirable conditions or trends were identified. Monitoring has also been used to evaluate treatments, restoration actions, and recovery after disturbances. For example, the Northern Colorado Plateau Network (NCPN) monitoring has identified water quality recovery after wildfire in Zion (Weissinger and Sharrow 2018) and changes in vegetation cover in semiarid grasslands after cessation of grazing at Capitol Reef (Witwicki 2020). However, our traditional approach to monitoring and reporting has shortcomings in times of rapid ecological change.
Like weather forecasts, ecological forecasts provide a way to anticipate and prepare for future conditions in ecosystem vital signs. Many organisms monitored by IMD (e.g., plants, amphibians) are very sensitive to temperature and other aspects of weather. Understanding their sensitivity to weather makes it possible to forecast their response to changing weather and future climate. Here we demonstrate how monitoring data can be transformed into forecasts of vital-signs condition. This kind of information may help park managers shift gears from reactive management to proactive mitigation. This transition is needed as climate change impacts ecological systems as well as infrastructure and cultural resources in national parks (Bradford et al. 2018).
For decades, we’ve relied on weather-station data to tell us about the severity of drought. For instance, just about every Intermountain Region NPS unit has meteorological equipment that measures temperature and precipitation located near a visitor center. Heading out to record the measurements is a daily ritual for park staff dedicated to maintaining the area’s long-term weather record. These data are used to monitor deviation from normal conditions, which helps us speculate on impacts weather has on plants, animals, and stream flow. In conjunction with weather data, people with long experience in a place also develop a sense of weather and resource relationships that are confirmed and refined over time. They also live through dramatic change like broad-scale juniper mortality, for example, and recall what the landscape looked like before. But this type of place-based knowledge is becoming increasingly scarce as employees retire and move around the NPS. As new employees come to know a place, their baseline condition is informed by their experiences. For example, a drought that killed juniper trees in southwestern parks in 2003 was not widely remembered by some park staff in 2019, when widespread juniper mortality in southwestern Utah from another drought caught many by surprise (Davis et al. 2022).
The loss of institutional memory and the problem of shifting baselines can be partially offset by the “slow-lane process” of long-term monitoring. IMD programs typically take years to detect and report trends in vital-signs condition because of the time required to collect multiple years of data, analyze them, and report findings. This makes IMD studies good for detecting chronic change that would go unnoticed otherwise. And they are good at preventing the human tendency toward shifting baselines as people come to associate “normal” conditions with their lived experience in a place. Although we have reduced the time from field observation to reporting substantially for vital signs like water quality, breeding birds, and others, it still begs a question: How likely are we to be caught off-guard again by a creeping drought—or flash drought—as institutional knowledge dissipates? Knowing how vital signs are likely to respond to evolving weather conditions is a real-time need that requires a new approach.
Making the Most of Monitoring
Climate change and the intensification of drought are happening faster, and with more devastating consequences, than scientists anticipated (Seager et al. 2007). IMD ecologists have documented dramatic response of vital signs to wet years and dry years. In southern Utah parks, the 2003 drought was followed by record vegetation growth in 2005. Similarly, when more amphibians breed in a wet year and fewer in a dry year, it suggests a strong link to weather (Ray et al. 2016, Zylstra et al. 2019). After a decade of tracking obvious changes like these—and the more common but subtle changes in vital signs conditions—during normal years, strong relationships emerge when we crunch the numbers. That’s not necessarily surprising given vital signs’ sensitivity to temperature and, often, water availability. But the more we look for climate sensitivities, the more we find.
From Trend Over Time to Trend Over Climate
By reimagining how we use vital signs monitoring data, we can couple resource response with weather to build quantitative relationships that will help us avoid surprises in the future. This represents a subtle but important move from “trend over time” to “trend over climate.” This change in thinking paves the way to using readily available weather data and forecasts to build near-term forecasts of resource condition. This is powerful, as it allows us to move from asking Does X affect Y? to How much does X affect Y? (Dietze et al. 2018). Answering this question helps us understand the ecological implications of each degree of warming, or of incremental decreases in summer soil moisture. Although we would not be able to forecast without knowing how these relationships changed in the past, forecasting tools become more valuable as climate change makes the past a poor indication of the future. In the Southwest, persistent drought is a theme on everyone’s mind. It is already bad, but what happens if/when it gets worse? In some cases, we already have the tools that tell us what might change—and where and when we should expect it first.

NPS/Joseph Ceradini
Case Study: Capitol Reef National Park
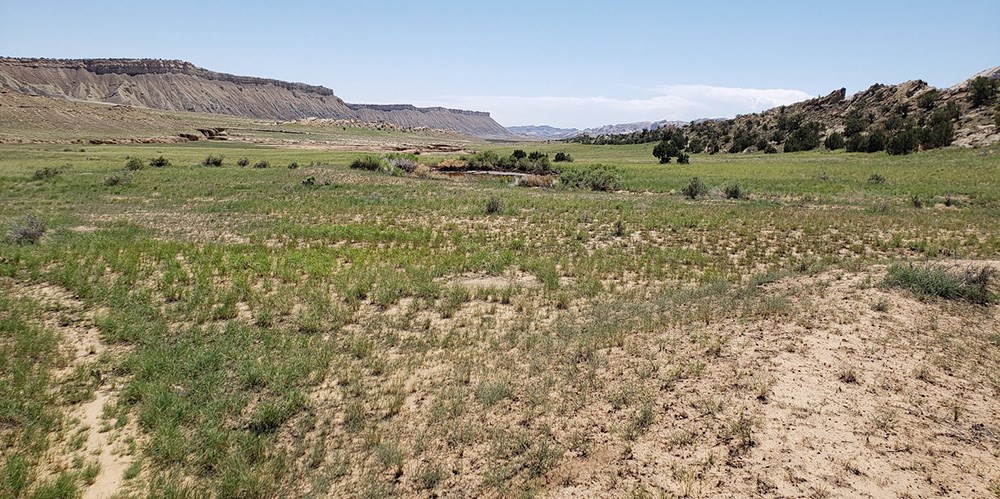
In semiarid regions like Capitol Reef National Park, water is a growth-limiting resource for vegetation. Vegetation responds strongly to years of high or low precipitation, suggesting we should find strong statistical relationships between precipitation and vegetation growth. However, the relationship between precipitation and vegetation growth is typically weak. Furthermore, there was no evidence of a trend in 20 years of satellite measurements of vegetation condition between 2000 and 2019 (Figure 1a), but during the same period there was a strong relationship between vegetation condition and climate measured as soil moisture (Figure 1b). To determine what this could tell us about future conditions, ecologists from the Northern Colorado Plateau Inventory & Monitoring Network used a model to estimate the critical water need of vegetation (Thoma et al. 2016; Figure 1c). The model indicated that at this location, the amount of soil moisture needed to maintain average vegetation production is 47 mm (+/- 4 mm). This means that when annual average soil moisture is more than 51 mm, vegetation production will likely be above average. If it is less than 43 mm, we can expect below-average production.

Sensitivity of production to soil moisture is the slope of the regression line, which tells us how much vegetation production is likely to change per millimeter of change in soil moisture.
Moving from trend over time to trend over climate uses monitoring data in a new way that provides new information. In this example, we confirmed that vegetation responds to soil moisture, identified the critical soil-moisture need, and determined how much change in vegetation condition managers can expect with changes in soil moisture: three new pieces of highly useful information about the ecology of this allotment.
Now that we know the critical water need for this location, we can use climate projections to determine if and when future climate scenarios will provide enough water to sustain current vegetation in the allotment. Information like this is a useful starting point for considering climate impacts and management options because it tells us what, when, where, and why change might happen. It can be used in scenario planning to help refine management goals and to identify management options that can help achieve those goals in the resist-accept-direct framework (Schuurman et al. 2020).

NPS/Jacob Frank
Interpreting Climate in Ways that Matter
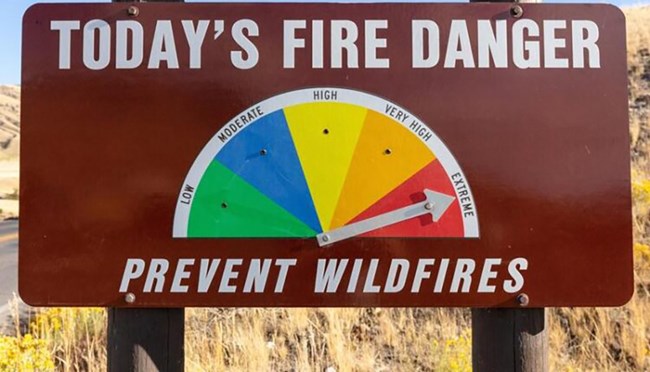
Relationships between biology and climate are complex and multi-dimensional. For example, amphibian breeding is most strongly related to runoff, whereas plant growth is most strongly related to soil moisture. For this reason, we need a way to translate traditional climate measures (i.e., temperature and precipitation) into more meaningful variables that better represent the conditions plants and animals experience. We do this with a water balance model. Climate variables from this model, such as soil moisture and runoff, have led to stronger statistical relationships between vital signs’ responses and weather. This matters because stronger relationships mean we have a more specific understanding of how climate conditions influence vital signs condition. We have found these relationships to be highly nuanced and location-specific (Thoma et al. 2019, Witwicki et al. 2016, Brice et al. 2022). Understanding this nuance helps us move from obvious conclusions (rain and snow cause runoff) to species or community-level interpretations about biological responses to weather. These ecological translations of weather and climate-driven change means our results are place based, species specific, and forecastable. Ecological forecasts for shrublands, wetlands, and springs are now possible, much like the fire-hazard forecasts at entry points to public lands (Figure 2).
Bringing Ecological Forecasts to Life
To bring these relationships to life, IMD uses the Climate Analyzer (climateanalyzer.org). In addition to providing historical and current climate information, the Climate Analyzer provides ecological nowcasts and forecasts. The site reports fire danger for Yellowstone National Park, and forecasts stream flow for Great Sand Dunes National Park. Vegetation condition assessments based on recent weather at Capitol Reef National Park are routinely emailed to those who request it.
Collectively, IMD’s long-term monitoring and Climate Analyzer’s capabilities comprise a forecast system that is place based, tailored to resources, and derived from local climate-response relationships. Although we will always need expert interpretation and ground truthing, this integrated system has the potential to provide valuable insight for decision makers. Born from long-term monitoring, ecological forecasting reduces the guesswork for resource condition assessments, provides early warning for proactive mitigation, and results in cost savings when mitigations prevent worse outcomes. These forecasts are not perfect but are robust and useful right now. They can improve with the benefit of user feedback (Dietze et al. 2018) and, with ongoing monitoring, we can assess accuracy and make them more useful in more places.
Managing Under Uncertainty
Climate impacts and their consequences are increasing. The NPS uses scenario planning to identify potential management actions when we don’t know exactly when climate change impacts will arrive, or what form they will take (e.g., flood or fire). While waiting for more or “better” information can delay action, scenario planning allows managers to work with uncertainty and prepare for a wide range of potential changes before they occur. If climate-related disruption can be anticipated using the tools described here, then early management action may mitigate harm.
Meeting the Future Together
The justification for investing in ecological forecasts is straightforward. After drought or fire, managers are left with few options and may be forced to invest in multi-year projects that implement expensive remediation and restoration actions. In many cases, proactive mitigation can simultaneously help avoid disaster and lower restoration costs, resulting in faster recovery to new desirable conditions.
In the last two decades, drought has surprised some of us twice. However, IMD is using two decades of long-term monitoring and climate data to build ecological forecast models and alert systems that learn from the past. Working with Climate Analyzer, we can deliver ecological forecasts in real time, and use the same ecological models to help inform long-range planning. Now we need park managers’ help to refine and interpret existing ecological forecasts and build new ones. Your ideas and involvement are critical to meeting more information needs in a timely manner. Ask for it by taking your ideas to IMD staff and other collaborators, and working with them to build ecological models that meet your needs. Talk to us about incorporating forecasts into the Climate Analyzer. Forward thinking, time and energy invested now, will put us in a better position to anticipate and deal with the climate impacts that lie ahead.
References
Bradford, J. B., J. L. Betancourt, B. J. Butterfield, S. M. Munson, and T. E. Wood. 2018.
Anticipatory natural resource science and management for a changing future. Frontiers in Ecology and the Environment 16(5): 295-303.
Brice, E. M., M. Halabisky, and A. M Ray. 2022.
Making the leap from ponds to landscapes : Integrating field-based monitoring of amphibians and wetlands with satellite observations. Ecological Indicators 135(January): 1-15.
Davis, R. S., M. Newcomb, and D. Ott. 2022.
Forest Health Protection Southeast Utah Juniper Dieback – 2021: Follow-up Measurements of Survey Plots. FHP Trip Report OFO-TR-21-18. USDA Forest Service Intermountain Region, Ogden, UT: U.S.
Dietze, M. C., A. Fox, L. M. Beck-Johnson, J. L. Betancourt, M. B. Hooten, C. S. Jarnevich, T. H. Keitt, et al. 2018.
Iterative near-term ecological forecasting: Needs, opportunities, and challenges. Proceedings of the National Academy of Sciences of the United States of America 115(7): 1424-32.
Fancy, S. G., J. E. Gross, and S. L. Carter. 2009.
Monitoring the condition of natural resources in U.S. national parks. Environmental Monitoring and Assessment 151(1-4): 161-74.
Ray, A. M., W. R. Gould, B. R. Hossack, A. J. Sepulveda, D. P. Thoma, D. A. Patla, R. Daley, and R. Al-Chokhachy. 2016.
Influence of climate drivers on colonization and extinction dynamics of wetland-dependent species. Ecosphere 7(7): 1-21.
Schuurman, G. W., C. Hawkins Hoffman, D. N. Cole, D. J. Lawrence, J. M. Morton, D. R. Magness, A. E. Cravens, S. Covington, R. O’Malley, and N. A. Fisichelli. 2020.
Resist-Accept-Direct (RAD ): A framework for the 21st-century natural resource manager. Natural Resource Report NPS/NRSS/CCRP/NRR—2020/ 2213. National Park Service, Fort Collins, Colorado.
Seager, R., M. Ting, I. Held, Y. Kushnir, J. Lu, G. Vecchi, H. Huang, et al. 2007.
Model projections of an imminent transition to a more arid climate in Southwestern North America. Science 316(5828): 1181-84.
Thoma, D. P., S. M. Munson, and D. L. Witwicki. 2019.
Landscape pivot points and responses to water balance in national parks of the Southwest U.S. Journal of Applied Ecology 56(1): 157-67.
Thoma, D. P., S. M. Munson, K. M. Irvine, D. L. Witwicki, E. L. Bunting, and J. Paruelo. 2016.
Semi-arid vegetation response to antecedent climate and water balance windows. Applied Vegetation Science 19(3): 413-29.
Weissinger, R., and D. Sharrow. 2018.
Status and trends of water quality at Zion National Park. Vol. 2016. Natural Resource Report NPS/NCPN/NRR— 2018/1670. National Park Service, Fort Collins, Colorado.
Witwicki, D. L. 2020.
Status and trends in upland vegetation and soils at Capitol Reef National Park, 2009-2018. Vol. 2018. Natural Resource Report NPS/NCPN/ NRR—2020/2183. National Park Service, Fort Collins, Colorado.
Witwicki, D. L, S. M. Munson, and D. P. Thoma. 2016.
Effects of climate and water balance across grasslands of varying C3 and C4 grass cover. Ecosphere 7(11): 1-19.
Zylstra, E. R., D. E. Swann, B. R. Hossack, E. Muths, and R. J. Steidl. 2019.
Drought-mediated extinction of an arid-land amphibian: Insights from a spatially explicit dynamic occupancy model. Ecological Applications 29(3): 1-15.
