Last updated: September 11, 2025
Article
2025 Harbor Seal Monitoring Updates
By Marine Ecologist Sarah Codde, San Francisco Bay Area Inventory & Monitoring Network
Breeding Season Summary
NPS / Dan Russell
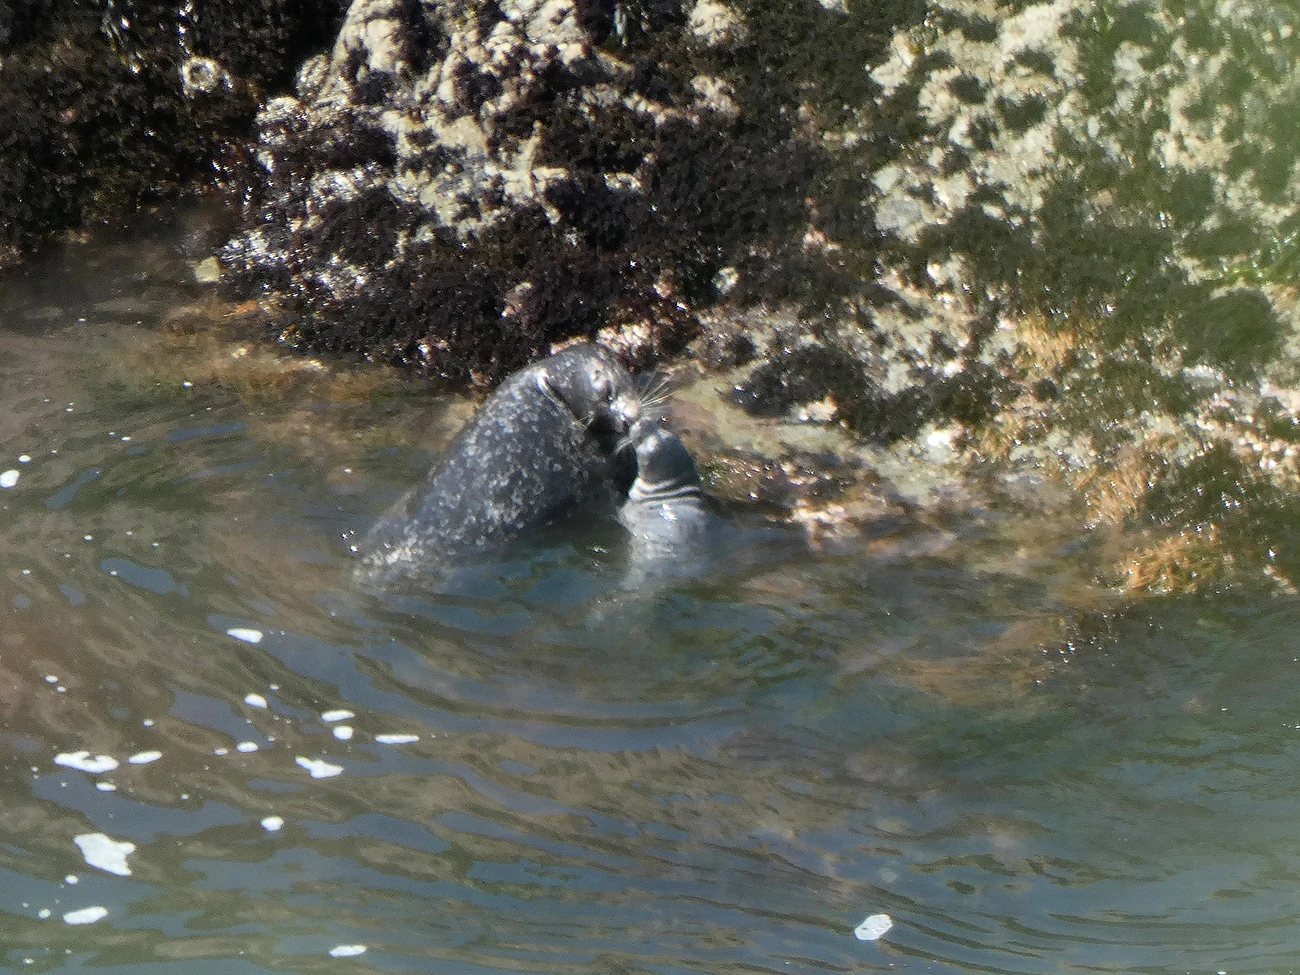
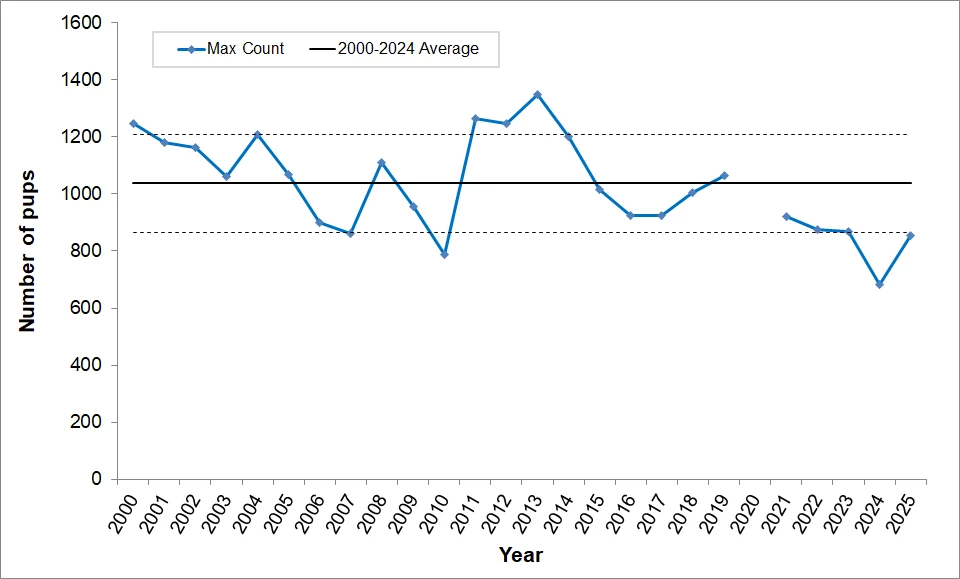
Every spring, harbor seals gather in large groups throughout Marin County, CA, for the breeding season. During this time, a female harbor seal gives birth to a single pup. We see the highest number of pups around the end of April. In 2025, we counted approximately 853 pups at sites in Point Reyes National Seashore and Golden Gate National Recreation Area. This count is below the long-term average, but higher than in 2024, which was the lowest count on record during the 26-year monitoring period. This year's count is similar to counts recorded from 2021 through 2023. These were all lower than average, but within one standard deviation of the mean, which can represent natural variation in the counts.
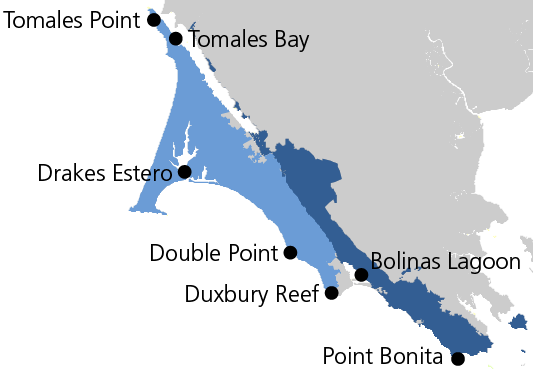
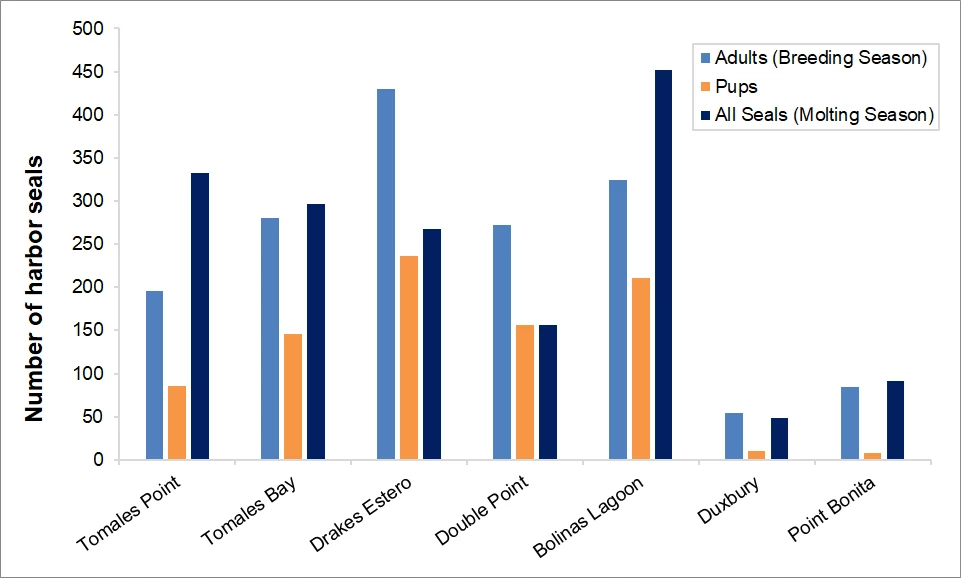
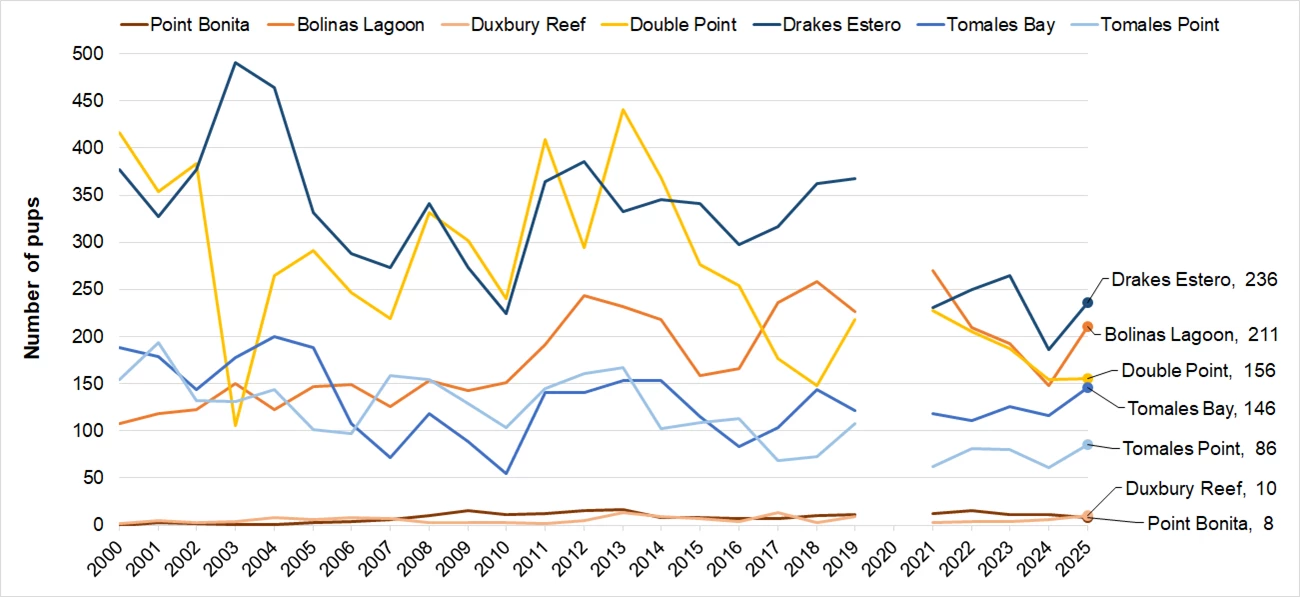
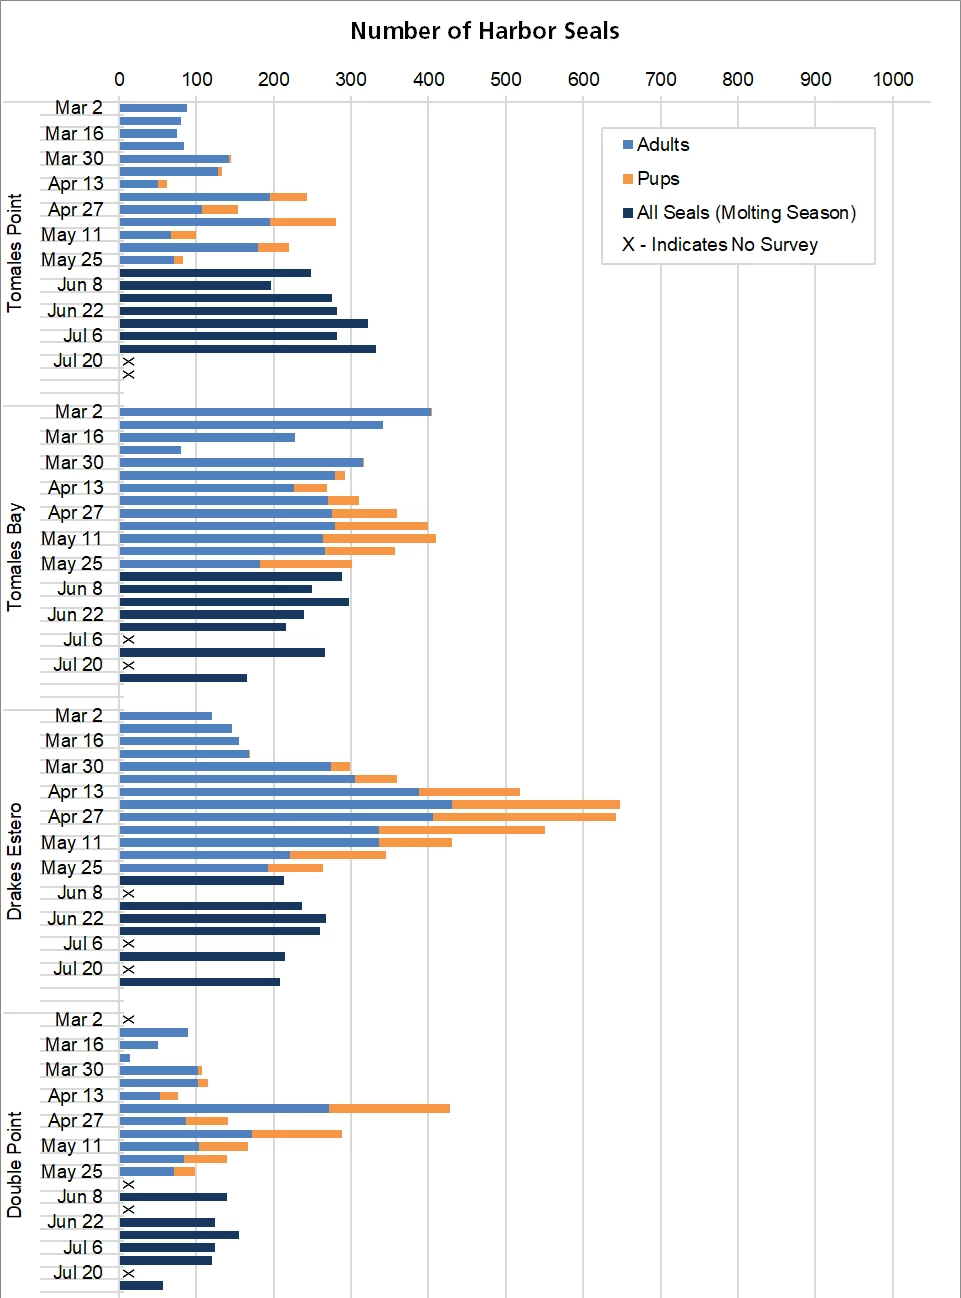
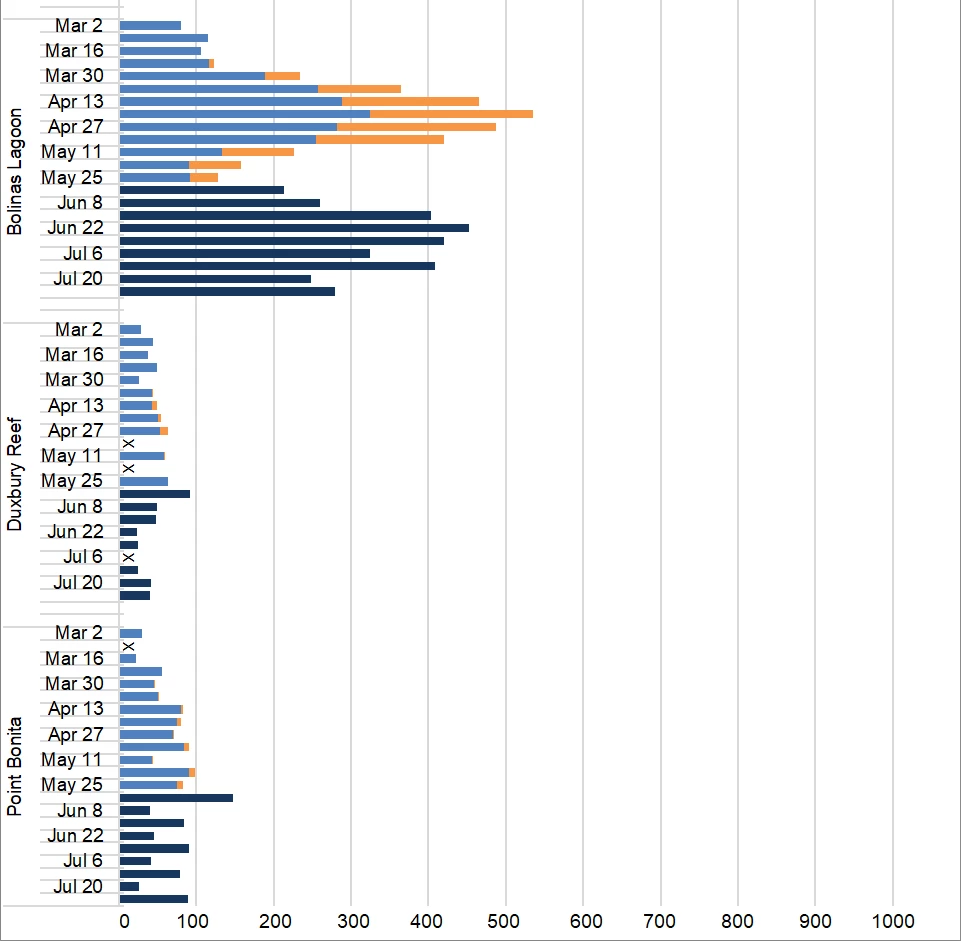
Double Point, Drakes Estero, and Tomales Point all had pup counts that were below their respective long-term averages, while Bolinas Lagoon and Duxbury Reef had counts that were above average. The remaining sites, Tomales Bay and Point Bonita, had counts that were similar to their respective long-term averages. We continue to see the ongoing presence of coyotes at Drakes Estero and Double Point, which is possibly leading to the large decline at those sites. While Drakes Estero has experienced a decline in the number of pups born at that site in recent years, it is still the largest site in Marin County with approximately 236 pups recorded this year. Bolinas Lagoon is a close second with about 211 pups recorded this year.
Molt Season Summary
NPS / Sarah Codde
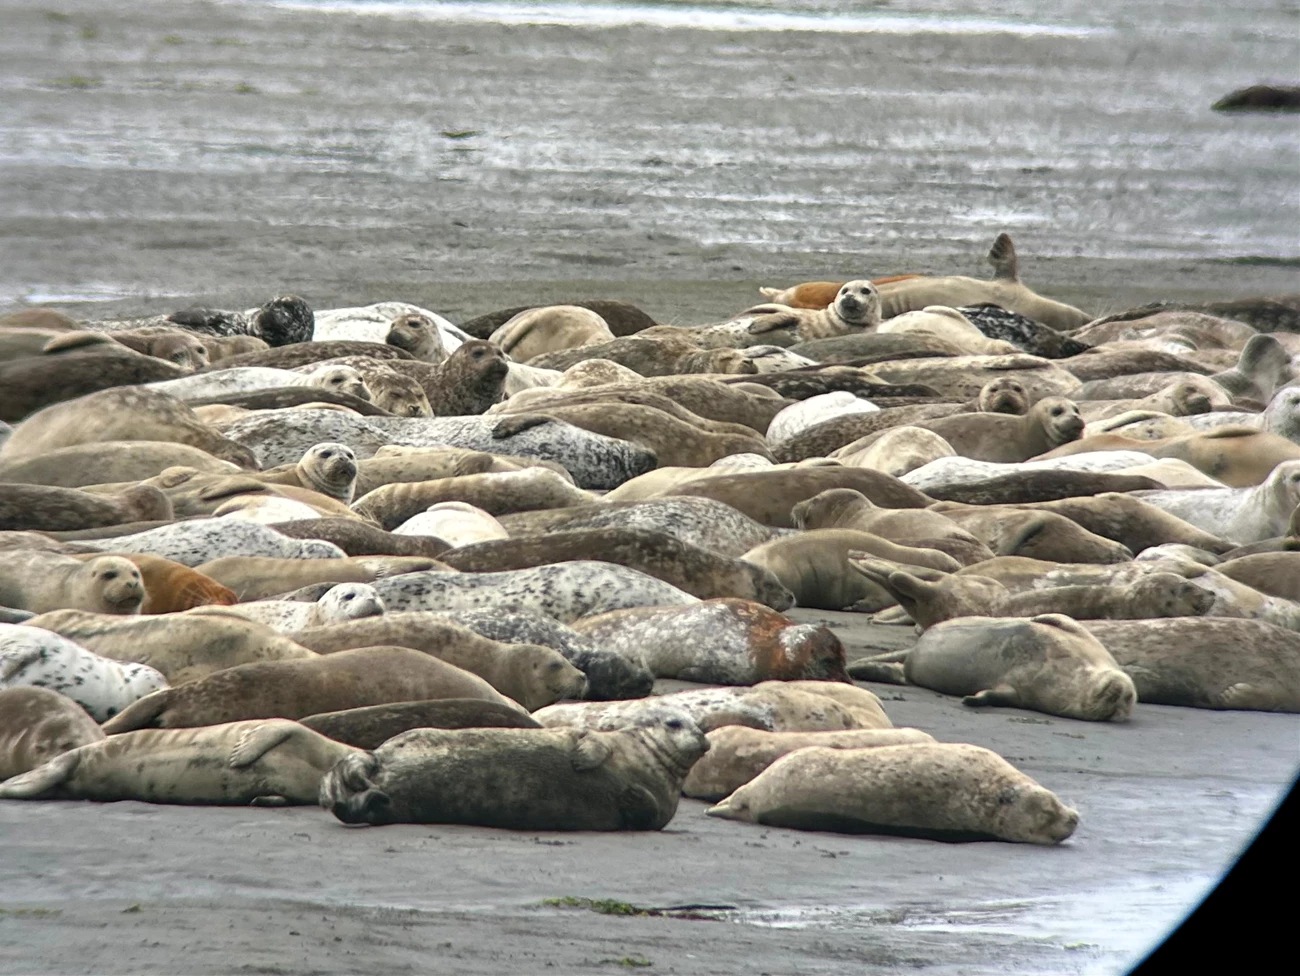
The harbor seal monitoring surveys conducted during the summer months allow us to get a good estimate of the entire population of harbor seals in Marin County national parks. It’s the one time when all age classes are hauling out of the water for extended periods of time. Except for this year’s pups, they’re all hauling out to molt (shed) their fur. Pups will molt for the first time the year after they’re born.
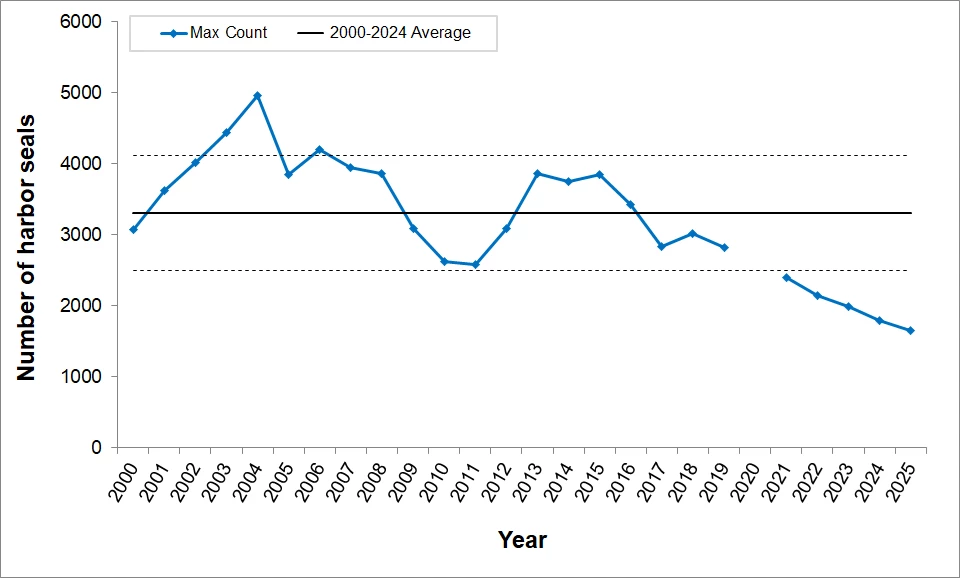
We have recorded a decline in molt counts since at least 2021. The decline continued in 2025 with the lowest count on record during 26 years of monitoring. This year's molt season total count was 1,645 seals, which is about 50% less than the long-term average (3,300 seals).
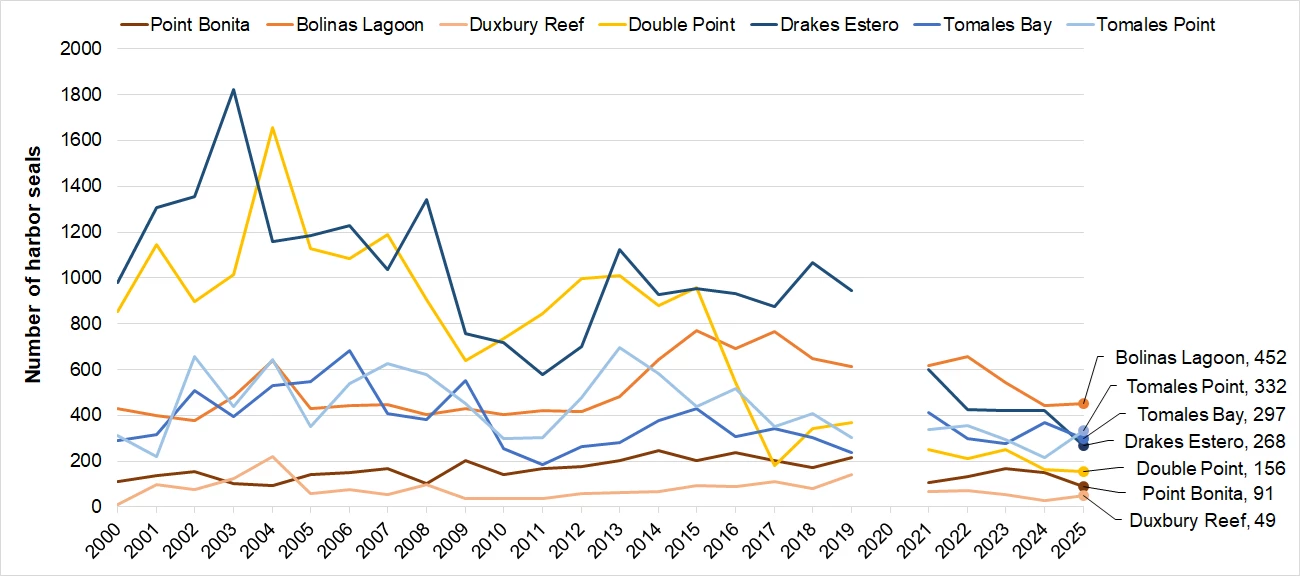
Bolinas Lagoon had the highest count of all Marin County sites in 2025 with a maximum count of 452 seals, followed by Tomales Point with 332 seals. All sites monitored had maximum molt season counts that were below their respective long-term averages. Drakes Estero and Double Point experienced the largest declines.
At Double Point, we counted a maximum of 156 seals this year, which is about 80% below the site's long-term average of 760 seals. At Drakes Estero, our maximum count was 268, which is about 72% below the site's long-term average of 956 seals. Both sites, plus Point Bonita in the Marin Headlands, had the lowest counts on record for their respective sites.
Like last year, we’re still unsure of why we’re seeing this continuing decline.
Celebrating Volunteers, and 30 Years!
This year marks the 30th anniversary of the Harbor Seal Monitoring Program! The program was started by Dr. Sarah Allen with a small group of volunteers surveying Drakes Estero, Double Point, and Bolinas Lagoon. Volunteers are still the program’s backbone. It wouldn’t have been possible to continue for this long without their dedication and passion.
A big thank you to the 24 volunteers that put in a lot of time and effort to help National Park Service and Marin County Parks staff survey harbor seals in 2025. Together, we completed 241 harbor seal surveys at seven sites in Point Reyes National Seashore and Golden Gate National Recreation Area. Here's to many more years tracking the population changes of harbor seals in Marin County national parks!
Preliminary Data
2025 Maximum Harbor Seal Count By Site
Maximum Harbor Seal Pup Counts, 2000-2025
Maximum Harbor Seal Pup Counts by Site, 2000-2025
Maximum Harbor Seal Molt Counts, 2000-2025
Maximum Harbor Seal Molt Counts by Site, 2000-2025
The Details: 2025 Weekly Maximum Breeding Season Harbor Seal Counts By Site
For More Information

Webpages
San Francisco Bay Area Network - Pinniped Monitoring
Pacific Coast Science and Learning Center - Harbor Seals
Data
Pinniped Monitoring for the San Francisco Bay Area Network: 1983-2024 - Data Package
Contact
The National Park Service shall not be held liable for improper or incorrect use of the data described and/or contained herein. These data and related graphics are not legal documents and are not intended to be used as such. The information contained in these data is dynamic and may change over time. The data are not better than the original sources from which they were derived. It is the responsibility of the data user to use the data appropriately and consistent within the limitations of geospatial data in general and these data in particular. The related graphics are intended to aid the data user in acquiring relevant data; it is not appropriate to use the related graphics as data. The National Park Service gives no warranty, expressed or implied, as to the accuracy, reliability, or completeness of these data. It is strongly recommended that these data are directly acquired from an NPS server and not indirectly through other sources which may have changed the data in some way. Although these data have been processed successfully on computer systems at the National Park Service, no warranty expressed or implied is made regarding the utility of the data on other systems for general or scientific purposes, nor shall the act of distribution constitute any such warranty. This disclaimer applies both to individual use of the data and aggregate use with other data. The National Park Service requests that the data user refrain from publishing these data and related graphics and wait until data is available in official, published reports.
Tags
- golden gate national recreation area
- point reyes national seashore
- sfan
- blog
- seasonal update
- marine mammals
- pinnipeds
- harbor seals
- breeding season
- molting
- monitoring
- san francisco bay area
- marin county
- drakes estero
- bolinas lagoon
- tomales point
- tomales bay
- duxbury reef
- double point
- point bonita
- sarah codde
