Last updated: April 30, 2025
Article
Climate and Water Monitoring at Saguaro National Park: Water Year 2022
NPS
Overview
Together, climate and hydrology shape ecosystems and the services they provide, particularly in arid and semi-arid ecosystems. Understanding changes in climate, groundwater, and surface water is key to assessing the condition of park natural resources—and often, cultural resources.
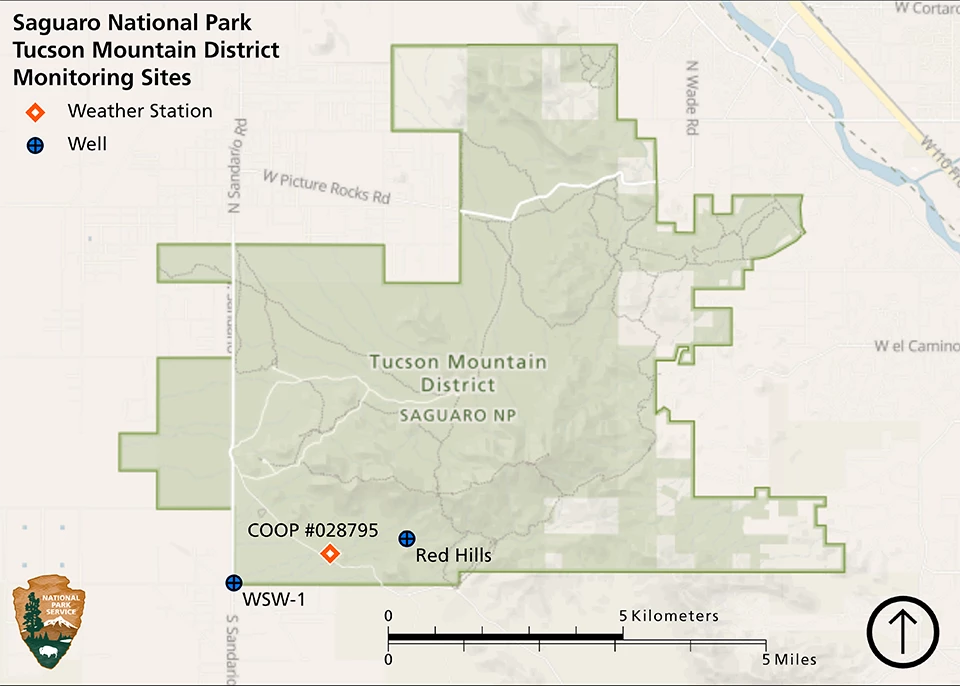
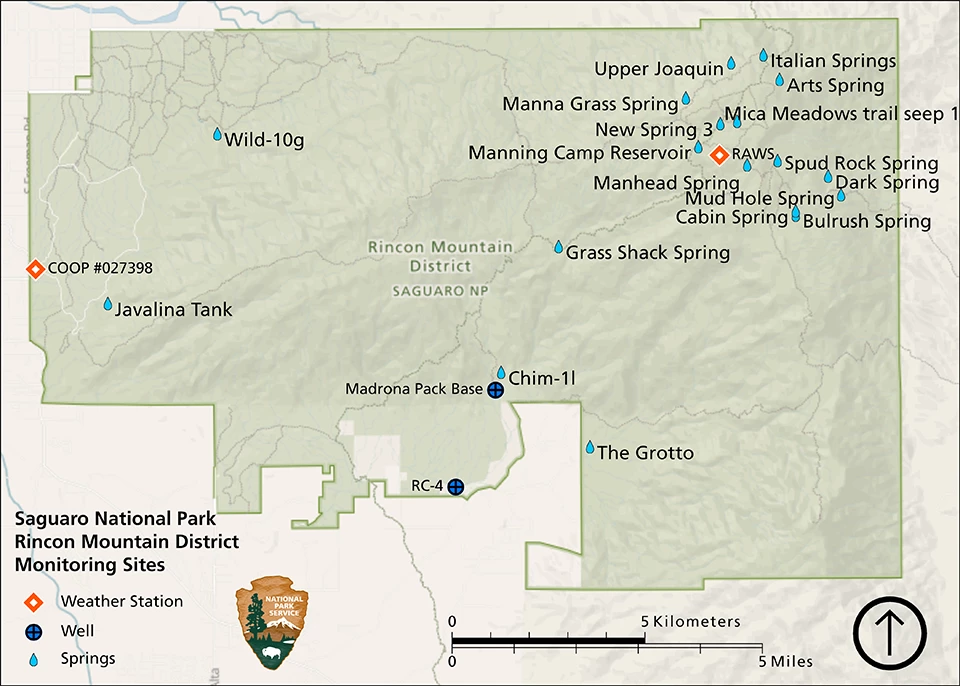
At Saguaro National Park (Figure 1 and Figure 2), Sonoran Desert Network scientists study how ecosystems may be changing by taking measurements of key resources, or “vital signs,” year after year—much as a doctor keeps track of a patient’s vital signs. This long-term ecological monitoring provides early warning of potential problems, allowing managers to mitigate them before they become worse. At Saguaro National Park, we monitor climate, groundwater, and springs, among other vital signs.
Surface-water and groundwater conditions are closely related to climate conditions. Because they are better understood together, we report on climate in conjunction with water resources. Reporting is by water year (WY), which begins in October of the previous calendar year and goes through September of the water year (e.g., WY2022 runs from October 2021 through September 2022).
This article reports the results of climate and water monitoring at the Tucson Mountain District (Figure 1) and Rincon Mountain District (Figure 2) of Saguaro National Park in WY2022.
NPS
NPS
NPS
Climate and Weather
There is often confusion over the terms “weather” and “climate.” In short, weather describes instantaneous meteorological conditions (e.g., it’s currently raining or snowing, it’s a hot or frigid day). Climate reflects patterns of weather at a given place over longer periods of time (seasons to years). Climate is the primary driver of ecological processes on earth. Climate and weather information provide context for understanding the status or condition of other park resources.
We report on three weather stations at Saguaro National Park (Figure 1). Tucson 17 NW (SAGW) (ID# 028795), a National Oceanic and Atmospheric Administration (NOAA) Cooperative Observer Program (COOP) station near the Tucson Mountain district Visitor Center, has been operational since 1982. Saguaro National Park AZ (ID# 027398), a NOAA COOP station near the Rincon Mountain District Visitor Center, has been operational since 2009 (the long-term averages used for comparison in this report are from NOAA and are based on the period of record at this station, 2009–2020). Mica Mountain AZ (ID# QHVA3), a Remote Automated Weather Station (RAWS) station in the Rincon Mountain District at an elevation of 8,209 feet (2,502 m), has been operational since 1994. These stations typically provide reliable climate datasets used for analyses in this climate and water report. However, in WY2022 the Tucson 17 NW (SAGW) COOP station was missing data on 45 days. As a substitute, climate analyses for the Tucson Mountain District in this year’s report use 30-year averages (1991–2020) and gridded surface meteorological (GRIDMET) data from the location of the station. Subsequent reports may revert to the weather stations as the data source, depending on future data quality.
GRIDMET is a spatial climate dataset at a 4-kilometer resolution that is interpolated using weather-station data, topography, and other observational and modeled land-surface data. Temperature and precipitation estimated from GRIDMET may vary from actual weather at a particular location, depending on the availability of weather station data and the difference in elevation between the location and that assigned to a grid cell. Data from both weather station(s) and GRIDMET are accessible through Climate Analyzer.
Water Year 2022 Precipitation Results
Tucson Mountain District Visitor Center (GRIDMET)
Annual precipitation in WY2022 at the Tucson Mountain District visitor center in Saguaro National Park was 10.44″ (26.5 cm; Figure 3), which was 1.56″ (4.0 cm) less than the 1991–2020 annual average. This deficit primarily occurred from October through May when monthly precipitation totals were ≤ 64% of the 1991–2020 monthly averages, except in December, which received nearly twice the average rainfall. Monsoon rains (June–September) were near or slightly above average.
Rincon Mountain District Visitor Center (COOP)
Annual precipitation in WY2022 at the Rincon Mountain District visitor center in Saguaro National Park was 13.35″ (33.9 cm; Figure 4), which was 0.67″ (1.7 cm) less than the 2010–2020 annual average. Combined precipitation in July and August was 8.56″ (27.7 cm) and accounted for nearly two-thirds of the annual rainfall. Extreme daily rainfall events (≥ 1″; 2.54 cm) occurred on 3 days, twice the 2010–2020 annual frequency of 1.6 days. Extreme rainfall events occurred on 24 July 2022 (1.37″; 3.5 cm), 01 August 2022 (2.15″; 5.5 cm), and 09 August 2022 (1.12″; 2.8 cm).
Rincon Mountain District High Elevation (RAWS)
Annual precipitation in WY2022 at the Rincon Mountain District RAWS station at Saguaro National Park was 20.56″ (52.2 cm; Figure 5), which was 1.66″ (4.2 cm) less than the 1995–2020 annual average. Three months received substantially more precipitation than the 1995–2020 monthly averages: December, June, and August. Precipitation in March and July were similar to average. All other months received no precipitation or substantially less than average precipitation. Extreme daily rainfall events (≥ 1″; 2.54 cm) occurred on 3 days, less than the normal annual frequency of 4.5 days. Extreme rainfall events occurred on 28 July 2022 (1.04″; 2.6 cm), 31 July 2022 (1.08″; 2.7 cm), and 09 August 2022 (1.54″; 3.9 cm).
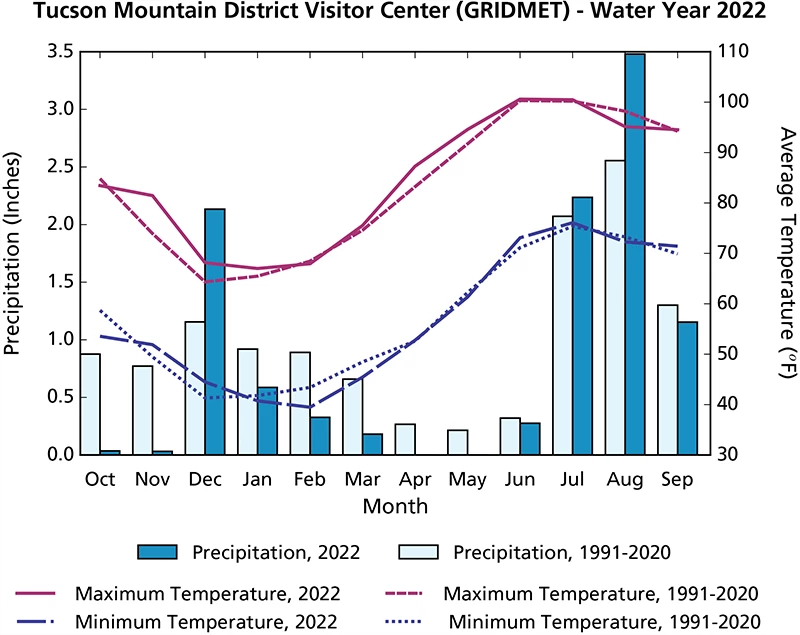
Data source: GRIDMET via climateanalyzer.org.
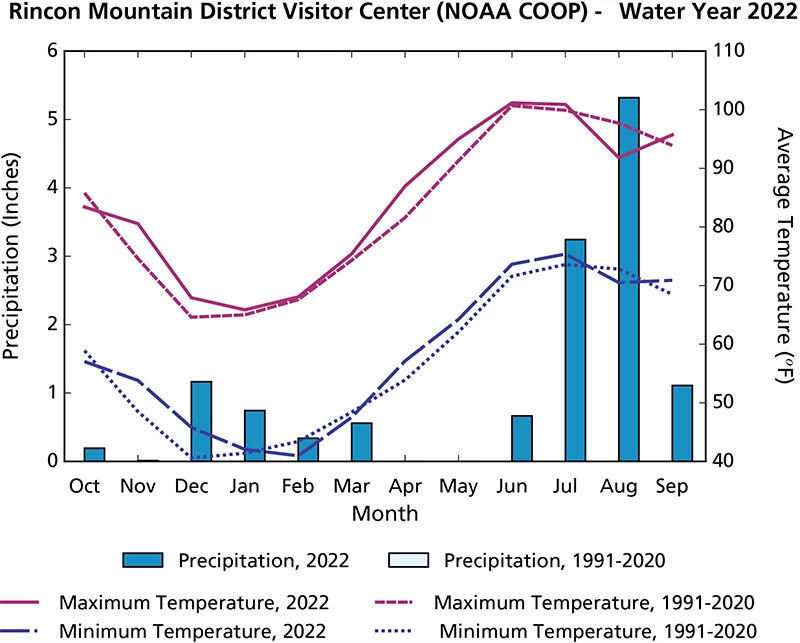
Data Source: climateanalyzer.org
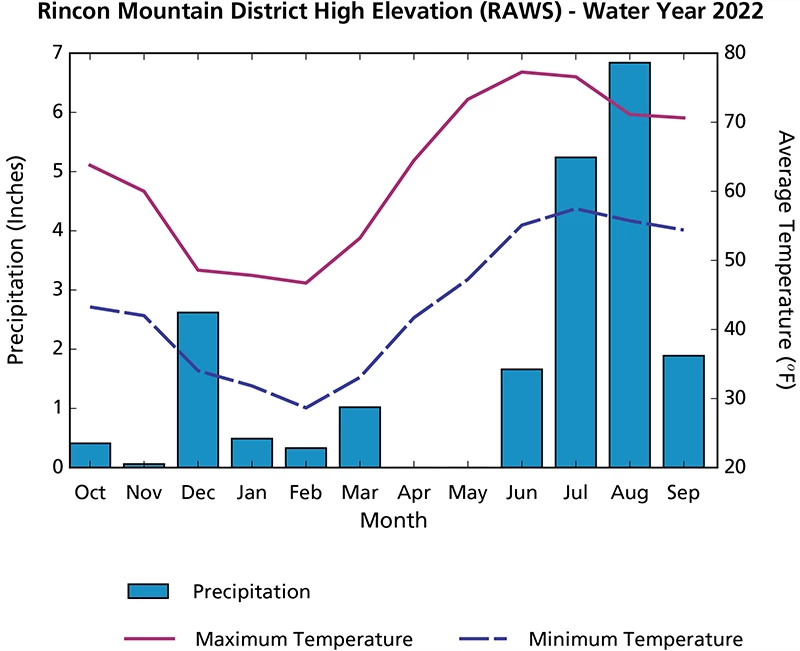
Data source: climateanalyzer.org
Drought
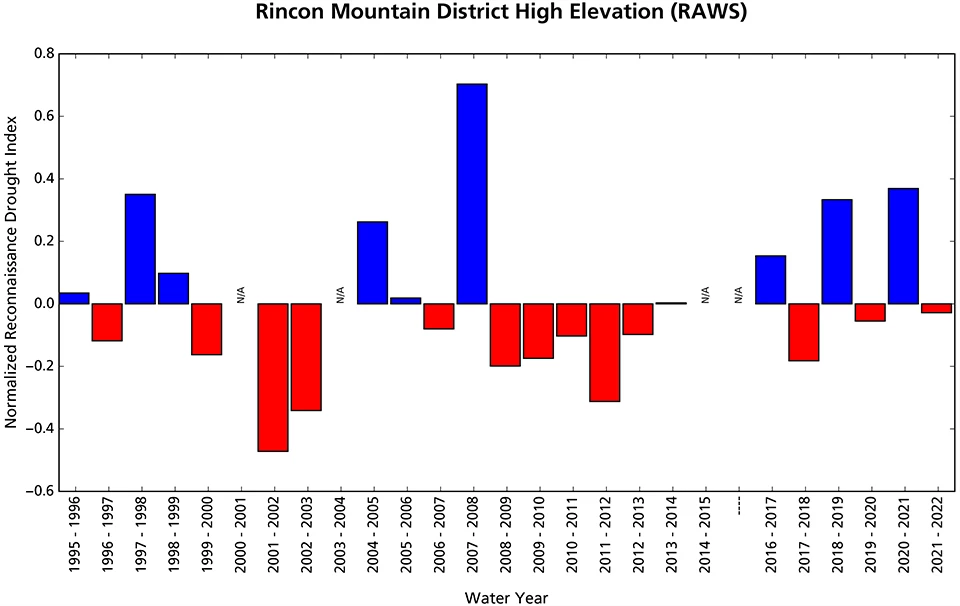
Reconnaissance drought index (Tsakiris and Vangelis 2005) provides a measure of drought severity and extent relative to the long-term climate. It is based on the ratio of average precipitation to average potential evapotranspiration (the amount of water loss that would occur from evaporation and plant transpiration if the water supply was unlimited) over short periods of time (seasons to years). The reconnaissance drought index for Saguaro National Park indicates that WY2022 was drier than the averages at the Tucson Mountain District visitor center (1991–2022, GRIDMET; Figure 6) and Rincon Mountain District high elevations (1996–2022, RAWS; Figure 7). The reconnaissance drought index for the Rincon Mountain District visitor center is missing many years of data and is not shown here.
Reference: Tsakiris G., and H. Vangelis. 2005. Establishing a drought index incorporating evapotranspiration. European Water 9: 3–11.
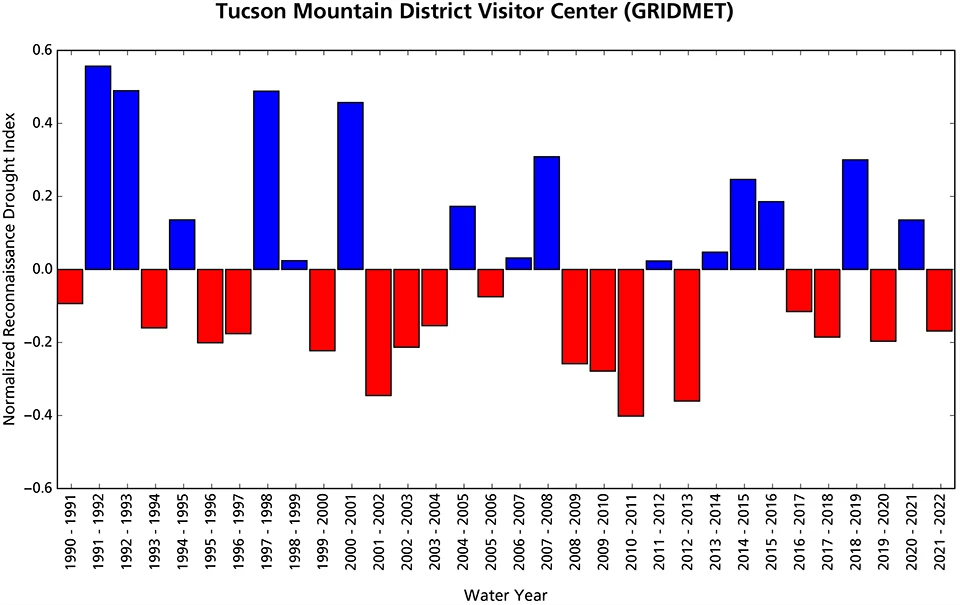
Data source: GRIDMET via climateanalyzer.org
Data source: climateanalyzer.org
Groundwater
Groundwater is one of the most critical natural resources in the American Southwest. It sustains rivers, streams, and springs throughout the region because of its close link with long-term precipitation and surface waters: ephemeral flows sink below ground to reappear months, years, or even centuries later as perennial and intermittent streams and springs. Groundwater also irrigates crops, supports native vegetation, and is the primary source of water for almost all humans in the southwestern U.S. Groundwater interacts either directly or indirectly with all key ecosystem features of the arid Sonoran Desert ecoregion.Results for Water Year 2022
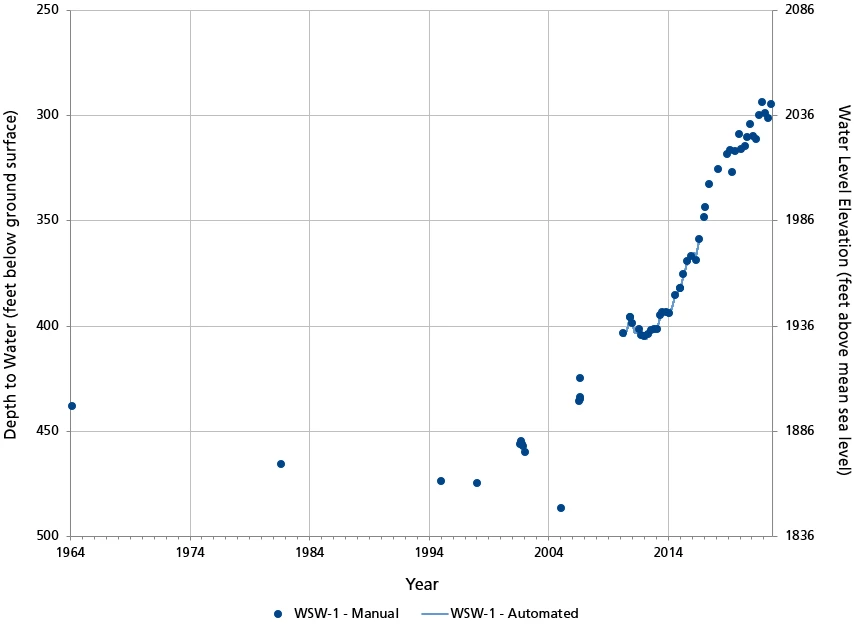
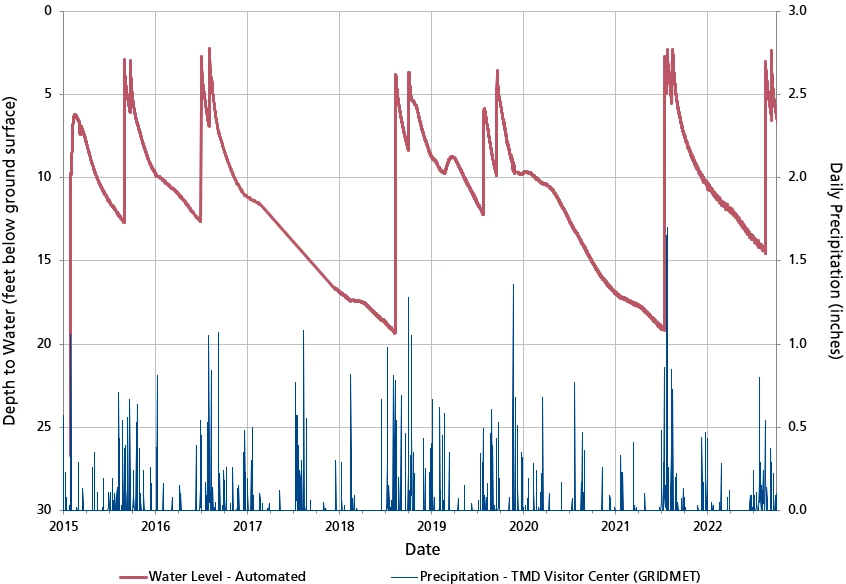
Groundwater monitoring results for WY2022 are summarized in Table 1. Mean depth-to-water at WSW-1 well was 297.21 ft (90.59 m) below ground surface (bgs), which was 9.14 ft (2.79 m) higher than in WY2021 and 189.65 ft (57.81 m) higher than the lowest recorded water level (observed in 2005; Figure 8). The aquifer has been recovering since the mid-1990s in response to recharge of Central Arizona Project water via the Central Avra Valley Storage and Recovery Project. Water levels at Red Hills Well declined steadily through the beginning of WY2022, reaching the lowest level (14.55 ft bgs, 4.43 m bgs) in August (Figure 9). Monsoonal rain events recharged the shallow aquifer, which peaked at 2.35 ft bgs (0.71 m bgs) in September.
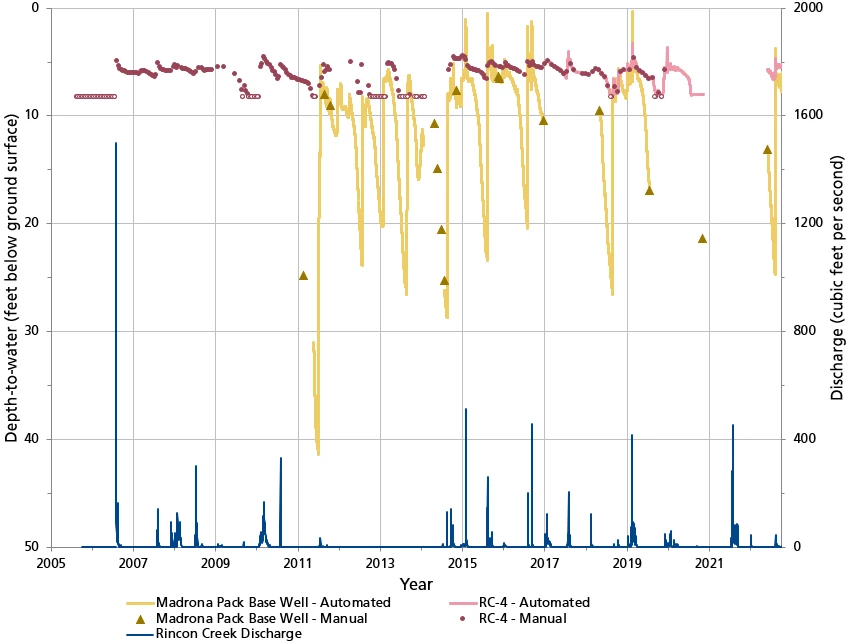
The available WY2022 data at the Madrona Pack Base and RC-4 wells both indicate dropping groundwater levels through June and July. Water levels rose at both wells following large monsoonal rain events and subsequent surface flow in the Rincon Creek watershed. All water levels recorded during WY2022 (June–September) were within the historical ranges for the wells.
Table 1. Groundwater monitoring results for Saguaro National Park in water year (WY) 2022. "amsl" = above mean sea level; "bgs" = below ground surface; "n/a" = not applicable; TMD = Tucson Mountain District; RMD = Rincon Mountain District, Mean depth-to-water at Madrone Pack Base and RC-4 wells only represents June–September of water year 2022.
| Well Name | State Well Number | Park Unit | Wellhead Elevation (ft amsl) |
Average Depth to Water (ft bgs) |
Average Water Level Elevation (ft amsl) |
Change in Elevation from WY2021 (± ft) |
|---|---|---|---|---|---|---|
| WSW-1 | 629094 | TMD | 2,336.00 | 297.21 | 2,038.79 | 9.14 |
| Red Hills Well | 629095 | RMD | 2,795.00 | 10.74 | 2,784.26 | 3.91 |
| Madrona Pack Base | 629099 | RMD | 3,350.00 | 13.41 | 3,336.59 | n/a |
| RC-4 | 206880 | RMD | 3,150.42 | 5.82 | 3,144.60 | n/a |
NPS
NPS
NPS
Springs
Background
Springs, seeps, and tinajas (discrete pools in a rock basin or impoundments in bedrock) are small, relatively rare biodiversity hotspots in arid lands. They are the primary connection between groundwater and surface water and are important water sources for plants and animals. For springs, the most important questions we ask are about persistence (How long was there water in the spring?) and water quantity (How much water was in the spring?).
Methods
Sonoran Desert Network springs monitoring is organized into four modules, described below.
Site Characterization
This module, which includes recording GPS locations and drawing a site diagram, provides context for interpreting change in the other modules. We also describe the spring type (e.g., helocrene, limnocrene, rheocrene, or tinaja) and its associated vegetation. Helocrene springs emerge as low-gradient wetlands, limnocrene springs emerge as pools, and rheocrene springs emerge as flowing streams. This module is completed once every five years or after significant events.
Site Condition
We estimate natural and anthropogenic disturbances and the level of stress on vegetation and soils on a scale of 1–4, where 1 = undisturbed, 2 = slightly disturbed, 3 = moderately disturbed, and 4 = highly disturbed. Types of natural disturbances can include flooding, drying, fire, wildlife impacts, windthrow of trees and shrubs, beaver activity, and insect infestations. Anthropogenic disturbances can include roads, off-highway vehicle trails, hiking trails, livestock and feral-animal impacts, removal of invasive non-native plants, flow modification, and evidence of human use of the spring. We take repeat photographs showing the spring and its landscape context. We note the presence of certain obligate wetland plants (plants that almost always occur only in wetlands), facultative wetland plants (plants that usually occur in wetlands, but also occur in other habitats), and non-native bullfrogs and crayfish, and we record the density of invasive, non-native plants.
Water Quantity
We measure the persistence of surface water, amount of spring discharge, and wetted extent (area that contained water). To estimate persistence, we analyze the variance of temperature measurements taken by logging thermometers placed at or near the orifice (spring opening). Because water mediates variation in diurnal temperatures, data from a submerged sensor will show less daily variation than data from an exposed open-air sensor; this tells us when the spring was wet or dry. Surface discharge is measured with a timed sample of water volume. Wetted extent is a systematic measurement of the physical length (up to 100 m), width, and depth of surface water. It is assessed using a technique for either standing water (e.g., limnocrene and helocrene springs) or flowing water (e.g., rheocrene springs).
Water Quality
We measure core water quality parameters and water chemistry. Core parameters include water temperature, pH, specific conductivity (a measure of dissolved compounds and contaminants), dissolved oxygen (how much oxygen is present in the water), and total dissolved solids (an indicator of potentially undesirable compounds). Discrete samples of these parameters are collected with a multiparameter meter. If the meter fails calibration check(s), we indicate that condition when presenting data. Water chemistry is assessed by collecting surface water sample(s) and estimating the concentration of major ions with a photometer in the field. These parameters are collected at one or more sampling locations within a spring. Data are presented only for the primary sampling location. Each perennial spring is somewhat unique, and there are no water quality standards specific to most perennial springs in Arizona. Where conditions exceed water quality standards for other surface waters (rivers, streams, lakes, and reservoirs), we note it, but the reader is advised that these standards were not developed for perennial springs. Our ongoing data collection at each spring will improve our understanding of the natural range in water quality and water chemistry parameters for a given site.
Inventory of Rare and Invasive Species and Pathogens
An inventory of rare and invasive species and pathogens in perennial springs was implemented in WY2022 using environmental DNA (eDNA) techniques. Four to 16 water samples were collected and filtered (0.45 µm mesh) from each spring. Samples were preserved in ethanol prior to DNA extraction and analysis by the Goldberg Lab at Washington State University .
Target Organisms for eDNA Project:
-
The non-native invasive American bullfrog (Rana catesbeianus), which had previously been reported within Saguaro National Park and may still be present (Powell et al. 2006).
-
The pathogen chytrid fungus (Batrachochytrium dendrobatidis), a major threat to amphibians globally that is currently expanding in the American Southwest and known to occur at Saguaro National Park (Powell et al. 2006). American bullfrog is an important vector of chytrid fungus.
-
Ranaviruses, pathogens that can infect amphibians and produce 90–100% mortality in tadpoles and adults and can persist in affected wetlands. Ranaviruses have not been previously detected at Saguaro National Park. American bullfrog is an important vector of ranaviruses.
-
The native amphibian lowland leopard frog (Rana yavapaiensis), a species of conservation concern that is well-studied and documented within Saguaro National Park (Powell and Swann 2013).
-
The native amphibian Chiricahua leopard frog (Rana chiricahuensis), a federally designated threatened species that has not been previously documented at Saguaro National Park (Powell et al. 2006). Designated critical habitat is located south of the park in the Santa Rita Mountains.
-
The native aquatic northern Mexican garter snake (Thamnophis eques megalops), a federally designated threatened species that has not been previously observed within Saguaro National Park (Powell et al. 2006). Designated critical habitat is found just south of the park in Cienega Creek.
-
The native jaguar (Panthera onca), a federally designated endangered species that was historically found within Saguaro National Park (Swann 2012). The Tucson Mountain District of the park is within the designated critical habitat for jaguar recovery.
Reference: Powell B. F., W. L. Halvorson, and C. A. Schmidt. 2006. Vascular plant and vertebrate inventory of Saguaro National Park, Rincon Mountain District. U.S. Geological Survey (USGS) Open-File Report. 2006-1075. USGS, SBSC, Sonoran Desert Research Station, and School of Natural Resources, U of A. Tucson, Arizona
List of Springs
Scroll down or click on a spring below to view monitoring results.
Low Elevation Springs
Chiminea 1L ǀ Javelina Tank ǀ The Grotto ǀ Wildhorse Tank 10GHigh Elevation Springs
Bulrush Spring ǀ Cabin Spring ǀ Dark Spring ǀ Grass Shack Tinaja ǀ Italian Spring ǀManna Grass Spring ǀ Manning Spring ǀ Mica Meadows Trail Seep 1 ǀ Mud Hole Spring ǀ New Spring 3 ǀ Spud Rock Spring ǀ Scarlet Spring
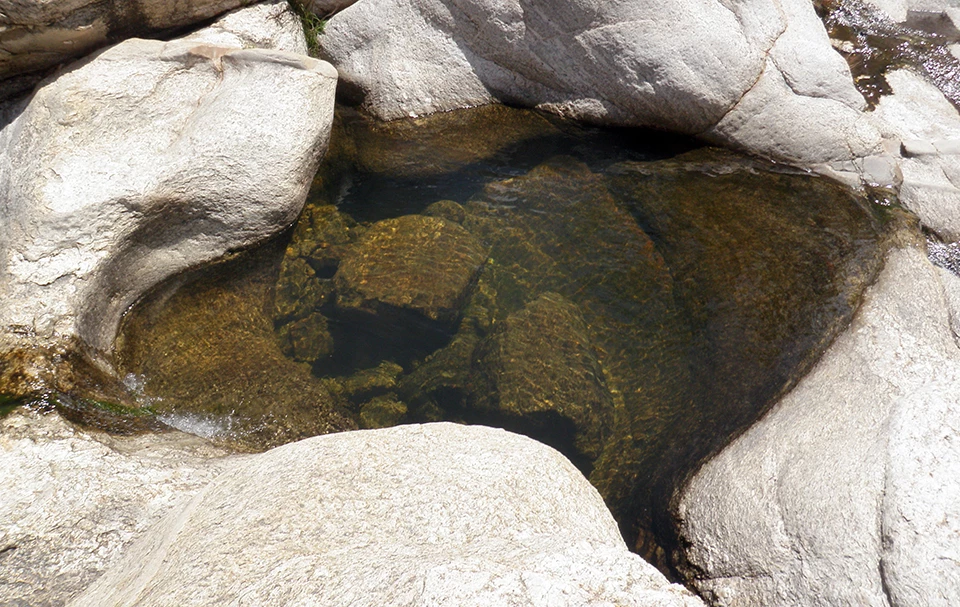
NPS
WY2022 Findings at Chiminea 1L (Low Elevation Tinaja)
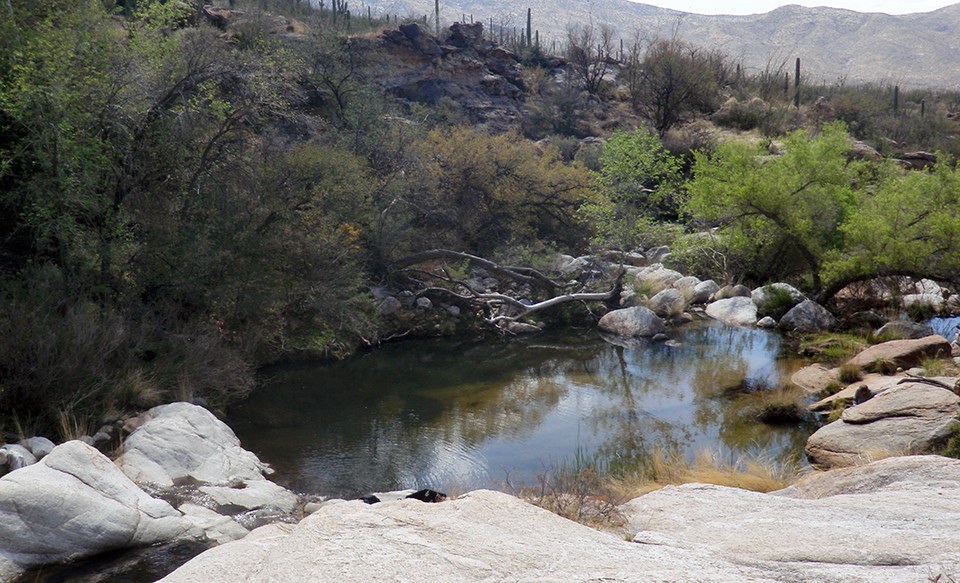
Chiminea 1L (Figure 11) is a tinaja spring (pool in a rock basin or impoundment in bedrock) last characterized in WY2022. It is part of a multi-pool tinaja complex containing more than 15 flowing pools (Figure 12). The primary tinaja chosen for sampling, designated orifice A, is historically known to be persistently wetted but ephemerally connected by flow to other pools. This tinaja is approximately 3 x 4 m (9.8 x 13.1 ft), and flows into Big 1L tinaja, the largest pool (30 x 50 m) in the complex. On the 04 April 2022 visit both Chimea 1L and Big 1L contained water and large numbers of aquatic insects and frogs (canyon tree frogs [Hyla aerenicolor] and lowland leopard frogs [Rana yavapaiensis]). There were also aquatic plants in and around Big 1L. Descriptions and other characteristics of springs are updated every five years.
NPS
Site Condition
We rated Chiminea 1L as “slightly disturbed” in WY2022 due to the extensive network of wildlife tracks around the edges of Big 1L, the large, lower pool. No other natural or human-caused disturbances were observed. As in past years, we did not observe crayfish or bullfrogs (non-native invasive aquatic animals) at Chiminea 1L or Big 1L tinajas in WY2022, nor did we detect any non-native plants. The obligate wetland plant monkeyflower (Mimulus sp.) was present in the shallows of the Chiminea 1L. Sedges (Carex sp. and Cyperaceae) and Arizona sycamore (Platanus wrightii) were present along the edges and in the shallows of Big 1L.Inventory of Rare and Invasive Species and Pathogens
Sixteen water samples were collected and filtered from Chiminea 1L (n = 4) and Big 1L (n = 12) during the WY2022 visit. We detected two of our target organisms at Chiminea 1L and Big 1L in WY2022: the native amphibian lowland leopard frog was detected on 14 filters, and the pathogen chytrid fungus (Batrachochytrium dendrobatidis) was detected on 7 filters. Our other target species were not detected at Chiminea 1L and Big 1L in WY2022.Water Quantity
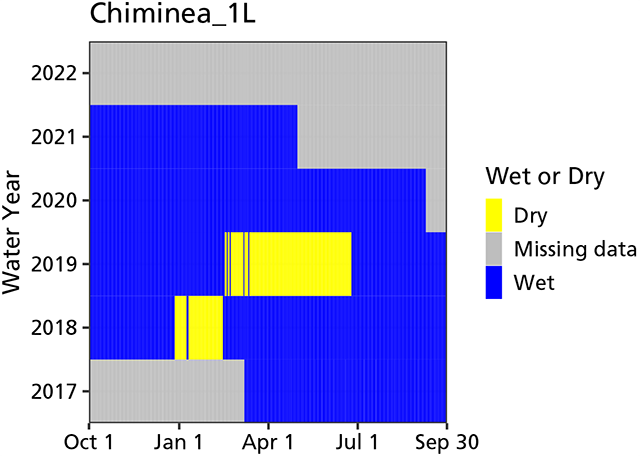
The WY2022 visit occurred on 04 April 2022, and the spring contained water. The temperature sensor used to estimate water persistence in the Chiminea 1L tinaja was not located during the WY2022 visit—perhaps washed away during a runoff event sometime after it was deployed in WY2021. In prior water years, the spring was wetted (contained water) 65.8–100% of the days measured (Figure 13). A new sensor and cable were deployed on 04 April 2022.
NPS
Discharge was estimated at 99.8 ± 2.6 L/min (26.4 ± 0.7 gal/min) in WY2022—almost two orders of magnitude greater than we observed during any past visit (Table 2).
Wetted extent at Chiminea 1L was evaluated using a method for standing water (at the tinaja only). Width averaged 201.7 cm (79.4 in), length averaged 251.7 cm (99.1 in), and depth averaged 45.7 cm (18 in)—comparable to past measurements (Table 3).
Water Quality
Core water quality and water chemistry data were collected at the primary sampling location within the tinaja at Chiminea 1L. All values were within the range recorded in prior years (Table 4 and Table 5), except for water temperature, which was about 2°C warmer than previously measured.
Chiminea 1L tinaja Data Tables
| Sampling Location | WY2022 Value (range of prior values) | Prior Years Measured (# of measurements) |
|---|---|---|
| 001 | 99.8 ± 2.6 (1.6–2.1) | 2018–2021 (2) |
| Measurement | WY2022 Value (range of prior values) |
Prior Years Measured (# of measurements) |
|---|---|---|
| Width (m) | 2.0 ± 1.9 (2.0–2.5) | 2018–2021 (3) |
| Depth (cm) | 45.7 ± 50.5 (45.5–57.2) | 2018–2021 (3) |
| Length (m) | 2.5 ± 2.1 (2.3–2.4) | 2018–2021 (3) |
| Sampling Location | Measurement Location (width, depth) |
Parameter | WY2022 Value (range of prior values) |
Prior Years Measured (# of measurements) |
|---|---|---|---|---|
| 001 | Center | Dissolved oxygen (mg/L) | 8.46 (7.97–9.51) |
2017–2021 (4) |
| 001 | Center | pH | 7.60 (7.36–8.20) |
2017–2021 (4) |
| 001 | Center | Specific conductivity (µS/cm) | 59.0 (38.5–84.3) |
2017–2021 (4) |
| 001 | Center | Temperature (°C) | 21.5 (14.2–19.4) |
2017–2021 (5) |
| 001 | Center | Total dissolved solids (mg/L) | 38.0 (31.2–55.0) |
2018–2021 (3) |
| Sampling Location | Measurement Location (width, depth) |
Parameter | WY2022 Value (range of prior values) |
Prior Years Measured (# of measurements) |
|---|---|---|---|---|
| 001 | Center | Alkalinity (CaCO3) |
50 (15–45) | 2017–2021 (4) |
| 001 | Center | Calcium (Ca) |
4 (0–4) | 2017–2021 (4) |
| 001 | Center | Chloride (Cl) |
11 (3–29) | 2017–2021 (4) |
| 001 | Center | Magnesium (Mg) |
9 (b.d.l.–8) | 2017–2021 (4) |
| 001 | Center | Potassium (K) |
0.7 (0.4–1.7) | 2018–2021 (3) |
| 001 | Center | Sulphate (SO4) |
3 (1–4) | 2017–2021 (4) |
NPS
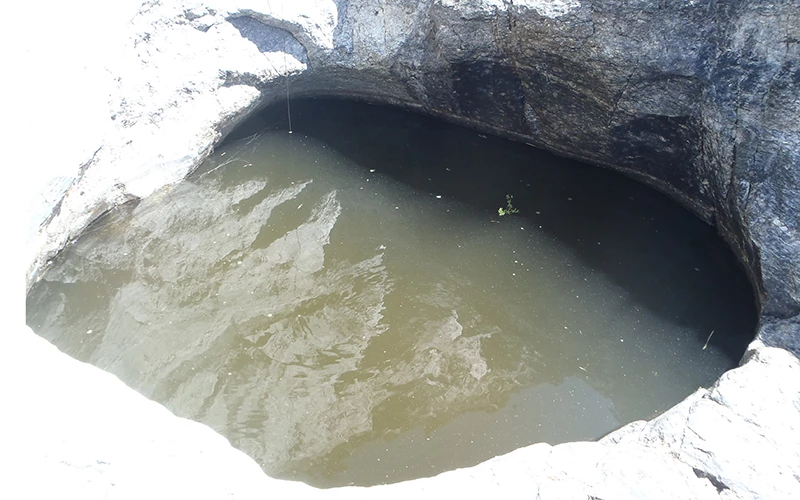
WY2022 Findings at Javelina Tank (Low Elevation Tinaja)
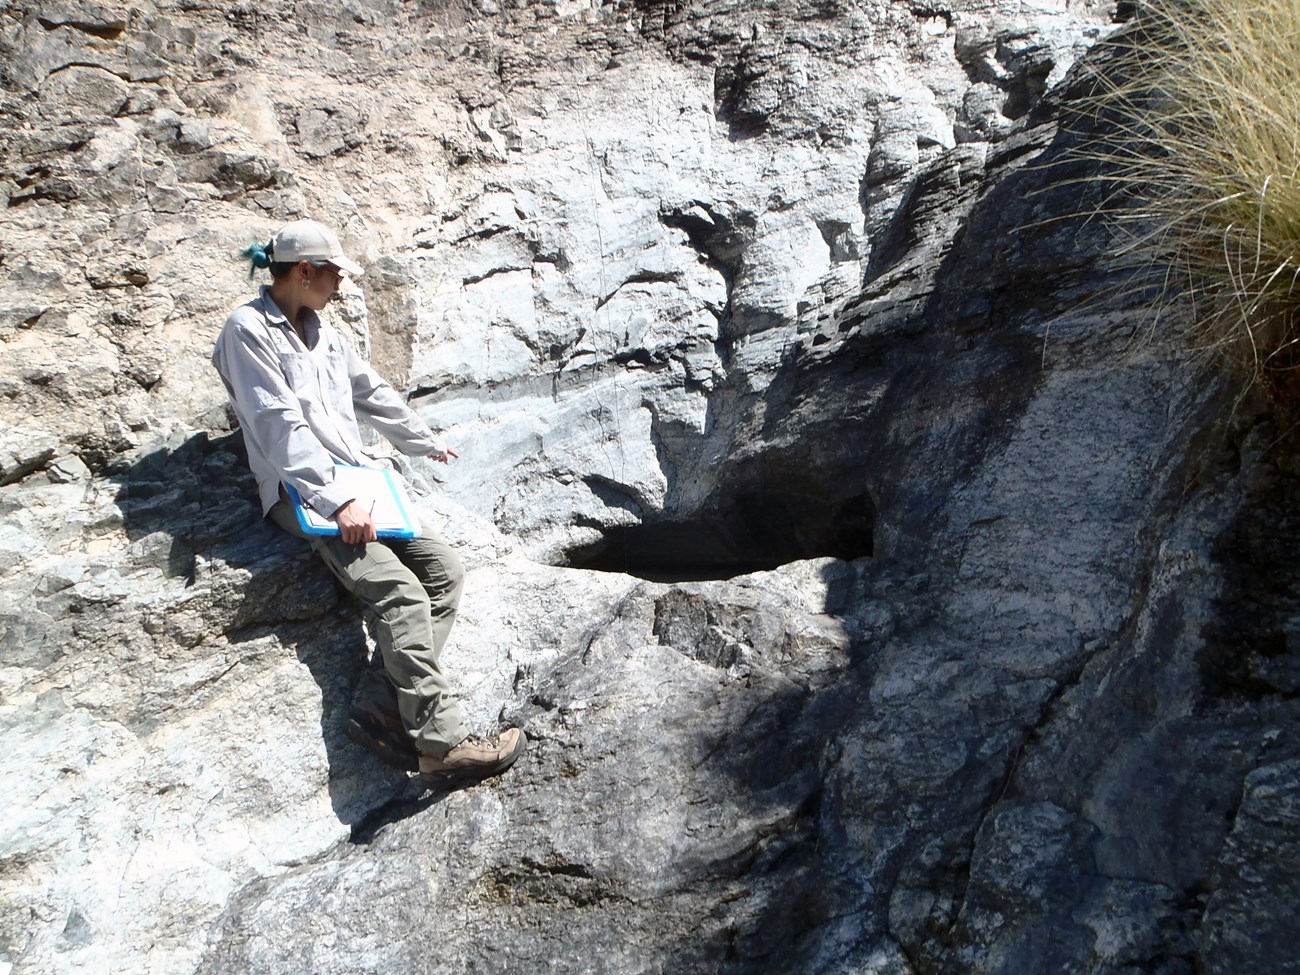
Javelina Tank (Figure 14) is a small tinaja spring (pool in a rock basin or impoundment in bedrock) complex located within a wide bedrock drainage in the foothills of the Rincon Mountains. The complex consists of one deep pool (> 50 cm deep; called the "tank") at the base of a steep bedrock cliff that is 4 m tall (Figure 15) and several smaller (about 1 x 1 m) and shallower (5–30 cm) pools immediately downstream. There is also a pair of medium-sized bedrock pools (about 3 m in diameter and 15–30 cm deep) located another 10 meters downstream that support obligate wetland plants. This complex appears to be supported by a mixture of groundwater and captured overland flow. Descriptions and other characteristics of springs are updated every five years. The WY2022 visit and site characterization occurred on 05 April 2022.
NPS
Site Condition
The only natural or human-caused disturbances observed at Javelina Tank in WY2022 were the substantial effects of recent flooding. Thick accumulation of woody debris along the channels and up to 3 m of woody debris in the surrounding tree and shrub canopies, along with scoured bedrock sections of the spring brook and fresh sediment in the lowest pool, indicate a major runoff event prior to the WY2022 visit. As a result, there were highly disturbed conditions throughout the Javelina Tank spring complex. An additional indicator was the water temperature sensor was found more than three meters away from the primary tinaja on a dry section of the channel rock face. No other human-caused or natural disturbances were observed at Javelina Tank in WY2022.
Consistent with past years, we did not observe crayfish or bullfrogs (non-native, invasive aquatic animals) at Javelina Tank. However, we detected several non-native plants: scattered patches of red brome (Bromus rubens), 1–5 crimson fountaingrass (Cenchrus setaceus) crowns, and—for the first time at Javelina Tank—scattered patches of buffelgrass (Cenchrus ciliaris), the most challenging invasive weed at Saguaro National Park. All three non-native grasses were detected along the springbrook and lowest pool in the Javelina Tank complex.
As in previous visits, we observed the obligate wetland grass cattail (Typhaceae) and the forb monkeyflower (Mimulus sp.) in and around the lowest pool. The facultative wetland shrub mule-fat (Baccharis salicifolia) and obligate wetland forb water speedwell (Veronica anagallis) were observed at the Javelina Tank tinaja complex for the first time in WY2022. These plants were found around the springbrook and lowest pool, the only places where vegetation is growing at the complex.
Inventory of Rare and Invasive Species and Pathogens
Four water samples were collected and filtered from Javelina Tank (two in the tinaja, two in the lower pool). None of our target organisms were detected at Javelina Tank in WY2022.
Water Quantity
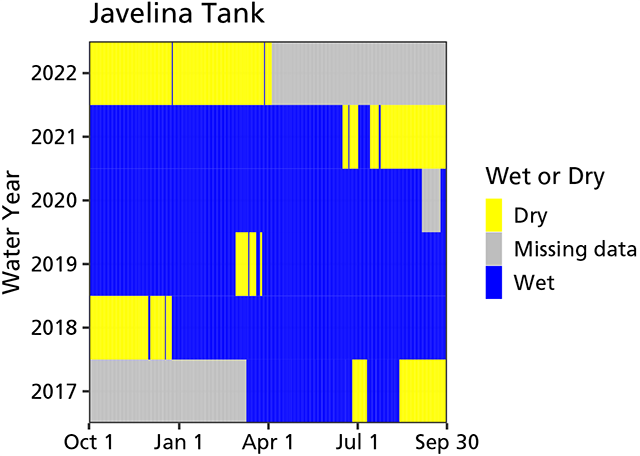
The WY2022 visit occurred on 05 April 2022, and the spring contained water. The water temperature sensor used to estimate spring persistence was found tethered on the rock face 3 meters above the tinaja, suggesting that a flow event may have flushed the sensor out of the site soon after the WY2021 deployment. As a result, we suspect the dry indications between the WY2021 and WY2022 visits are false-negatives and do not estimate persistence of Javelina Tank for that time period. In prior water years, the spring was wetted 69.1–100% of the days measured (Figure 16).
NPS
As in previous years, discharge could not be measured in WY2022 as there was no surface flow. Wetted extent of Javelina Tank was evaluated using a method for standing water in April 2022. Width averaged 144.7 cm (57 in), length averaged 150.0 cm (59.1 in), and depth averaged 63.7 cm (25.1 in). Due to accessibility limitations in past years, WY2022 was the first-year extent was measured within the tinaja.
Water Quality
Core water quality and water chemistry data were collected at the primary sampling location: Javelina Tank tinaja. Specific conductivity and total dissolved solids were about half the lowest value previously observed, and pH was slightly lower than prior measurements (Table 6). All other parameters were within the range of previous observations at Javelina (Table 6 and Table 7).
Javelina Tank Tinaja Data Tables
| Sampling Location | Measurement Location (width, depth) |
Parameter | WY2022 Value (range of prior values) |
Prior Years Measured (# of measurements) |
|---|---|---|---|---|
| 001 | Center | Dissolved oxygen (mg/L) | 6.34 (1.19–11.43) |
2017–2021 (4) |
| 001 | Center | pH | 6.95 (7.20–8.64) |
2017–2021 (4) |
| 001 | Center | Specific conductivity (µS/cm) | 71.1 (126.8–329.0) |
2017–2021 (4) |
| 001 | Center | Temperature (°C) | 20.0 (14.1–30.9) |
2017–2021 (5) |
| 001 | Center | Total dissolved solids (mg/L) | 46.0 (82.0–213.8) |
2018–2021 (3) |
| Sampling Location | Measurement Location (width, depth) |
Parameter | WY2022 Value (range of prior values) |
Prior Years Measured (# of measurements) |
|---|---|---|---|---|
| 001 | Center | Alkalinity (CaCO3) |
30 (35–65) | 2017–2021 (4) |
| 001 | Center | Calcium (Ca) |
8 (10–24) | 2017–2021 (4) |
| 001 | Center | Chloride (Cl) |
2 (0–9) | 2017–2021 (4) |
| 001 | Center | Magnesium (Mg) |
0 (b.d.l.–12) | 2017–2021 (4) |
| 001 | Center | Potassium (K) |
2.3 (1.0–3.2) | 2017–2021 (4) |
| 001 | Center | Sulphate (SO4) |
0 (0–40) | 2017–2021 (4) |
NPS
WY2022 Findings at The Grotto (Low Elevation Spring Complex)
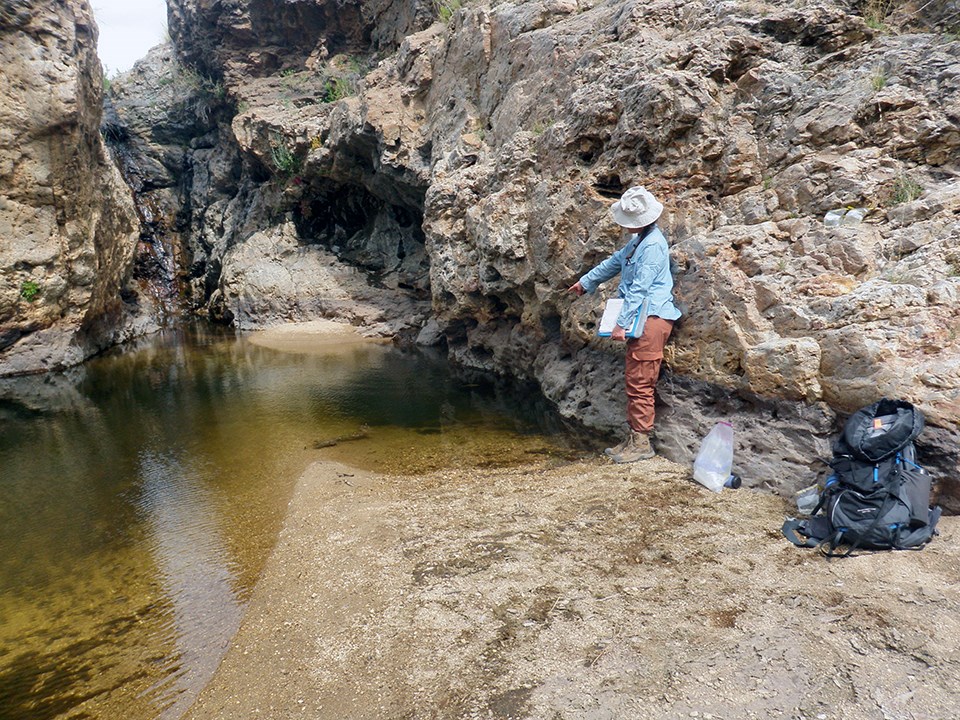
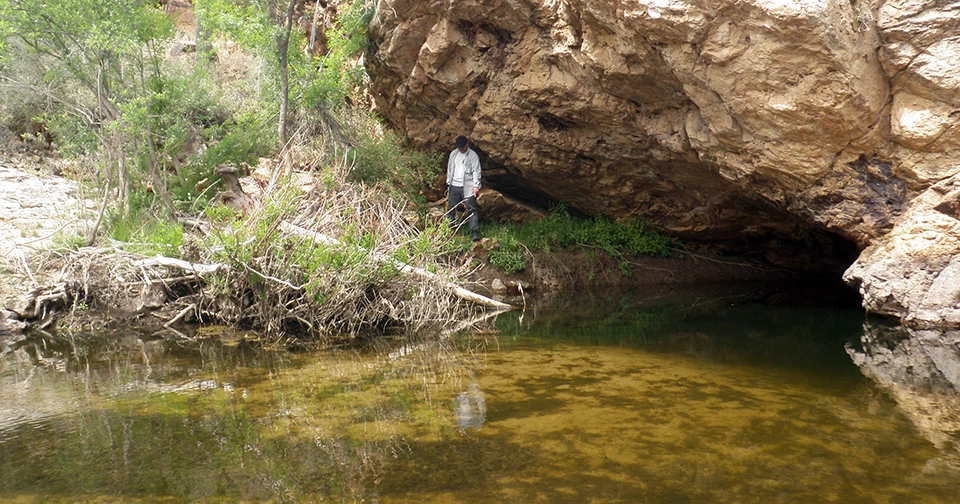
The Grotto (Figure 17) is a tinaja (pool in rock basin or impoundment in bedrock) spring complex consisting of two very large pools connected by a springbrook and large waterfall (about 6 m). Located in the Rincon Creek drainage, surface water within The Grotto spring complex is likely comprised of both stream runoff and a substantial groundwater component. The second pool at the base of the waterfall is the largest pool, with rock walls on three sides and a flat sandy area on the downstream end. There is a small cave with an overhanging rock and water dripping from the roof (Figure 18). When observed and characterized on 19 April 2022, the Grotto contained substantial water (> 1 m depth in the upper pool, > 2 m in the larger, lower pool, and a flowing waterfall between the pools). Aquatic macroinvertebrates, lowland leopard frogs (Rana yavapaiensis) and terrestrial insects were abundant throughout the pools and springbrook on the April visit. Descriptions and other characteristics of springs are updated every five years. The Grotto was previously visited only in WY2017 for this protocol.
NPS
Site Condition
In WY2022, we noted slight disturbance of The Grotto from wildlife use: there were extensive tracks and other sign from deer, javelina, and bobcat throughout the site, and there was an active den adjacent to one of the pools. The Grotto was also moderately disturbed from recent flooding, with woody debris found in canopies 1.5–2 m above the pools and fresh sediment deposits around the downstream edge of the lower pool. No other natural or human-caused disturbances were observed at The Grotto in April 2022.
Consistent with the previous visit in WY2017, we did not observe crayfish or bullfrogs (non-native invasive aquatic animals) at The Grotto in WY2022, nor did we detect any non-native invasive plants. We documented five obligate/facultative wetland plants: the trees Arizona sycamore (Platanus wrightii) and Goodding’s willow (Salix gooddingii), the shrub mule-fat (Baccharis salicifolia) around the lower (main) pool and along the springbrook between the pools, the forb water speedwell (Veronica anagallis), and sedges (Carex sp.). Water speedwell and sedges were found throughout the spring complex.
Inventory of Rare and Invasive Species and Pathogens
Sixteen water samples were collected and filtered from the upper and lower pools and connecting springbrook of The Grotto on 19 April 2022. We detected two of our target organisms: the native amphibian lowland leopard frog (Rana yavapaiensis) was detected on all 16 filters, and the pathogen chytrid fungus (Batrachochytrium dendrobatidis) was detected on eight filters. None of our other target species were detected at The Grotto in April 2022.
Water Quantity
The WY2022 visit occurred on 19 April 2022, and the spring contained water. Water persistence could not be estimated as temperature sensors had not been deployed since the previous site visit in WY2017. We did not estimate discharge as there was no outflow from the lowest pool, and access to the actively flowing area—the waterfall—was not safe for staff to access.
Water Quality
Core water quality and water chemistry data were collected at the primary sampling location (lower pool near cave) of The Grotto in WY2022. All parameters were comparable with the WY2017 values (Tables 8–9), with the exception of chloride, which was about eight times higher than the single WY2017 visit. With annual monitoring restarted at this site in WY2022, we will have a more reliable baseline range of water quality and chemistry values in future years.
The Grotto Data Tables
| Sampling Location | Measurement Location (width, depth) |
Parameter | WY2022 Value (prior value) |
Prior Years Measured (# of measurements) |
|---|---|---|---|---|
| 002 | Center | Dissolved oxygen (mg/L) | 9.53 (6.98) |
2017 (1) |
| 002 | Center | pH | 7.39 (7.37) |
2017 (1) |
| 002 | Center | Specific conductivity (µS/cm) | 125.8 (96.4) |
2017 (1) |
| 002 | Center | Temperature (°C) | 18.2 (18.2) |
2017 (1) |
| 002 | Center | Total dissolved solids (mg/L) | 82.0 (61.1) |
2017 (1) |
| Sampling Location | Measurement Location (width, depth) |
Parameter | WY2022 Value (range of prior values) |
Prior Years Measured (# of measurements) |
|---|---|---|---|---|
| 002 | Center | Alkalinity (CaCO3) |
45 (40) | 2017 (1) |
| 002 | Center | Calcium (Ca) |
6 (4) | 2017 (1) |
| 002 | Center | Chloride (Cl) |
42 (6) | 2017 (1) |
| 002 | Center | Magnesium (Mg) |
3 (9) | 2017 (1) |
| 002 | Center | Potassium (K) |
2.9 (1.0) | 2017 (1) |
| 001 | Center | Sulphate (SO4) |
3 (2) | 2017 (1) |
NPS
WY2022 Findings at Wildhorse Tank 10G (Low Elevation Tinaja)
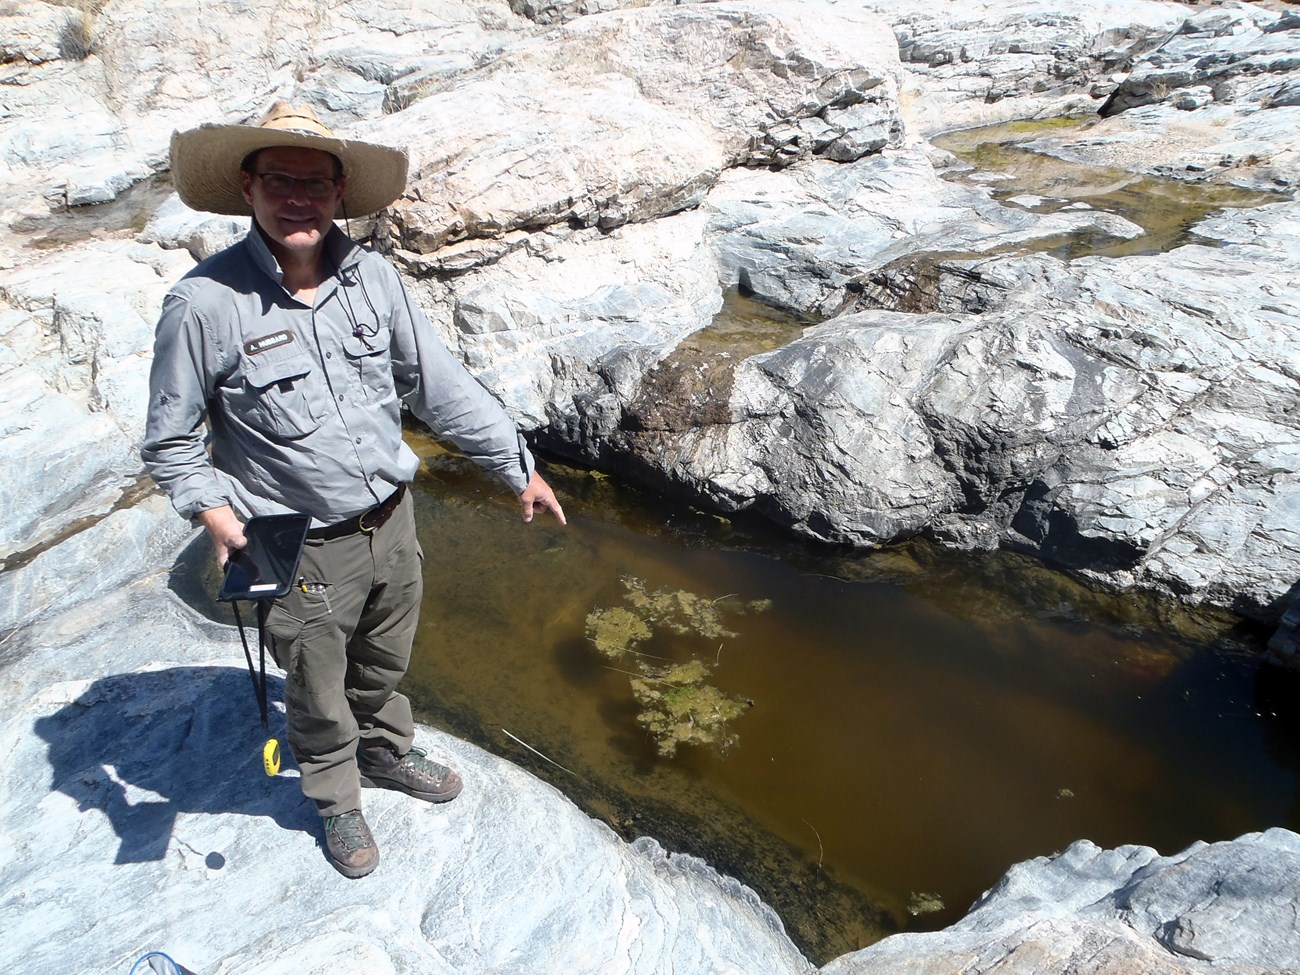
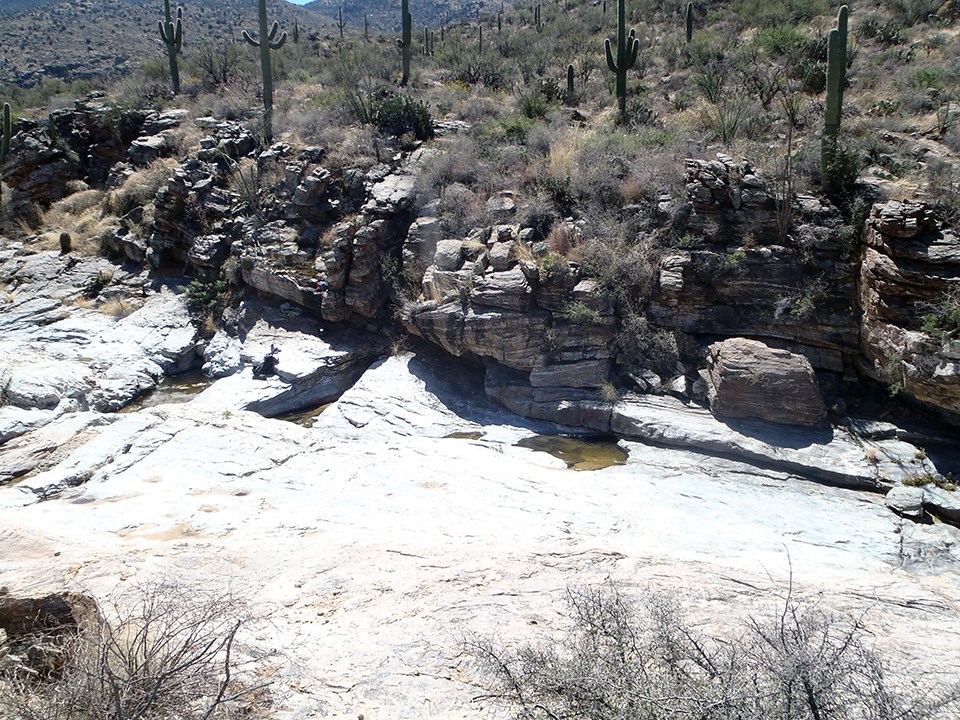
Wildhorse Tank 10G tinaja (Figure 19) is a small tinaja (small pool in a rock basin or impoundment in bedrock) located within a complex of tinajas in Wildhorse Canyon (Figure 20). When characterized in WY2022, there were four wetted tinajas within 50 m (164 ft) of Wildhorse Tank 10G tinaja. Descriptions and other characteristics of springs are updated every five years. The WY2022 visit occurred on 01 April 2022, and the spring contained water.
NPS
Site Condition
As in past years, we did not observe any natural or human-caused disturbances, non-native aquatic animals (crayfish and bullfrogs), non-native plants, or native obligate/facultative wetland plants at Wildhorse Tank 10G tinaja in WY2022.
Inventory of Rare and Invasive Species and Pathogens
Four water samples were collected and filtered from Wildhorse Tank 10G tinaja on 01 April 2022. None of our target organisms were detected.
Water Quantity
Temperature sensors indicated that Wildhorse Tank 10G tinaja was wetted (contained water) for all 183 days (100% of days) measured up to the WY2022 visit (Figure 21). In prior water years, the spring was wetted 83.8–97.4% of the days measured.

NPS
As in most past years (Table 10), we were unable to measure discharge at Wildhorse Tank 10G tinaja in WY2022 due to the absence of outflow from the tinaja.
Wetted extent at the tinaja was evaluated using a method for standing water in WY2022. In line with previous years (Table 11), width averaged 149.3 cm (58.8 in), length averaged 460 cm (181.1 in), and depth averaged 51 cm (20.1 in).
Water Quality
Core water quality (Table 12) and water chemistry data (Table 13) were collected at the primary sampling location (southwest corner of pool) at Wildhorse Tank 10G tinaja in WY2022. Chloride and magnesium were over 30 times and four times higher, respectively, than previously measured at this location (Table 13). The magnitude of these values suggests a possible sample processing error, though specific conductance and total dissolved solids—measures that are positively correlated with these ions—were also somewhat higher than previously observed at Wildhorse Tank 10G tinaja (Table 12). Future monitoring at this location will clarify if the unusual chloride and magnesium values were a sampling error, transient spike in concentrations, or lasting shift in water chemistry for this site. All other parameters were within the range of prior measurements.
Wildhorse Tank 10G Data Tables
Sampling Location |
WY2022 Value (range of prior values) | Prior Years Measured (# of measurements) |
|---|---|---|
| 003 | c.n.s. (1.1) | 2018 (1) |
| Measurement | WY2022 Value (range of prior values) |
Prior Years Measured (# of measurements) |
|---|---|---|
| Width (cm) | 149.3 ± 41.0 (147.6–170.2) | 2018–2021 (3) |
| Depth (cm) | 51.0 ± 37.7 (39.0–48.2) | 2018–2021 (3) |
| Length (m) | 4.6 ± 1.2 (2.9–4.8) | 2018–2021 (3) |
| Sampling Location | Measurement Location (width, depth) |
Parameter | WY2022 Value (range of prior values) |
Prior Years Measured (# of measurements) |
|---|---|---|---|---|
| 001 | Center | Dissolved oxygen (mg/L) | 10.67 (8.44–12.47) |
2018–2021 (2) |
| 001 | Center | pH | 8.82 (8.06–10.08) |
2017–2021 (4) |
| 001 | Center | Specific conductivity (µS/cm) | 386.8 (182.7–340.7) |
2017–2021 (4) |
| 001 | Center | Temperature (°C) | 19.0 (16.4–20.4) |
2017–2021 (5) |
| 001 | Center | Total dissolved solids (mg/L) | 251.0 (119.0–221.7) |
2017–2021 (4) |
| Sampling Location | Measurement Location (width, depth) |
Parameter | WY2022 Value (range of prior values) |
Prior Years Measured (# of measurements) |
|---|---|---|---|---|
| 001 | Center | Alkalinity (CaCO3) |
135 (60–125) | 2017–2021 (4) |
| 001 | Center | Calcium (Ca) |
14 (14–26) | 2017–2021 (4) |
| 001 | Center | Chloride (Cl) |
425 (b.d.l.–13) | 2017–2021 (4) |
| 001 | Center | Magnesium (Mg) |
70 (b.d.l.–16) | 2017–2021 (4) |
| 001 | Center | Potassium (K) |
1.8 (0.3–3.0) | 2017–2021 (4) |
| 001 | Center | Sulphate (SO4) |
1 (0–8) | 2017–2021 (4) |
NPS
WY2022 Findings at Bulrush Spring (High Elevation Spring Complex)
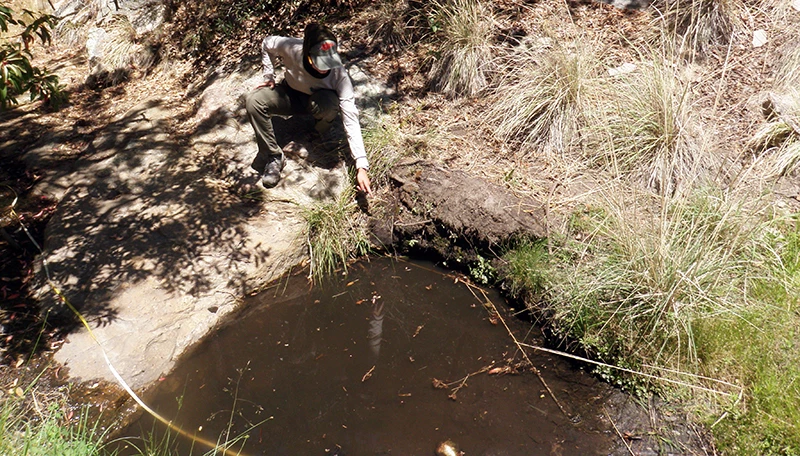
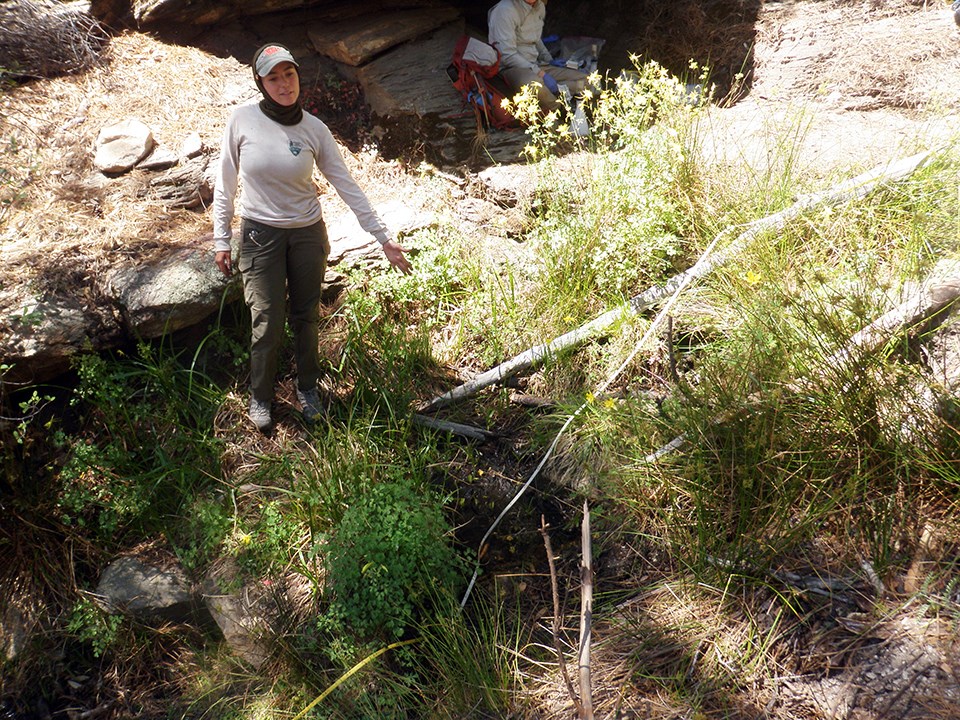
Bulrush Spring is a rheocrene spring (emerges as a flowing stream) located on the east-facing slope of the Rincon Mountains below Heartbreak Ridge. Bulrush Spring consists of a series of small (< 2m wide), shallow pools (Figure 22) connected by a springbrook with negligible aboveground flow. When last visited and characterized on 13 June 2022, Bulrush Spring contained water, numerous canyon tree frogs, and diverse communities of aquatic macroinvertebrates and obligate wetland plants (Figure 23). Descriptions and other characteristics of springs are updated every five years.
NPS
Site Condition
In WY2022, we noted slight disturbance of Bulrush Spring by windthrown trees within the channel and over the main orifice. Consistent with WY2021, there were no other natural or human-caused disturbances observed at Bulrush Spring in June of WY2022.
As in the WY2021 visit to Bulrush Spring, we did not observe crayfish or bullfrogs (invasive aquatic animals), nor did we detect any non-native plants.
Consistent with WY2021 observations, we detected four obligate/facultative wetland genera/families at Bulrush Spring in WY2022: bulrush (Scirpus sp.), rushes (Juncaceae), sedges (Cyperaceae), and spikerush (Eleocharis sp.).
Inventory of Rare and Invasive Species and Pathogens
Four water samples were collected from Bulrush Spring on 13 June 2022. None of our target organisms were detected.
Water Quantity
Temperature sensors were deployed for the first time during the WY2022 visit, so there is no estimate of persistence. As in WY2021, discharge was not measurable during the WY2022 visit.
Wetted extent was evaluated using a method for flowing water (Table 14). The total brook length was 20.4 m (66 ft). Width and depth averaged 56.7 cm (22.3 in), and 0.6 cm (0.2 in), respectively—comparable with the wetted extent for this site in WY2021.
Water Quality
Core water quality (Table 15) and water chemistry (Table 16) data were collected at the primary sampling location (a pool located about 18 m below Orifice A) of Bulrush Spring. The values were generally comparable to those recorded at the site in WY2021, although chloride and magnesium were at zero or below the detection limit for the first time in WY2022 (Table 16). pH could not be measured in WY2022 due to a pH probe failure prior to sampling (Table 15).
Bulrush Spring Data Tables
| Measurement | WY2022 Value (range of prior values) |
Prior Years Measured (# of measurements) |
|---|---|---|
| Width (cm) | 56.7 ± 61.5 (27.4) | 2021 (1) |
| Depth (cm) | 0.6 ± 0.4 (1.0) | 2021 (1) |
| Length (m) | 20.4 (21.0) | 2021 (1) |
| Sampling Location | Measurement Location (width, depth) |
Parameter | WY2022 Value (range of prior values) |
Prior Years Measured (# of measurements) |
|---|---|---|---|---|
| 001 | Center | Dissolved oxygen (mg/L) | 4.78 (5.46) |
2021 (1) |
| 001 | Center | pH | cal (6.21) |
2021 (1) |
| 001 | Center | Specific conductivity (µS/cm) | 107.2 (99.0) |
2021 (1) |
| 001 | Center | Temperature (°C) | 20.7 (26.5) |
2021 (1) |
| 001 | Center | Total dissolved solids (mg/L) | 70.0 (64.0) |
2021 (1) |
| Sampling Location | Measurement Location (width, depth) |
Parameter | WY2022 Value (range of prior values) |
Prior Years Measured (# of measurements) |
|---|---|---|---|---|
| 001 | Center | Alkalinity (CaCO3) |
45 (35) | 2021 (1) |
| 001 | Center | Calcium (Ca) |
6 (6) | 2021 (1) |
| 001 | Center | Chloride (Cl) |
0 (9) | 2021 (1) |
| 001 | Center | Magnesium (Mg) |
b.d.l. (6) | 2021 (1) |
| 001 | Center | Potassium (K) |
1.8 (2.1) | 2021 (1) |
| 001 | Center | Sulphate (SO4) |
3 (1) | 2021 (1) |
NPS
WY2022 Findings at Cabin Spring (High Elevation Spring)
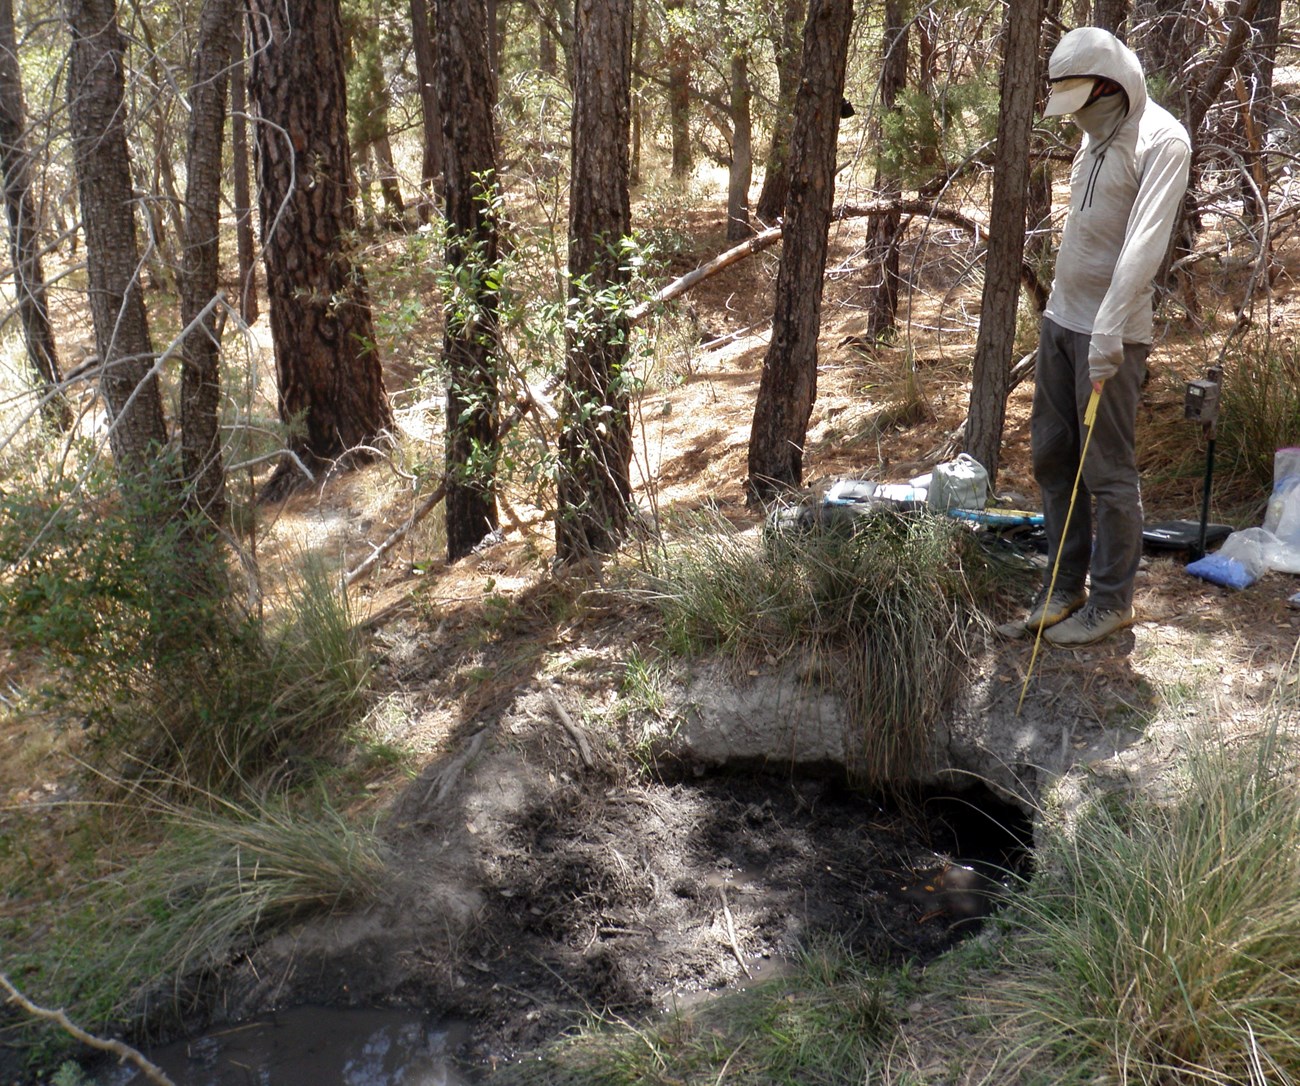
Cabin Spring (Figure 24) is a hillslope spring (spring emerging directly from a hillslope) that supports a 1 x 1.5 m pool at the orifice, and a short (5–8 m) springbrook. The orifice appears to be a former springbox (a structure designed to impound spring water for human use). When last visited and characterized on 13 June 2022, the springbrook was supporting native obligate wetland plants, and the pool had evidence of extensive digging by wildlife, including black bear. There was an additional dry pool (that also appeared to have been a springbox) located about 25 meters upslope. Descriptions and other characteristics of springs are updated every five years.
Site Condition
In WY2022, we rated Cabin Spring as “moderately disturbed” from wildlife use (extensive digging, tracks, and other sign in the pool and springbrook), and “slightly disturbed” for flow modification from the effects of the remnant springbox. These ratings are consistent with WY2021.
Similar to WY2021, we did not observe crayfish or bullfrogs (invasive aquatic animals), nor did we detect any invasive non-native plants at Cabin Spring in WY2022.
As in WY2021, we observed four obligate wetland plant species/genera/families at Cabin Spring in WY2022: rushes (Juncaceae), sedges (Carex sp. and Cyperaceae), and spikerush (Eleocharis sp.).
Inventory of Rare and Invasive Species and Pathogens
Four water samples were collected from Cabin Spring on 13 June 2022. None of our target organisms were detected.
Water Quantity
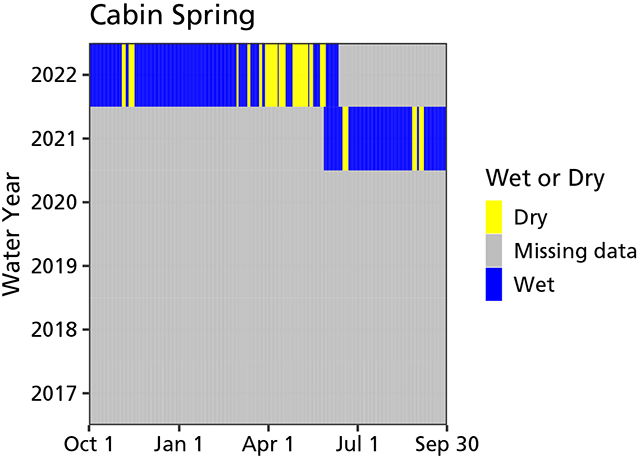
The WY2022 visit occurred on 13 June 2022, and the spring contained water. Temperature sensors indicated that Cabin Spring was wetted (contained water) for 191 of 255 days (74.9% of days) measured up to the WY2022 visit (Figure 25). In prior water years, the spring was wetted 87.2% of the days measured.
NPS
As in 2021, there was no measurable discharge. Wetted extent was evaluated using a method for flowing water. The total brook length was 6.8 m (22 ft). Width and depth averaged 29.6 cm (11.6 in), and 2 cm (0.8 in), respectively. Compared to WY2021, the springbrook was more than twice as long but only about a third the width when observed in WY2022, suggesting wetted extent may be highly dynamic and variable at Cabin Spring (Table 17).
Water Quality
Core water quality (Table 18) data were collected at the primary sampling location at Cabin Spring: the main pool at Orifice A. The pH probe failed post-calibration, so pH data are not available for the June 2022 visit. The values were within the range recorded in prior years, except for specific conductivity and total dissolved solids, which were both about two times higher than observed in WY2021 (Table 18). Water chemistry data could not be collected in WY2022 (Table 19).
Cabin Spring Data Tables
| Measurement | WY2022 Value (range of prior values) |
Prior Years Measured (# of measurements) |
|---|---|---|
| Width (cm) | 29.6 ± 27.1 (62.3) | 2021 (1) |
| Depth (cm) | 2.0 ± 2.6 (1.8) | 2021 (1) |
| Length (m) | 6.8 (2.4) | 2021 (1) |
| Sampling Location | Measurement Location (width, depth) |
Parameter | WY2022 Value (range of prior values) |
Prior Years Measured (# of measurements) |
|---|---|---|---|---|
| 001 | Center | Dissolved oxygen (mg/L) | 1.41 (2.13) |
2021 (1) |
| 001 | Center | pH | cal (6.37) |
2021 (1) |
| 001 | Center | Specific conductivity (µS/cm) | 295.5 (136.9) |
2021 (1) |
| 001 | Center | Temperature (°C) | 22.8 (19.1) |
2021 (1) |
| 001 | Center | Total dissolved solids (mg/L) | 192.0 (89.0) |
2021 (1) |
| Sampling Location | Measurement Location (width, depth) |
Parameter | WY2022 Value (range of prior values) |
Prior Years Measured (# of measurements) |
|---|---|---|---|---|
| 001 | Center | Alkalinity (CaCO3) |
c.n.s. (35) | 2021 (1) |
| 001 | Center | Calcium (Ca) |
c.n.s. (4) | 2021 (1) |
| 001 | Center | Chloride (Cl) |
c.n.s. (0) | 2021 (1) |
| 001 | Center | Magnesium (Mg) |
c.n.s. (b.d.l.) | 2021 (1) |
| 001 | Center | Potassium (K) |
c.n.s. (1.8) | 2021 (1) |
| 001 | Center | Sulphate (SO4) |
c.n.s. (1) | 2021 (1) |
NPS
WY2022 Findings at Dark Spring (High Elevation Spring)
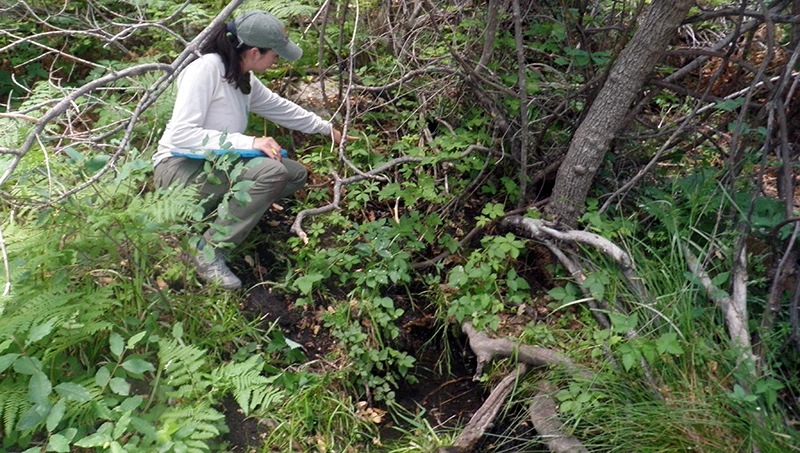
Dark Spring is a hillslope spring (emerges directly from a hillslope) emerging from at least two orifices (Figure 26) that support a pair of parallel, shallow springbrooks with shallow flow down a steep hillslope through a mat of exposed roots. Located on the east slope of the Rincon Mountains above Bear Creek, Dark Spring supports a dense and diverse riparian plant community comprised of sedges and rushes under a thick canopy of box elder, elderberry, black walnut, and Arizona oak trees (Figure 27). When visited and characterized on 12 June 2022, aquatic macroinvertebrates were observed throughout the site, and there were extensive networks of wildlife trails going into and through the site. Descriptions and other characteristics of springs are updated every five years. This was our first sampling of Dark Spring so we do not make comparisons to past results.

NPS
Site Condition
We noted that Dark Spring is "moderately disturbed" from the extensive trails and digging by wildlife through the site. No other natural or human-caused disturbances were noted at Dark Spring in WY2022.
We did not observe crayfish or bullfrogs (invasive aquatic animals), nor did we detect any invasive non-native plants at Dark Spring in WY2022. We did observe several obligate/facultative wetland plants: rushes (Juncaceae), sedges (Carex sp. and Cyperaceae), and spikerush (Eleocharis sp.).
Inventory of Rare and Invasive Species and Pathogens
Four water samples were collected from Dark Spring on 12 June 2022. None of our target organisms were detected, although the presence of biofilms and plant exudates may have greatly reduced the sensitivity of the DNA tests.
Water Quantity
The WY2022 visit occurred on 12 June 2022, and the spring contained water. We deployed temperature sensors at Dark Spring for the first time during this visit, so there is no estimate of persistence. Discharge was estimated at 0.9 (± 0.04) L/min (0.2 ± 0.01 gal/min) in WY2022.
Wetted extent was evaluated using a method for flowing water. The total brook length (of the larger springbrook emanating from Orifice B) was 24 m (79 ft). Width and depth averaged 60.4 cm (23.8 in), and 1.1 cm (0.4 in), respectively.
Water Quality
Core water quality data could not be collected as the water was too shallow for accurate measurements. Using a syringe, we collected water chemistry data from the primary sampling location, a shallow pool about 80 cm downstream from Orifice A (Table 20).
Dark Spring Data Tables
| Sampling Location | Measurement Location (width, depth) |
Parameter | WY2022 Value (range of prior values) |
Prior Years Measured (# of measurements) |
|---|---|---|---|---|
| 001 | Center | Alkalinity (CaCO3) |
35 (n/a) | n/a |
| 001 | Center | 8 | 8 (n/a) | n/a |
| 001 | Center | Chloride (Cl) |
b.d.l. (n/a) | n/a |
| 001 | Center | Magnesium (Mg) |
b.d.l. (n/a) | n/a |
| 001 | Center | Potassium (K) |
7.1 (n/a) | n/a |
| 001 | Center | Sulphate (SO4) |
0 (n/a) | n/a |

NPS
WY2022 Findings at Grass Shack Tinaja (High Elevation Tinaja)
Grass Shack Tinaja is a large tinaja (pool in rock basin or impoundment in bedrock) located near Grass Shack Campground in Chiminea Canyon (Figure 28). Situated at the base of a steep bedrock cliff, Grass Shack Tinaja likely receives both overland flow from the drainage and groundwater from bedrock faults. When observed and characterized on 15 June 2022, Grass Shack Tinaja contained numerous tadpoles, canyon tree frogs, diverse and abundant aquatic macroinvertebrates, and supported a small sward of rush (Juncus sp.). Descriptions and other characteristics of springs are updated every five years. This was the first sampling visit for this location so we cannot make comparisons to past data.
Site Condition
In WY2022, we rated Grass Shack Tinaja as “slightly disturbed” because of the presence of a hiking trail from the nearby campground. Its proximity to Grass Shack Campground and the Manning Camp Trail makes Grass Shack Tinaja an important water source for visitors and park staff traveling through the area. No other natural or human-caused disturbances were observed during the 15 June visit.
We did not observe crayfish or bullfrogs (invasive aquatic animals), nor did we detect any non-native plants in the vicinity of Grass Shack Tinaja. We did observe the obligate wetland plant rush (Juncaceae) growing within the shallows of the pool.
Inventory of Rare and Invasive Species and Pathogens
Four water samples were collected from Grass Shack Tinaja on 15 June 2022. None of our target organisms were detected.
Water Quantity
The WY2022 visit occurred on 15 June 2022, and the spring contained water.
Discharge was not estimated as there was no outflow from the tinaja. Temperature sensors were deployed at Grass Shack Tinaja for the first time during this visit, so there is no estimate of persistence. Wetted extent was not measured due to unsafe access around the steep sides of the tinaja, but a depth of 131 cm was measured at sampling location #2 (the NE edge of the pool). We will investigate potential methods for estimating wetted extent in future visits to Grass Shack Tinaja.
Water Quality
Water quality data could not be collected due to instrument failure. Water chemistry data were collected at the primary sampling location at the south end of Grass Shack Tinaja (Table 21). This was the first visit to Grass Shack Tinaja.
Grass Shack Tinaja Data Tables
| Sampling Location | Measurement Location (width, depth) |
Parameter | WY2022 Value (range of prior values) |
Prior Years Measured (# of measurements) |
|---|---|---|---|---|
| 001 | Center | Alkalinity (CaCO3) |
40 (n/a) | n/a |
| 001 | Center | 8 | 6 (n/a) | n/a |
| 001 | Center | Chloride (Cl) |
1 (n/a) | n/a |
| 001 | Center | Magnesium (Mg) |
b.d.l. (n/a) | n/a |
| 001 | Center | Potassium (K) |
1.6 (n/a) | n/a |
| 001 | Center | Sulphate (SO4) |
24 (n/a) | n/a |

NPS
WY2022 Findings at Italian Spring (High Elevation Spring)
Italian Spring is a hillslope spring (emerges directly from a hillslope) that supports a short and shallow springbrook on the north-facing slope of Mica Mountain. When visited and characterized on 09 June 2022, Italian Spring emerged as a clear pool ringed with sedges and mannagrass (Figure 29). Tadpoles and aquatic macroinvertebrates were abundant in the pool. The shallow springbrook was dry when visited, through it still supported a vigorous growth of sedge and mannagrass. Descriptions and other characteristics of springs are updated every five years.
Site Condition
As in past years, Italian Spring was “moderately disturbed” by nearby hiking trails—the result of its proximity to a major trail junction. No other natural or human-caused disturbances were observed in WY2022. As in past visits, we did not observe crayfish or bullfrogs (non-native invasive aquatic animals), nor did we detect any non-native plants at Italian Spring in WY2022. Consistent with our previous visits, we did observe several obligate/facultative wetland plants in WY2022: fowl mannagrass (Glyceria striata), rush (Juncaceae sp.), and sedge (Carex sp. and Cyperaceae sp.).
Inventory of Rare and Invasive Species and Pathogens
Four water samples were collected from Italian Spring on 09 June 2022. None of our target organisms were detected, although one of the four eDNA samples had reduced sensitivity due to biofilms/plant exudates.
Water Quantity
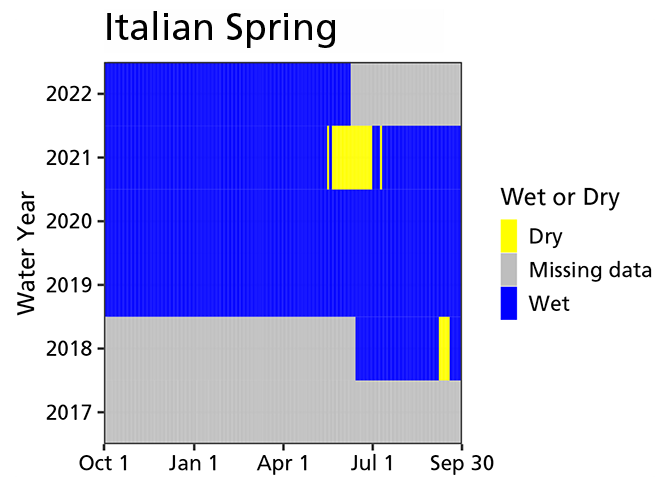
We sampled Italian Spring on 09 June 2022, and the spring contained water. Temperature sensors indicated that Italian Spring was wetted (contained water) for 252 of 252 days (100% of days) measured up to the WY2022 visit (Figure 30). In prior water years, the spring was wetted 87.7–100% of the days measured.
NPS
As in past years, there was no measurable discharge. Wetted extent was evaluated using a method for flowing water. The total brook length was 2 m (7 ft)—only about one fifth the length of the previous lowest measurement at Italian Spring (Table 22). Width and depth averaged 84.4 cm (33.2 in) and 7.8 cm (3.1 in), respectively, comparable with past measurements (Table 22).
Water Quality
Core water quality (Table 23) and water chemistry (Table 24) data were collected at the primary sampling location (western edge of the main pool) of Italian Spring. The values were comparable with the range observed in past years except for water temperature, which was about twice as warm as previously measured at Italian Springs (Table 24).
Italian Spring Data Tables
| Measurement | WY2022 Value (range of prior values) |
Prior Years Measured (# of measurements) |
|---|---|---|
| Width (cm) | 84.4 ± 28.5 (47.7–69.1) | 2018–2020 (3) |
| Depth (cm) | 7.8 ± 2.4 (0.4–3.1) | 2018–2020 (3) |
| Length (m) | 2.0 (10.6–39.0) | 2018–2020 (3) |
| Sampling Location | Measurement Location (width, depth) |
Parameter | WY2022 Value (range of prior values) |
Prior Years Measured (# of measurements) |
|---|---|---|---|---|
| 001 | Center | Dissolved oxygen (mg/L) | 5.41 (7.27) |
2020 (1) |
| 001 | Center | pH | 6.26 (6.46–7.36) |
2018–2020 (2) |
| 001 | Center | Specific conductivity (µS/cm) | 38.2 (48.1–58.7) |
2018–2020 (2) |
| 001 | Center | Temperature (°C) | 18.0 (9.8–10.5) |
2018–2020 (2) |
| 001 | Center | Total dissolved solids (mg/L) | 25.0 (38.4) |
2018 (1) |
| Sampling Location | Measurement Location (width, depth) |
Parameter | WY2022 Value (range of prior values) |
Prior Years Measured (# of measurements) |
|---|---|---|---|---|
| 001 | Center | Alkalinity (CaCO3) |
15 (10–20) | 2018–2020 (3) |
| 001 | Center | Calcium (Ca) |
2 (2–4) | 2018–2020 (3) |
| 001 | Center | Chloride (Cl) |
7 (1–5) | 2018–2020 (3) |
| 001 | Center | Magnesium (Mg) |
0 (b.d.l.–13) | 2018–2020 (3) |
| 001 | Center | Potassium (K) |
1.2 (0.4–0.9) | 2018–2020 (3) |
| 001 | Center | Sulphate (SO4) |
0 (3–4) | 2018–2020 (3) |
NPS
WY2022 Findings at Manna Grass Spring (High Elevation Spring Complex)
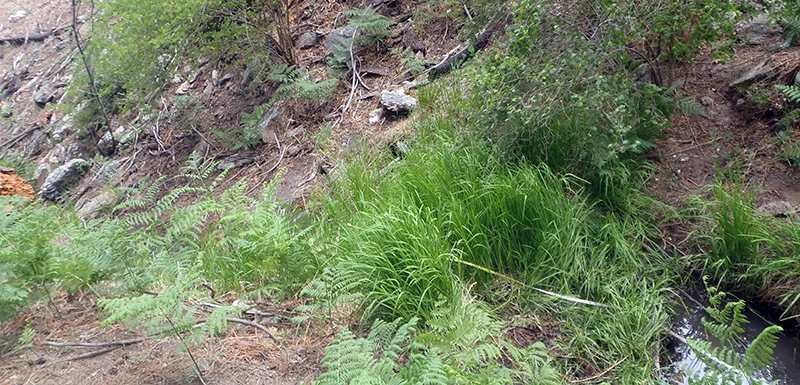
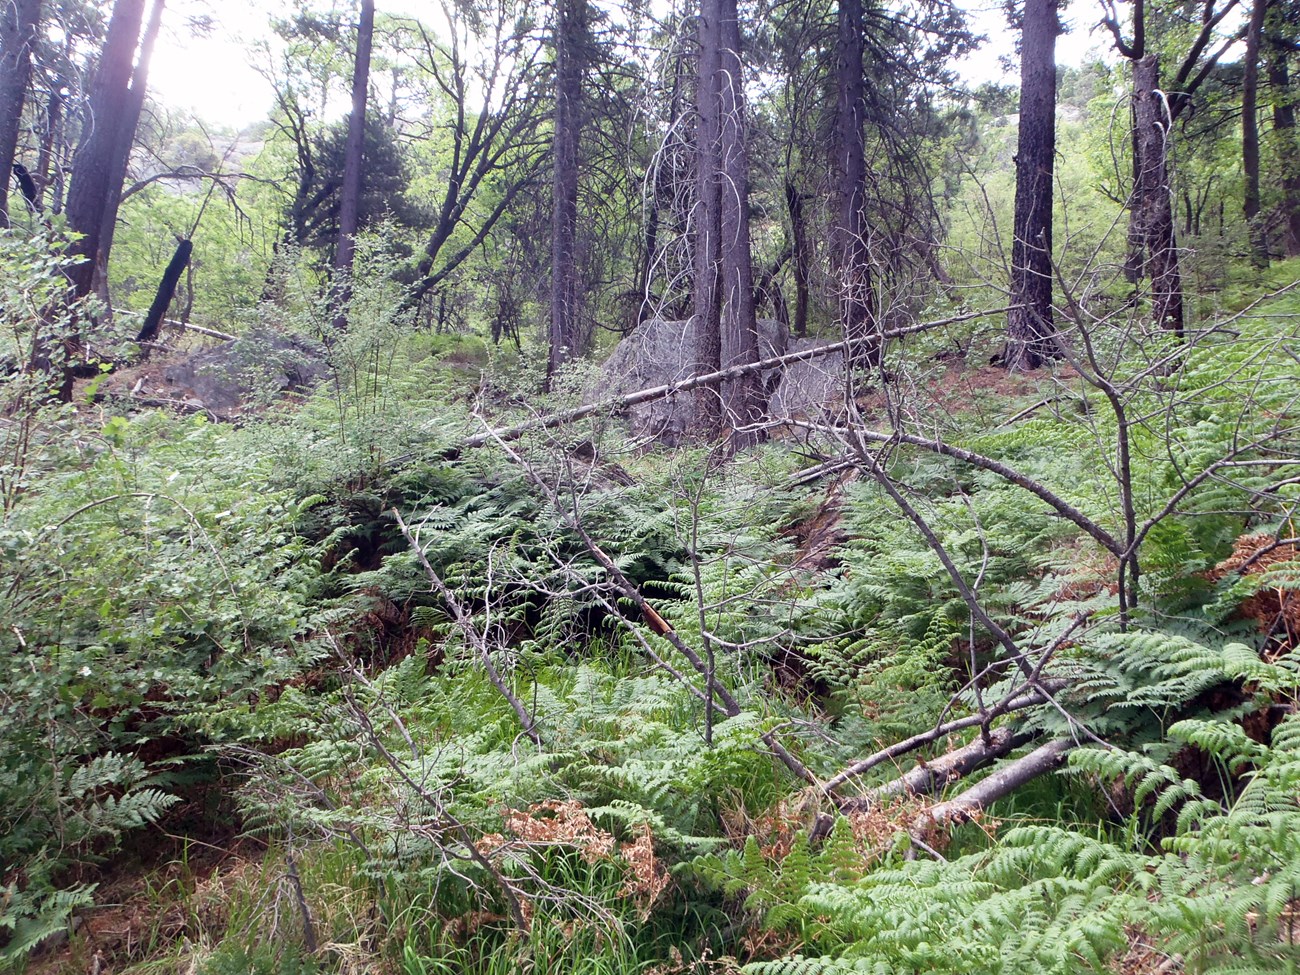
Manna Grass Spring is a rheocrene spring (emerges as a flowing stream) located within a canyon on the north slope of Mica Mountain near Helen’s Dome (Figure 31). The spring is situated in an intact stand of mixed conifer fir and pine forest that remains following the Helen’s 2 Fire in 2006 (Figure 32). Manna Grass Spring consists of a series of small pools and at least two orifices connected by an intermittent springbrook. When visited and characterized on 10 June 2022, Manna Grass Spring supported aquatic macroinvertebrates and dense manna grass, monkeyflower, and sedge. Descriptions and other characteristics of springs are updated every five years.
NPS
Site Condition
As in the previous site visit (WY2021), Manna Grass Spring was rated “slightly disturbed” by fire (fire scars on trees within the site), and windthrow (downed trees within the springbrook). There were no other natural or human-caused disturbances at Manna Grass Spring observed in WY2022.
Consistent with WY2021, we did not observe crayfish or bullfrogs (non-native invasive aquatic animals) at Manna Grass spring. However, the non-native forb sweetclover (Melilotus sp.) was detected for the first time at this site in WY2022, and the invasive grass Kentucky bluegrass (Poa pratensis) was documented for the second year in a row at Manna Grass Spring.
As in WY2021, we observed several obligate wetland plants at Manna Grass Spring in 2022: fowl manna grass (Glyceria striata), monkeyflower (Mimulus sp.), and sedge (Carex sp. and Cyperaceae).
Inventory of Rare and Invasive Species and Pathogens
Four water samples were collected from Manna Grass Springs on 10 June 2022. None of our target organisms were detected at Manna Grass Springs, although all four eDNA samples had reduced sensitivity due to biofilms/plant exudates.
Water Quantity
The WY2022 visit occurred on 10 June 2022, and the spring contained water. Unlike the previous visit in WY2021, discharge could not be estimated at Manna Grass Spring in WY2022 because there was negligible surface flow (Table 25). Temperature sensors were deployed at Manna Grass Spring for the first time during the WY2022 visit, so there is no estimate of persistence.
Wetted extent was evaluated using a method for flowing water. The total brook length was 16 m (52 ft)—less than half the extent measured in WY2021 (Table 26). Width and depth averaged 30.7 cm (12.1 in) and 0.3 cm (0.1 in), respectively, which was comparable to the WY2021 visit.
Water Quality
Core water quality (Table 27) and water chemistry (Table 28) data were collected at the primary sampling location of Manna Grass Spring: the largest pool (about 1 x 5 m) located downstream of orifices A and B. Dissolved oxygen, specific conductance, and total dissolved solids were slightly lower than measured in WY2021 (Table 27), as were alkalinity, calcium, chloride, and magnesium (Table 28).
Manna Grass Spring Data Tables
Sampling Location |
WY2022 Value (range of prior values) | Prior Years Measured (# of measurements) |
|---|---|---|
| 003 | c.n.s. (0.3) | 2021 (1) |
| Measurement | WY2022 Value (range of prior values) |
Prior Years Measured (# of measurements) |
|---|---|---|
| Width (cm) | 30.7 ± 30.0 (21.5) | 2021 (1) |
| Depth (cm) | 0.3 ± 0.4 (0.1) | 2021 (1) |
| Length (m) | 15.9 (39.3) | 2021 (1) |
| Sampling Location | Measurement Location (width, depth) |
Parameter | WY2022 Value (range of prior values) |
Prior Years Measured (# of measurements) |
|---|---|---|---|---|
| 001 | Center | Dissolved oxygen (mg/L) | 5.34 (8.31) |
2021 (1) |
| 001 | Center | pH | 7.04 (7.52) |
2021 (1) |
| 001 | Center | Specific conductivity (µS/cm) | 103.2 (121.5) |
2021 (1) |
| 001 | Center | Temperature (°C) | 11.6 (8.3) |
2021 (1) |
| 001 | Center | Total dissolved solids (mg/L) | 67.0 (79.0) |
2021 (1) |
| Sampling Location | Measurement Location (width, depth) |
Parameter | WY2022 Value (range of prior values) |
Prior Years Measured (# of measurements) |
|---|---|---|---|---|
| 001 | Center | Alkalinity (CaCO3) |
50 (65) | 2021 (1) |
| 001 | Center | Calcium (Ca) |
6 (12) | 2021 (1) |
| 001 | Center | Chloride (Cl) |
b.d.l. (5) | 2021 (1) |
| 001 | Center | Magnesium (Mg) |
b.d.l. (7) | 2021 (1) |
| 001 | Center | Potassium (K) |
1.8 (0.7) | 2021 (1) |
| 001 | Center | Sulphate (SO4) |
4 (0) | 2021 (1) |
NPS
WY2022 Findings at Manning Spring (High Elevation Spring)
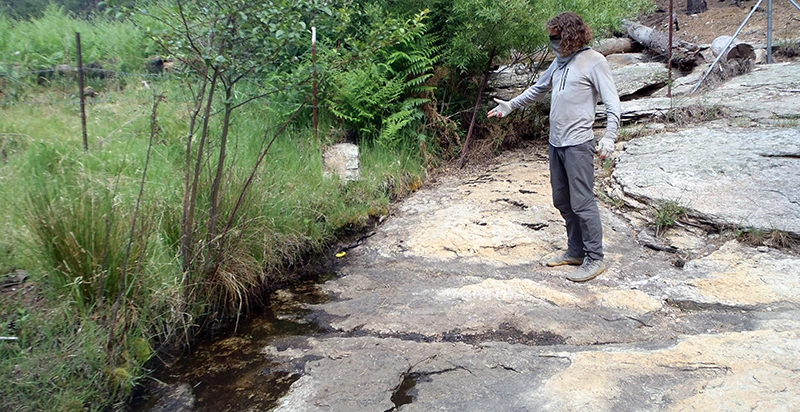
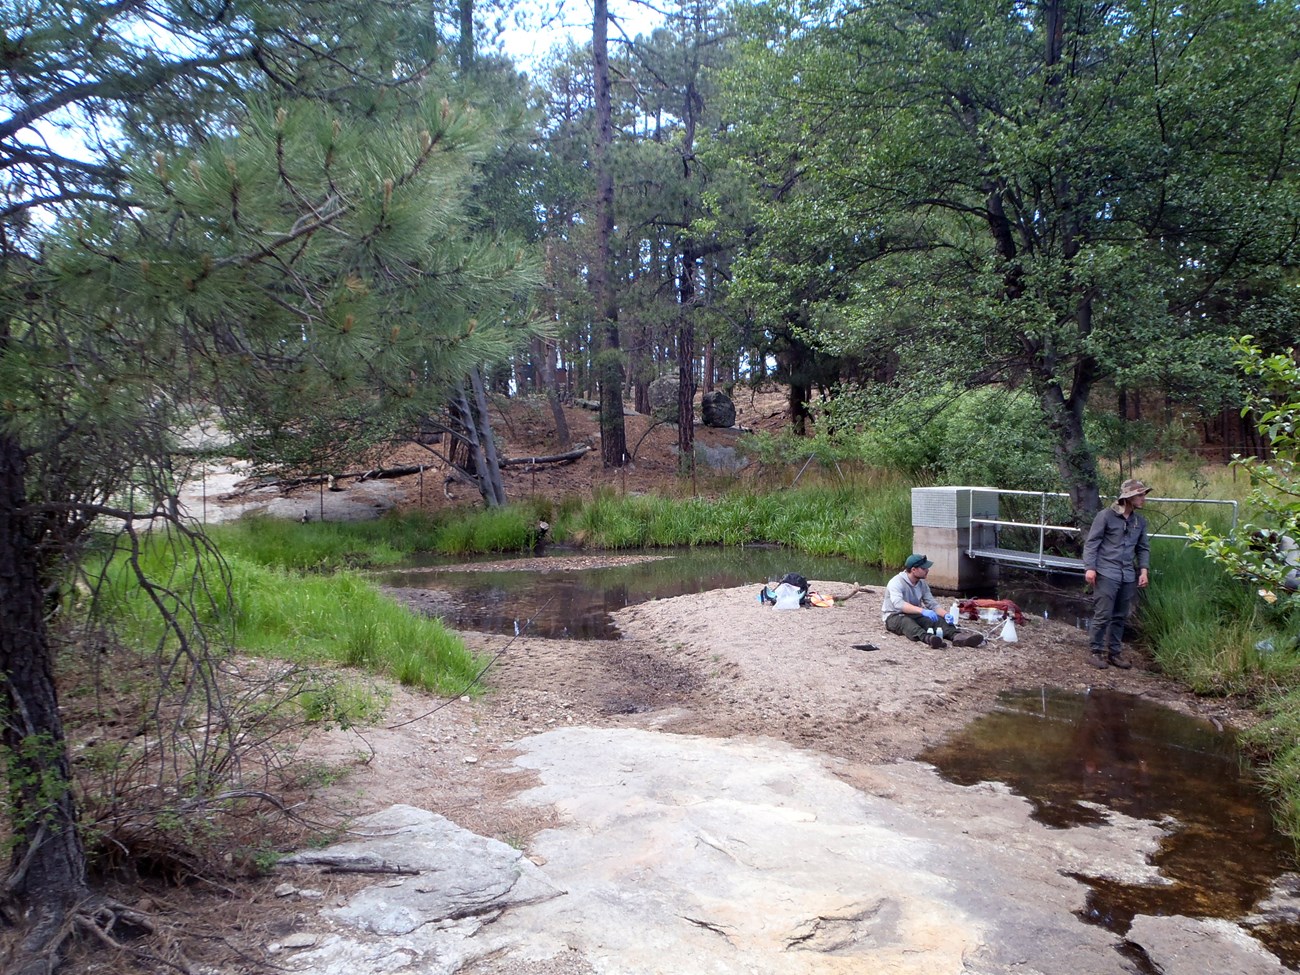
Manning Spring is a limnocrene spring (emerges as one or more still pools) located within a few hundred meters of Manning Camp in upper Chiminea Canyon. When sampled and characterized on 10 June 2022, Manning Spring contained a diverse aquatic macroinvertebrate community and supported a ring of willow and alder trees with a dense understory of sedges and rushes (Figure 33). A rock wall and springbox with pump have been added to the pool to create a reservoir of water that is treated and used to support Manning Campground and park operations at Manning Camp (Figure 34). Descriptions and other characteristics of springs are updated every five years.
NPS
Site Condition
As in all previous visits to Manning Spring, we rated the site as “highly disturbed” by flow modification (the dam, springbox, and pump), and “slightly disturbed” due to the access trail and nearby hiking trails. These trails or the nearby livestock corral may be the source of the invasive Kentucky bluegrass (Poa pratensis) that has been consistently encountered at Manning Spring. There were no other observed natural or human-caused disturbances of Manning Spring in WY2022.
As in previous visits, we did not observe crayfish or bullfrogs (non-native invasive aquatic animals) at Manning Spring in WY2022. However, we detected scattered patches of the invasive grass Kentucky bluegrass around the edge of the spring, as we have since WY2020.
As we’ve consistently documented since monitoring started in WY2018, we detected several obligate wetland plants at Manning Spring in WY2022: bulrush (Scirpus sp.), monkeyflower (Mimulus sp.), rush (Juncaceae), sedge (Carex sp.), and willow (Salix sp.).
Inventory of Rare and Invasive Species and Pathogens
Four water samples were collected from Manning Spring on 10 June 2022. None of our target organisms were detected.
Water Quantity
The WY2022 visit occurred on 10 June 2022, and the spring contained water. Temperature sensors indicated that Manning Camp Reservoir was wetted (contained water) for 253 of 253 days (100% of days) measured up to the WY2022 visit (Figure 35). In prior water years, the spring was wetted 98.9–100% of the days measured.

NPS
Discharge was not measured and has not been measured in the past because there has been no outflow over the dam during the sampling months (May–June) since we started monitoring Manning Spring in 2018.
Wetted extent was evaluated using a method for standing water. Width averaged 863.3 cm (339.9 in), and length averaged 1003.7 cm (395.1 in)—on the lower end of the range of previous extent measures for Manning Spring (Table 29). Depth was not measured as it would have required entering—and potentially contaminating—the spring, which provides drinking water for Manning Camp and Manning Campground.
Water Quality
Core water quality data (Table 30) and water chemistry (Table 31) data were collected at the primary sampling location (center of the dam) of Manning Spring. Alkalinity was slightly higher than previously observed. All other values were comparable with past values measured at Manning Spring.
Manning Spring Data Tables
| Measurement | WY2022 Value (range of prior values) |
Prior Years Measured (# of measurements) |
|---|---|---|
| Width (m) | 8.6 ± 4.3 (8.7–14.0) | 2018–2021 (4) |
| Depth (cm) | c.n.s. (c.n.s.) | 2018–2021 (4) |
| Length (m) | 10.0 ± 2.2 (10.6–17.5) | 2018–2021 (4) |
| Sampling Location | Measurement Location (width, depth) |
Parameter | WY2022 Value (range of prior values) |
Prior Years Measured (# of measurements) |
|---|---|---|---|---|
| 001 | Center | Dissolved oxygen (mg/L) | 5.81 (5.45) |
2020 (1) |
| 001 | Center | pH | 6.28 (5.98–7.23) |
2018–2020 (2) |
| 001 | Center | Specific conductivity (µS/cm) | 47.2 (44.7–53.0) |
2018–2020 (2) |
| 001 | Center | Temperature (°C) | 21.4 (19.1–21.1) |
2018–2020 (2) |
| 001 | Center | Total dissolved solids (mg/L) | 31.0 (34.5) |
2018 (1) |
| Sampling Location | Measurement Location (width, depth) |
Parameter | WY2022 Value (range of prior values) |
Prior Years Measured (# of measurements) |
|---|---|---|---|---|
| 001 | Center | Alkalinity (CaCO3) |
50 (15–30) | 2018–2021 (3) |
| 001 | Center | Calcium (Ca) |
8 (2–8) | 2018–2021 (3) |
| 001 | Center | Chloride (Cl) |
1 (0–2) | 2018–2021 (3) |
| 001 | Center | Magnesium (Mg) |
1 (b.d.l.–4) | 2018–2021 (3) |
| 001 | Center | Potassium (K) |
1.9 (0.3–1.2) | 2018–2021 (3) |
| 001 | Center | Sulphate (SO4) |
6 (0–3) | 2018–2021 (3) |
NPS
WY2022 Findings at Mica Meadows Trail Seep 1 (High Elevation Spring)
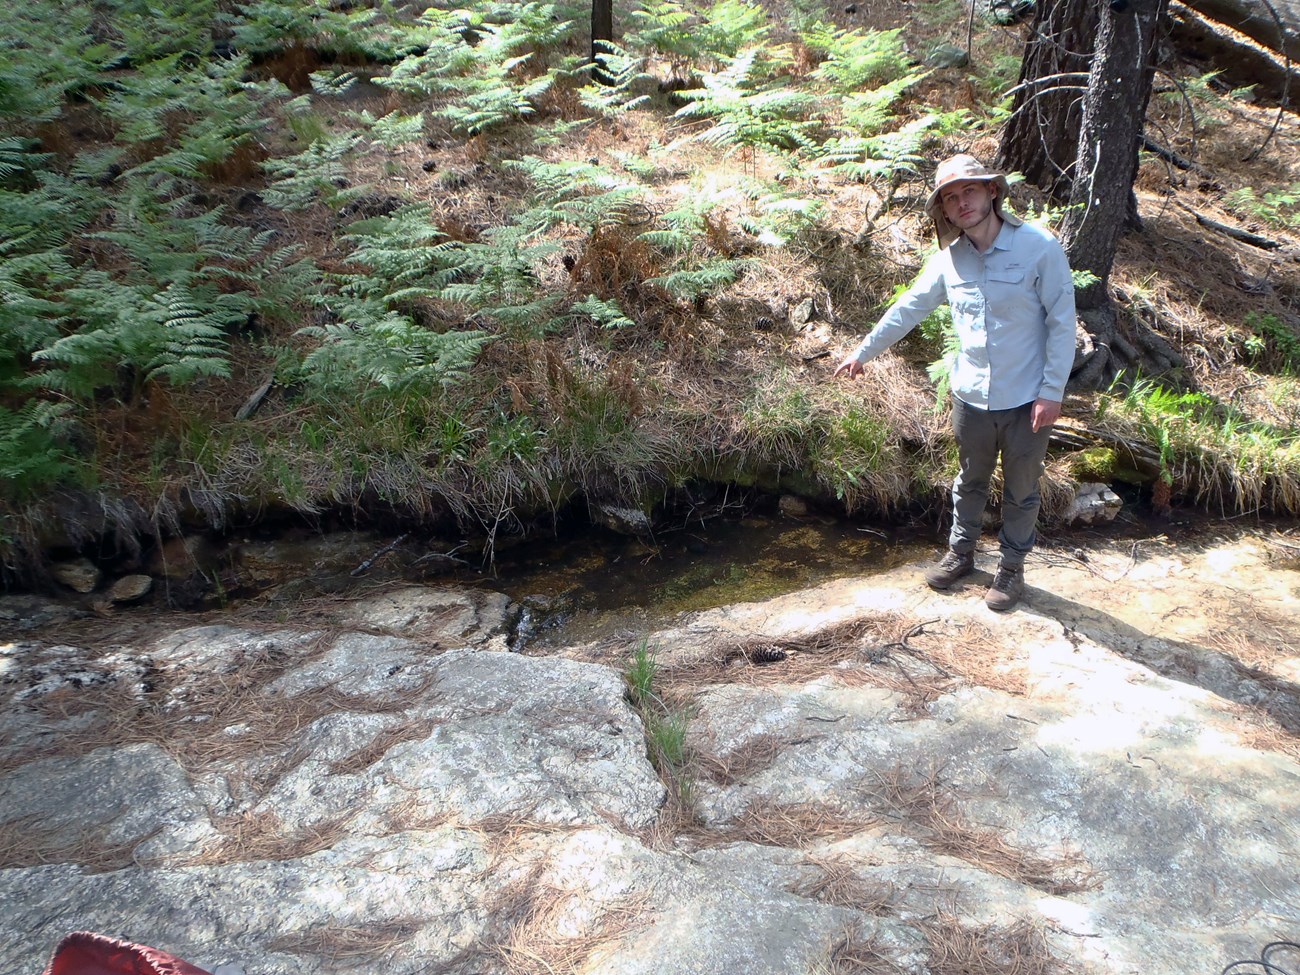
Mica Meadows Trail Seep 1 is a rheocrene spring (emerges as a flowing stream) located within Mica Bowl on the south flank of Mica Mountain (Figure 36). The orifice supports two medium (0.5 x 1 m) and one larger (about 2 x 4 m) bedrock pools connected by a shallow springbrook. When sampled and characterized on 11 June 2022, Mica Meadows Trail Seep 1 was cool and clear with abundant terrestrial and aquatic macroinvertebrates. Descriptions and other characteristics of springs are updated every five years.
Site Condition
In WY2022, we rated Mica Meadows Trail Seep 1 as “slightly disturbed” due to past fire, as evidenced by fire scars on the trees in and around the springbrook, and windthrow, as several downed trees crossed the lower portion of the site. No other human-caused or natural disturbances of Mica Meadows Trail Seep 1 were observed.
As in all previous visits, we did not detect crayfish or bullfrogs (non-native invasive aquatic animals) during the June 2022 sampling. However, we observed the invasive exotic sweetclover (Melilotus sp.) for the first time in WY2022 in scattered patches along the edges of the springbrook.
Consistent with past years, we observed a variety of sedges and rushes (Carex sp., Juncaceae, and Cyperaceae) along the springbrook and the pool edges at Mica Meadows Trail Seep 1 in WY2022, and for the first time, we observed monkeyflower (Mimulus sp.) at this site. No other obligate or facultative riparian plant species were detected.
Inventory of Rare and Invasive Species and Pathogens
Four water samples were collected from Mica Meadows Trail Seep 1 on 11 June 2022. None of our target organisms were detected.
Water Quantity
The WY2022 visit occurred on 11 June 2022, and the spring contained water. However, discharge could not be measured in WY2022 due to negligible surface flow (Table 32).
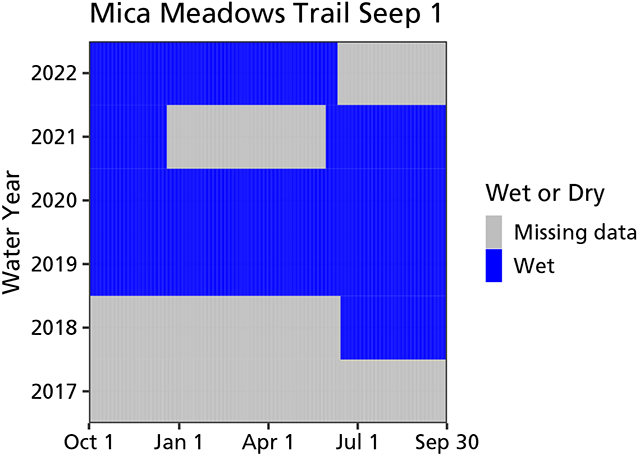
Temperature sensors indicated that Mica Meadows Trail Seep 1 was wetted (contained water) for 254 of 254 days (100% of days) measured up to the WY2022 visit (Figure 37). In prior water years, the spring was wetted 100% of the days measured.
NPS
Wetted extent was evaluated using a method for flowing water. The total brook length was 5.3 m (16 ft), and width and depth averaged 40.2 cm (15.8 in), and 2.7 cm (1 in), respectively—all on the lower end of the range of previous wetted extent measures for Mica Meadows Trail Seep 1 (Table 33).
Water Quality
Core water quality (Table 34) and water chemistry (Table 35) data were collected at the primary sampling location (a 1 x 2 m pool located at Orifice A) at Mica Meadows Trail Seep 1. Water temperature, calcium, and potassium were slightly higher than previously observed. All other parameters were comparable with values observed in the past.
Mica Meadows Trail Seep 1 Data Tables
| Sampling Location | WY2022 Value (range of prior values) | Prior Years Measured (# of measurements) |
|---|---|---|
| 002 | c.n.s. (5.3) | 2019 (1) |
| Measurement | WY2022 Value (range of prior values) |
Prior Years Measured (# of measurements) |
|---|---|---|
| Width (cm) | 40.2 ± 45.2 (42.4–174.8) | 2018–2020 (3) |
| Depth (cm) | 2.7 ± 3.4 (2.0–6.2) | 2018–2020 (3) |
| Length (m) | 5.3 (1.4–18.0) | 2018–2020 (3) |
| Sampling Location | Measurement Location (width, depth) |
Parameter | WY2022 Value (range of prior values) |
Prior Years Measured (# of measurements) |
|---|---|---|---|---|
| 001 | Center | Dissolved oxygen (mg/L) | 2.85 (3.65) |
2020 (1) |
| 001 | Center | pH | 6.06 (5.44–7.15) |
2018–2020 (2) |
| 001 | Center | Specific conductivity (µS/cm) | 64.1 (57.7–81.4) |
2018–2020 (2) |
| 001 | Center | Temperature (°C) | 13.0 (9.9–11.5) |
2018–2020 (2) |
| 001 | Center | Total dissolved solids (mg/L) | 42.0 (56.6) |
2018 (1) |
| Sampling Location | Measurement Location (width, depth) |
Parameter | WY2022 Value (range of prior values) |
Prior Years Measured (# of measurements) |
|---|---|---|---|---|
| 001 | Center | Alkalinity (CaCO3) |
20 (15–20) | 2018–2020 (2) |
| 001 | Center | Calcium (Ca) |
4 (0–4) | 2018–2020 (2) |
| 001 | Center | Chloride (Cl) |
17 (0–14) | 2018–2020 (2) |
| 001 | Center | Magnesium (Mg) |
b.d.l. (b.d.l.–9) | 2018–2020 (2) |
| 001 | Center | Potassium (K) |
5.8 (2.4–2.6) | 2018–2020 (2) |
| 001 | Center | Sulphate (SO4) |
0 (0–5) | 2018–2020 (2) |
NPS
WY2022 Findings at Mud Hole Spring (High Elevation Spring)
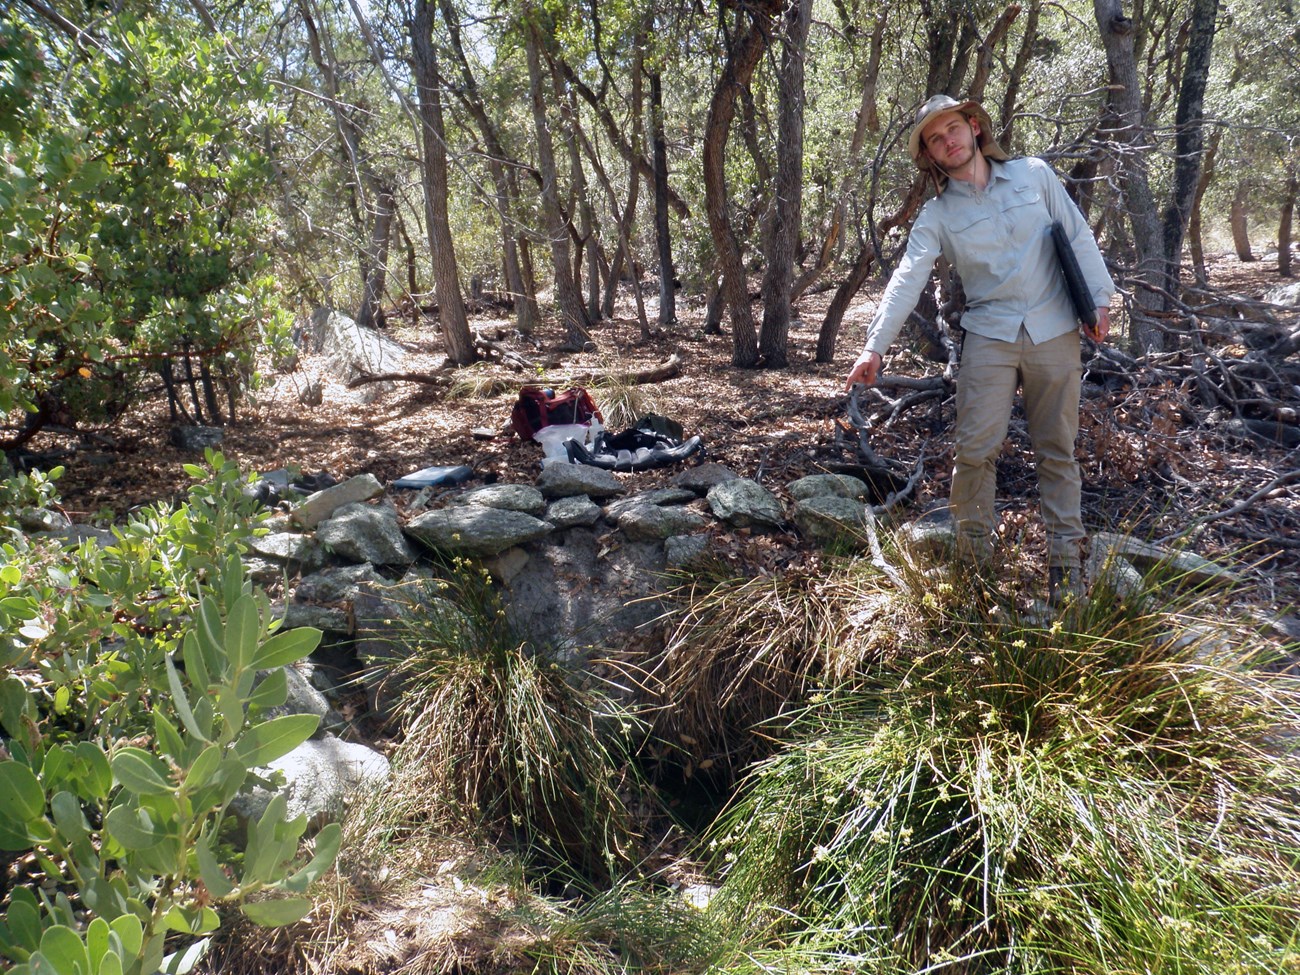
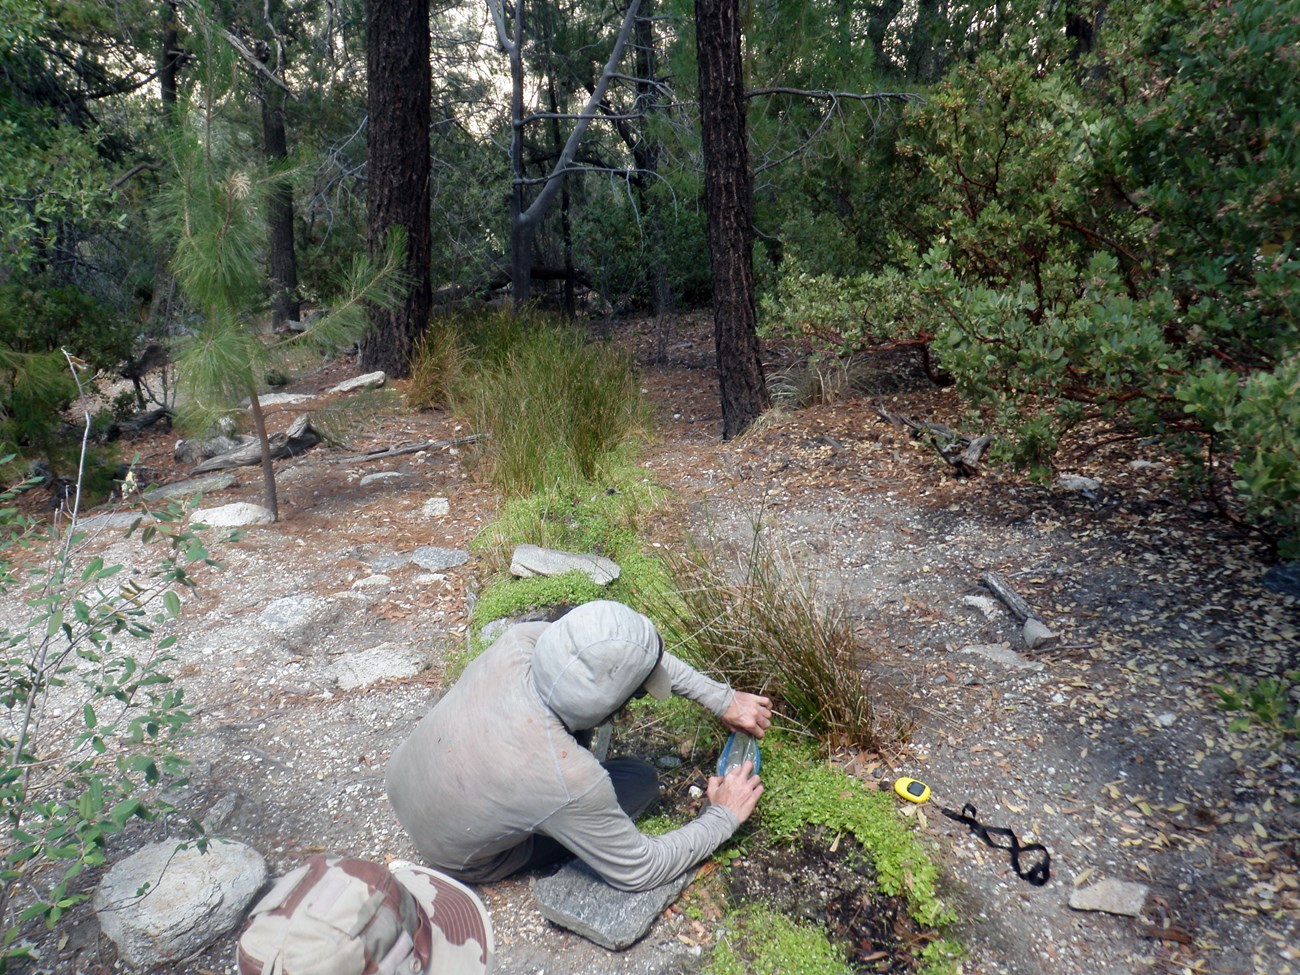
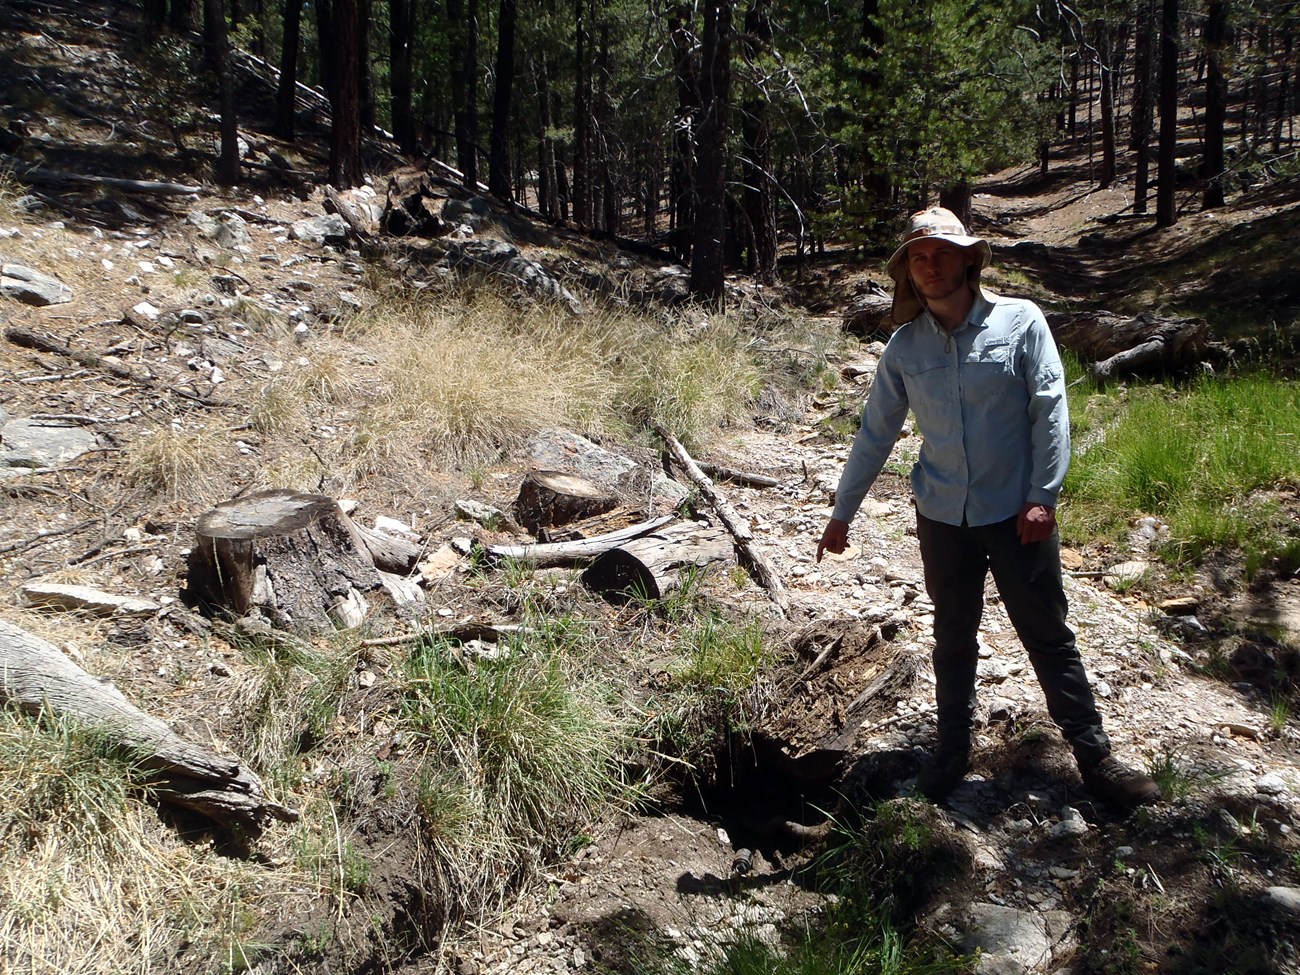
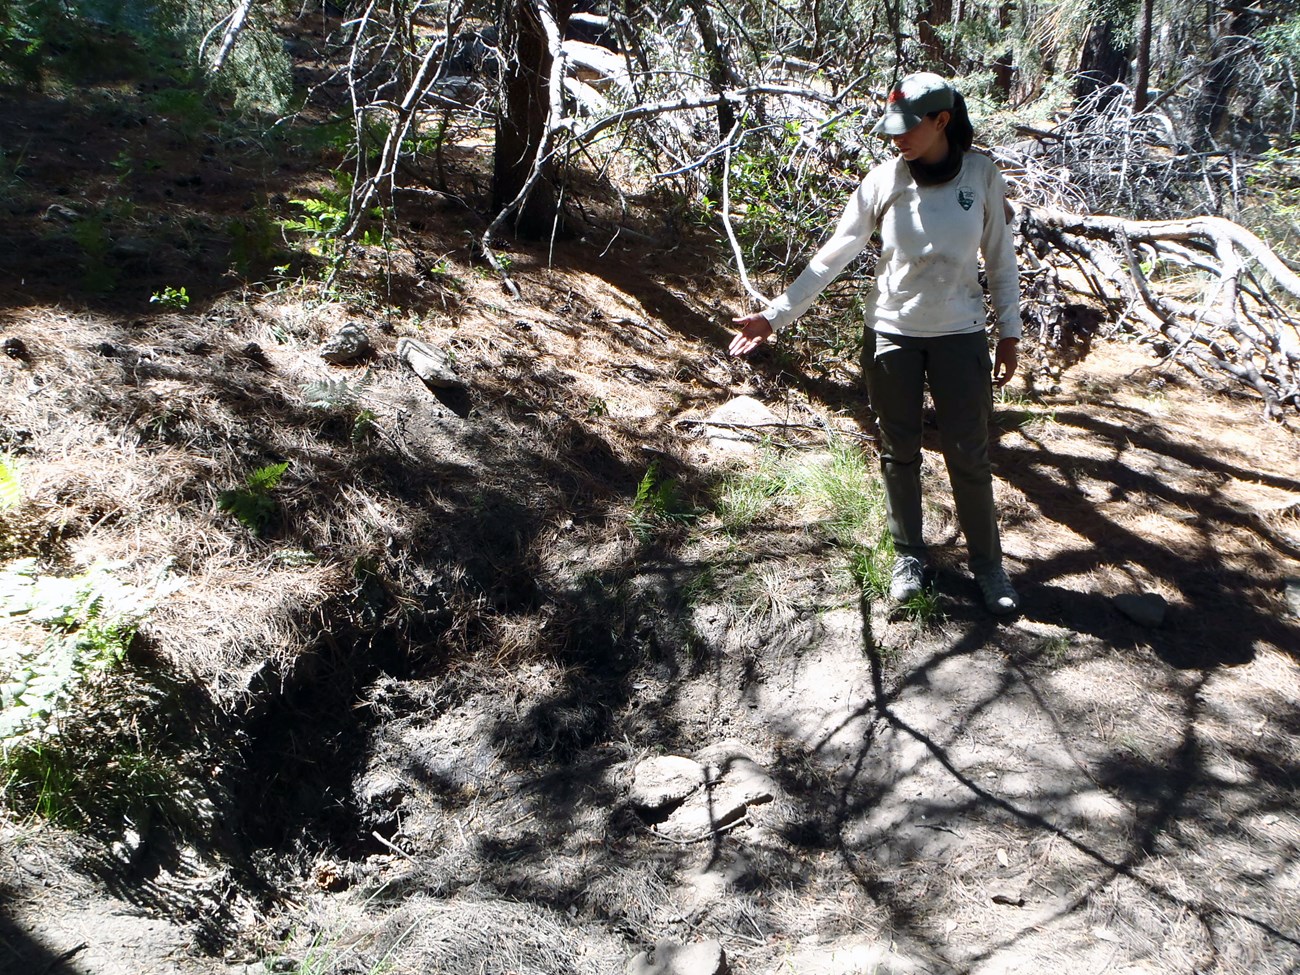
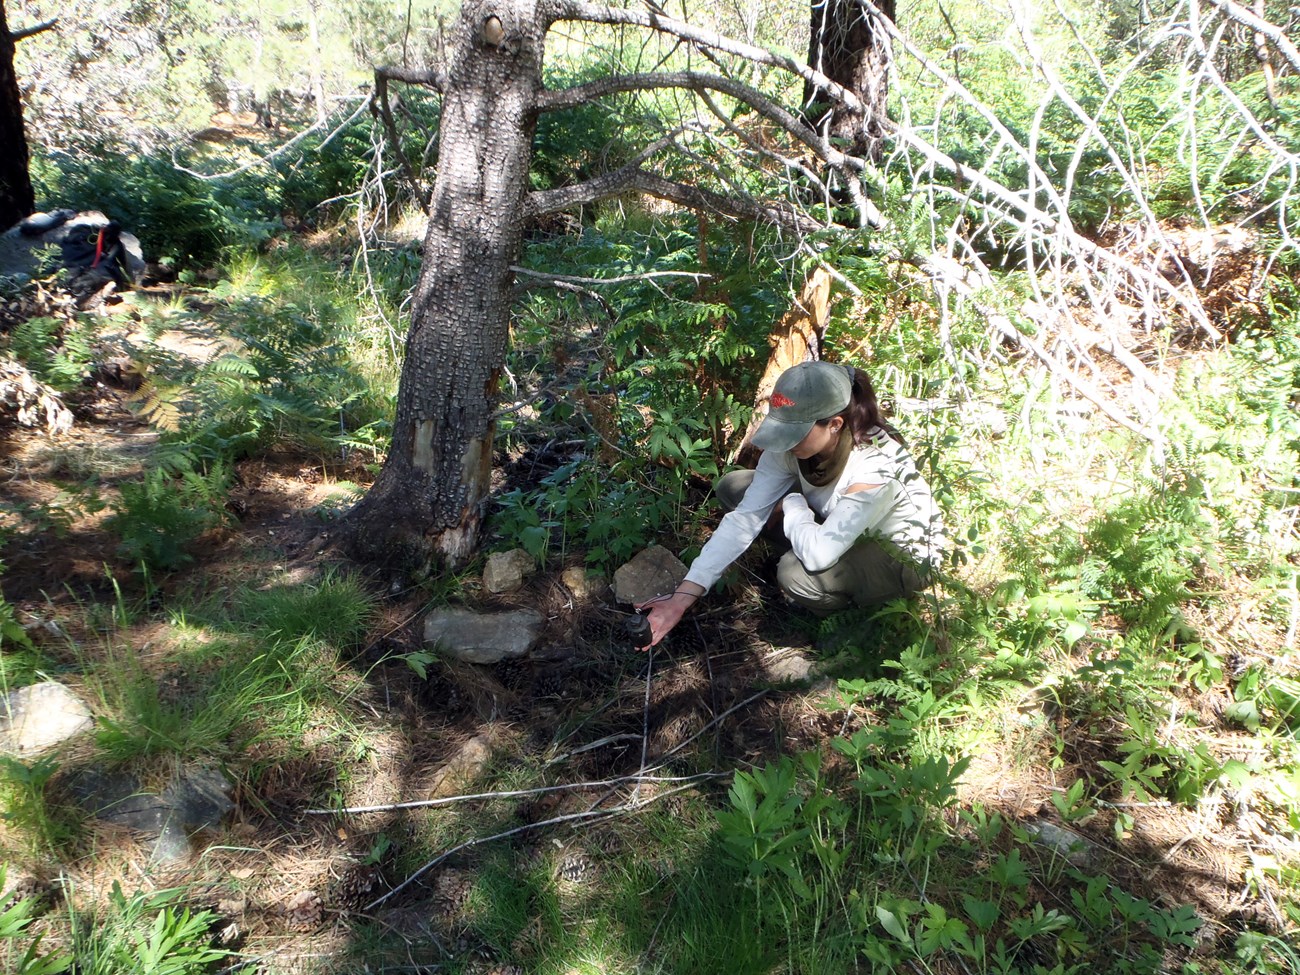
Mud Hole Spring is a hillslope spring (emerges directly from a hillslope) that supports a shallow springbrook adjacent to the Turkey Creek Trail on the eastern slope of the Rincon Mountains. When visited and described on 12 June 2022, Mud Hole Spring emerged into a small (1 x 2 m) rock-lined pool (Figure 38) that fed a narrow channel ringed with sedges and other aquatic plants (Figure 39). Descriptions and other characteristics of springs are updated every five years.
NPS
Site Condition
In WY2022, we rated Mud Hole Spring as “moderately disturbed” from the presence of the nearby Turkey Creek Trail, and the web of social trails leading to the spring for water use by hikers and backpackers. Digging, tracks, and other wildlife use of the spring resulted in a “slightly disturbed” rating as well, particularly in the area in and around the main pool. No other human-caused or natural disturbances were noted.
As in all past visits to Mud Hole Spring, we did not observe crayfish or bullfrogs (non-native invasive aquatic animals), nor did we detect any non-native plants at Mud Hole Spring in WY2022.
Consistent with all prior sampling, we observed rushes (Juncaceae sp.) and spikerush (Eleocharis sp.) lining the main pool and springbrook during our June 2022 visit. No other obligate or facultative riparian plants were detected.
Inventory of Rare and Invasive Species and Pathogens
Four water samples were collected from Mud Hole Spring on 12 June 2022. None of our target organisms were detected, although the presence of biofilms and plant exudates in all four samples may have reduced the sensitivity of the DNA tests.
Water Quantity
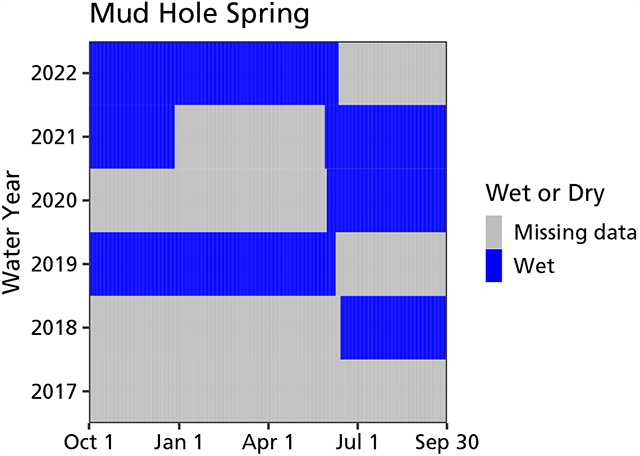
When we sampled Mud Hole Spring on 12 June 2022, the spring contained water. Temperature sensors indicated that Mud Hole Spring was wetted (contained water) for 255 of 255 days (100% of days) measured up to the WY2022 visit (Figure 40). In prior water years, the spring was wetted 100% of the days measured.
NPS
Discharge was estimated at 0.400 (± 0.005) liters (0.100 ± 0.001 gal) per minute in WY2022, comparable to previous measurements (Table 36).
Wetted extent was evaluated using a method for flowing water at Mud Hole Spring. The total brook length was about 12 m (39 ft), and width and depth averaged 19.2 cm (7.6 in), and 1.3 cm (0.5 in), respectively—comparable to the wetted extent measures from previous years (Table 37).
Water Quality
Core water quality data (Table 38) and water chemistry (Table 39) were collected at the primary sampling location (the main pool located at the orifice) of Mud Hole Spring. Alkalinity and potassium (Table 39) were slightly higher than previously measured at the spring. All other parameters were comparable with the range of values recorded in prior years (Tables 38 and 39).
Mud Hole Spring Data Tables
| Sampling Location | WY2022 Value (range of prior values) | Prior Years Measured (# of measurements) |
|---|---|---|
| 002 | 0.400 ± 0.005 (0.200–0.300) | 2018–2021 (4) |
| Measurement | WY2022 Value (range of prior values) |
Prior Years Measured (# of measurements) |
|---|---|---|
| Width (cm) | 19.2 ± 19.4 (19.7–37.4) | 2018–2021 (4) |
| Depth (cm) | 1.3 ± 2.5 (0.6–2.0) | 2018–2021 (4) |
| Length (m) | 11.5 (9.0–11.9) | 2018–2021 (4) |
| Sampling Location | Measurement Location (width, depth) |
Parameter | WY2022 Value (range of prior values) |
Prior Years Measured (# of measurements) |
|---|---|---|---|---|
| 001 | Center | Dissolved oxygen (mg/L) | 2.48 (3.21–4.63) |
2020–2021 (2) |
| 001 | Center | pH | 6.59 (6.36–7.29) |
2018–2021 (3) |
| 001 | Center | Specific conductivity (µS/cm) | 173.4 (166.4–174.4) |
2018–2021 (3) |
| 001 | Center | Temperature (°C) | 17.3 (14.2–16.3) |
2018–2021 (3) |
| 001 | Center | Total dissolved solids (mg/L) | 113.0 (108.0–113.1) |
2018–2021 (2) |
| Sampling Location | Measurement Location (width, depth) |
Parameter | WY2022 Value (range of prior values) |
Prior Years Measured (# of measurements) |
|---|---|---|---|---|
| 001 | Center | Alkalinity (CaCO3) |
110 (75–95) | 2018–2021 (3) |
| 001 | Center | Calcium (Ca) |
8 (8–10) | 2018–2021 (3) |
| 001 | Center | Chloride (Cl) |
b.d.l. (4–16) | 2018–2021 (3) |
| 001 | Center | Magnesium (Mg) |
b.d.l. (b.d.l.–9) | 2018–2021 (3) |
| 001 | Center | Potassium (K) |
7.0 (1.0–1.9) | 2018–2021 (3) |
| 001 | Center | Sulphate (SO4) |
0 (0–6) | 2018–2021 (3) |
NPS
WY2022 Findings at New Spring 3 (High Elevation Spring)
New Spring 3 is a rheocrene spring (emerges as a flowing stream) located in the upper watershed of Chiminea Canyon. The spring orifice is a 1.0 x 0.5 m pool that was dry (Figure 41) when last visited and sampled on 11 June 2022. When water is present, the orifice feeds a narrow springbrook that drops down a steep bedrock face into a second, larger pool (about 2 x 2 m). Descriptions and other characteristics of springs are updated every five years.
Site Condition
In WY2022, we rated New Spring 3 as “highly disturbed” from recent flooding, as evidenced by the thick layers of fresh sediment throughout the springbrook, with about 30 cm of fresh deposition in the orifice (Figure 41). New Spring 3 was also rated “highly disturbed” from drying, as the orifice and springbrook were entirely dry. We also rated the spring as “slightly disturbed” by the influence of the Fire Loop Trail (a segment of the popular Arizona Trail), which runs parallel to the springbrook. No other natural or human-caused disturbances were noted at New Spring 3 during the WY2022 visit.
As in previous visits to New Spring 3, we did not observe crayfish or bullfrogs (non-native invasive aquatic animals). However, the invasive forb sweetclover (Melilotus sp.) was observed in scattered patches at New Spring 3 for the first time in WY2022. As in all past visits, a few individuals of the invasive grass Kentucky bluegrass (Poa pratensis) were observed in WY2022.
Despite the lack of surface water, several obligate and facultative wetland plants were observed at New Spring 3 in WY2022, as in all previous visits to this spring: monkeyflower (Mimulus sp.), rush (Juncaceae), and sedge (Carex sp. and Cyperaceae).
Inventory of Rare and Invasive Species and Pathogens
As New Spring 3 was completely dry during the June 2022 visit, we were unable to collect eDNA samples because they are filtered from spring water. We will attempt to collect eDNA samples in future visits to this spring.
Water Quantity
The WY2022 visit occurred 11 June 2022, and the spring was dry. The water temperature sensor was buried in 30 cm of dry sediment, suggesting that the water estimate became unreliable at an unknown date during the period from June 2021–June 2022. In prior water years, the spring was wetted 80.4–90.6% of the days measured (Figure 42).
Water Quality
Core water quality and water chemistry data could not be collected in WY2022 as the site was dry. Data from past years are shown in Tables 42 and 43.
New Spring 3 Data Tables
| Sampling Location | WY2022 Value (range of prior values) | Prior Years Measured (# of measurements) |
|---|---|---|
| 003 | c.n.s. (0.2–0.4) | 2019–2020 (2) |
| Measurement | WY2022 Value (range of prior values) |
Prior Years Measured (# of measurements) |
|---|---|---|
| Width (cm) | c.n.s. (44.1–46.7) | 2019–2020 (2) |
| Depth (cm) | c.n.s. (0.1–1.1) | 2019–2020 (2) |
| Length (m) | c.n.s. (16.6–19.0) | 2019–2020 (2) |
| Sampling Location | Measurement Location (width, depth) |
Parameter | WY2022 Value (range of prior values) |
Prior Years Measured (# of measurements) |
|---|---|---|---|---|
| 001 | Center | Dissolved oxygen (mg/L) | c.n.s. (1.23) |
2020 (1) |
| 001 | Center | pH | c.n.s. (5.58) |
2020 (1) |
| 001 | Center | Specific conductivity (µS/cm) | c.n.s. (53.6) |
2020 (1) |
| 001 | Center | Temperature (°C) | c.n.s. (13.9) |
2020 (1) |
| 001 | Center | Total dissolved solids (mg/L) | c.n.s. (c.n.s.) |
c.n.s. |
| Sampling Location | Measurement Location (width, depth) |
Parameter | WY2022 Value (range of prior values) |
Prior Years Measured (# of measurements) |
|---|---|---|---|---|
| 001 | Center | Alkalinity (CaCO3) |
c.n.s. (20) | 2020 (1) |
| 001 | Center | Calcium (Ca) |
c.n.s. (2) | 2020 (1) |
| 001 | Center | Chloride (Cl) |
c.n.s. (11) | 2020 (1) |
| 001 | Center | Magnesium (Mg) |
c.n.s. (b.d.l.) | 2020 (1) |
| 001 | Center | Potassium (K) |
c.n.s. (1.2) | 2020 (1) |
| 001 | Center | Sulphate (SO4) |
c.n.s. (0) | 2020 (1) |
NPS
WY2022 Findings at Spud Rock Spring (High Elevation Spring)
Spud Rock Spring is hillslope spring that feeds an unused springbox near Spud Rock Campground on the east slope of the Rincon Mountains. As the springbox fills, it feeds an outflow pipe to a nearby pool (Figure 43), and when the box is overfilled, it supports a short springbrook (Figure 44). Descriptions and other characteristics of springs are updated every five years.
NPS
Site Condition
In WY2022, we rated Spud Rock Spring as “highly disturbed” by drying (there was no surface water present during the June visit) and flow modification (the substantial effects of the abandoned springbox and outflow pipe). We rated the spring “moderately disturbed” by hiking trails (the Spud Rock Campground spur trail goes within a few meters of the springbox, springbrook, and pool) and contemporary human use (extensive use of the pool and springbrook by campers when water is present). Spud Rock Spring was rated “slightly disturbed” by past fire (fire scarred trees around the springbrook) and wildlife use (digging in and around the dry pool, bear tracks). No other natural or human-caused disturbances were noted.
As in all previous visits, we did not detect any crayfish or bullfrogs (non-native invasive aquatic animals) at Spud Rock Spring in WY2022. As in all previous visits, we did observe scattered patches of the invasive grass Kentucky bluegrass (Poa pratensis), and as in WY2021, a few scattered individuals of common dandelion (Taraxacum officinale). No other non-native invasive plants or animals were observed.
Similar to previous years, we observed several obligate/facultative wetland plants at Spud Rock Spring in June 2022 that were green and flourishing despite the lack of surface water: sedge (Carex sp. and Cyperaceae) and spikerush (Eleocharis sp.).
Inventory of Rare and Invasive Species and Pathogens
As Spud Rock Spring was completely dry at the surface during the June 2022 visit, we were unable to collect eDNA samples as they are filtered from springwater. We will attempt to collect eDNA samples in future visits to this spring.
Water Quantity
The WY2022 visit occurred on 14 June 2022, and the spring only contained water within the springbox; there was insufficient water in the reservoir to support either the pool or springbrook (there was no surface water).
Temperature sensors indicated that Spud Rock Spring was wetted (contained water) for 257 of 257 days (100% of days) measured up to the WY2022 visit. However, because the water temperature sensor was buried in 15 cm of dry sediment, the water estimate became unreliable at an unknown date during the period from June 2021–June 2022. In prior water years, the spring was wetted 70.1–97.3% of the days measured (Figure 45).
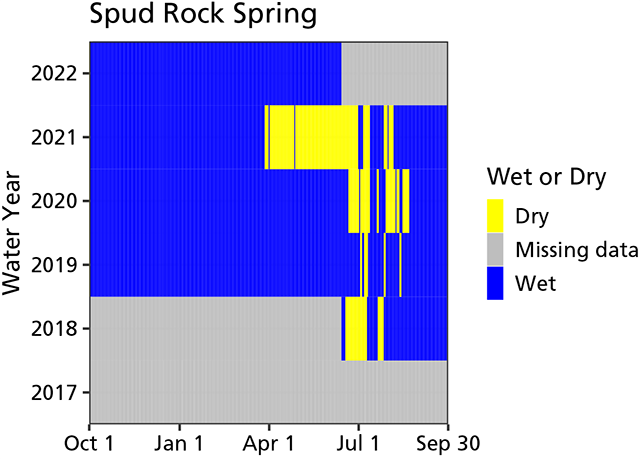
NPS
Discharge and wetted extent were not measured in WY2022 as the site was dry. Discharge has never been measured in past years as Spud Rock Spring was either dry at the surface or surface flow was too low to reliably estimate using our discharge methods. Wetted extent values from previous years are presented in Table 44.
Spud Rock Spring Data Tables
| Measurement | WY2022 Value (range of prior values) |
Prior Years Measured (# of measurements) |
|---|---|---|
| Width (cm) | c.n.s. (26.8–103.5) | 2018–2020 (3) |
| Depth (cm) | c.n.s. (0.1–2.3) | 2018–2020 (3) |
| Length (m) | c.n.s. (1.4–11.2) | 2018–2020 (3) |
| Sampling Location | Measurement Location (width, depth) |
Parameter | WY2022 Value (range of prior values) |
Prior Years Measured (# of measurements) |
|---|---|---|---|---|
| 001 | Center | Dissolved oxygen (mg/L) | c.n.s. (4.51) |
2020 (1) |
| 001 | Center | pH | c.n.s. (6.2) |
2020 (1) |
| 001 | Center | Specific conductivity (µS/cm) | c.n.s. (92.9) |
2020 (1) |
| 001 | Center | Temperature (°C) | c.n.s. (13) |
2020 (1) |
| 001 | Center | Total dissolved solids (mg/L) | c.n.s. (c.n.s.) |
c.n.s. |
| Sampling Location | Measurement Location (width, depth) |
Parameter | WY2022 Value (range of prior values) |
Prior Years Measured (# of measurements) |
|---|---|---|---|---|
| 001 | Center | Alkalinity (CaCO3) |
c.n.s. (35–50) | 2018–2020 (3) |
| 001 | Center | Calcium (Ca) |
c.n.s. (4–8) | 2018–2020 (3) |
| 001 | Center | Chloride (Cl) |
c.n.s. (0–14) | 2018–2020 (3) |
| 001 | Center | Magnesium (Mg) |
c.n.s. (b.d.l.–9) | 2018–2020 (3) |
| 001 | Center | Potassium (K) |
c.n.s. (0.8–1.4) | 2018–2020 (3) |
| 001 | Center | Sulphate (SO4) |
c.n.s. (1–9) | 2018–2020 (3) |
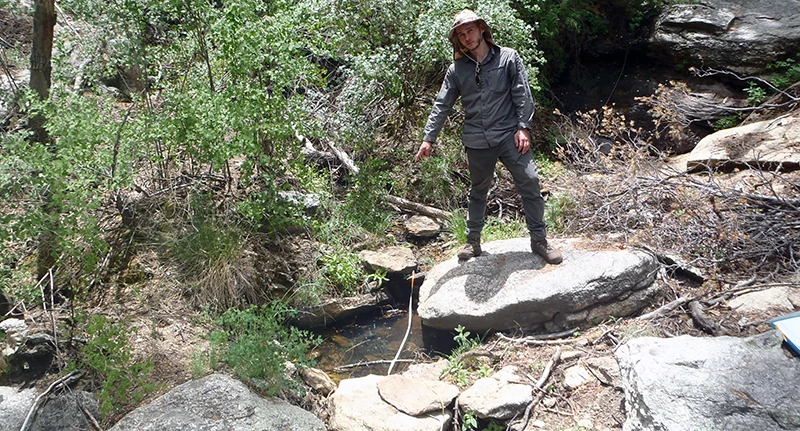
NPS
WY2022 Findings at Scarlet Spring (High Elevation Spring Complex)
Scarlet Spring is a rheocrene spring (emerges as a flowing stream) located in the upper reaches of Joaquin Canyon on the north slope of the Rincon Mountains. When last visited and characterized on 09 June 2022, Scarlet Spring emerged as small (1.0 x 1.5 m) pool (Figure 46) feeding a series of small and medium pools along more than 500 m of springbrook. The upper section of the springbrook flows through a mixture of sand, cobbles, and large boulders, whereas the lower section includes large areas of bedrock with spilloffs and small tinajas (Figure 47). This complex and diverse springbrook supports a wide variety of habitats for wetland animals and plants, including Scarlet Monkeyflower (Mimulus cardinalis), the namesake of Scarlet Spring. Descriptions and other characteristics of springs are updated every five years.
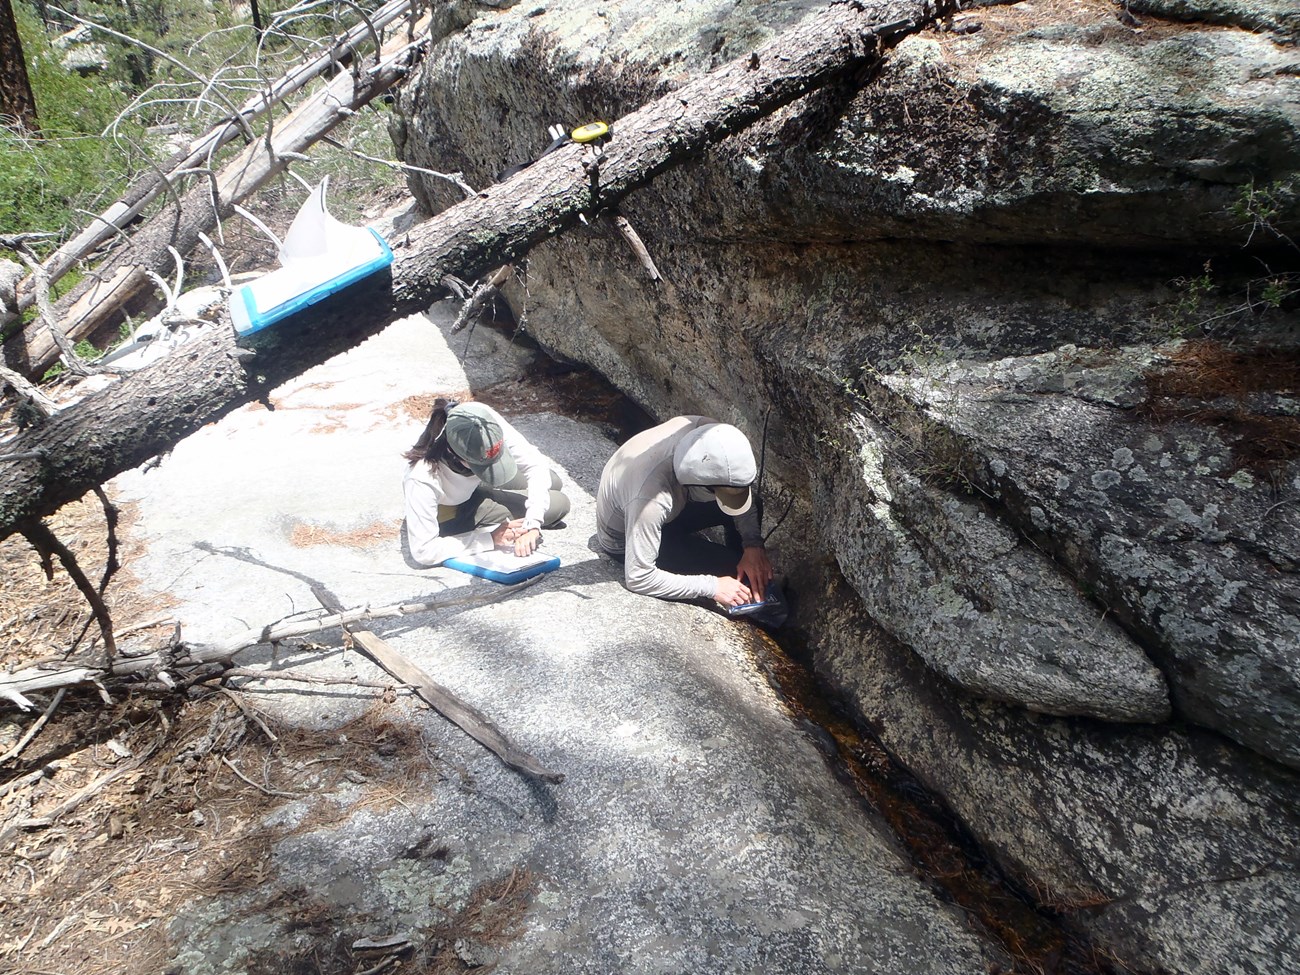
NPS
Site Condition
In WY2022, we rated Scarlet Spring as “moderately disturbed” due to past fire (fire scars and burned dead and down trees from the 2006 Helen’s 2 Fire) and windthrow (numerous logs of burned and unburned trees in and around the springbrook). We also rated the spring as “slightly disturbed” by wildlife activity due to the extensive evidence of digging within the springbrook, probably by American black bear. No other natural or human-caused disturbances were noted.
As in all past visits, we did not observe crayfish or bullfrogs (non-native aquatic invasive animals) or any non-native plants at Scarlet Springs in WY2022. As in all previous years, we detected a number of native obligate/facultative plants at Scarlet Spring, including Scarlet Monkeyflower (Mimulus sp.), rush (Juncaceae), and sedge (Carex sp. and Cyperaceae).
Inventory of Rare and Invasive Species and Pathogens
Four water samples were collected from Scarlet Spring on 09 June 2022. None of our target organisms were detected at Scarlet Spring.
Water Quantity
The WY2022 visit occurred on 09 June 2022, and the spring contained water. Discharge was estimated at 6.4 (± 0.1) L/min (1.70 ± 0.04 gal/min) in WY2022—approximately the midpoint of the range observed in prior years (Table 47).
Temperature sensors indicated that Scarlet Spring was wetted (contained water) for 252 of 252 days (100% of days) measured up to the WY2022 visit (Figure 48). In prior water years, the spring was wetted 91.3–100% of the days measured.
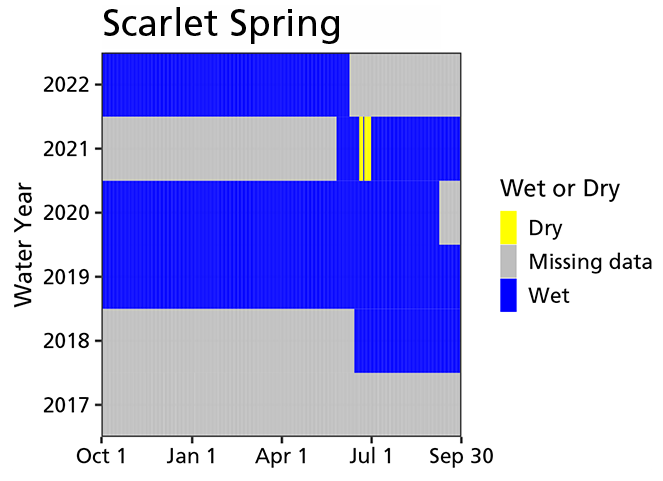
NPS
Wetted extent was evaluated using a method for flowing water. The total brook length was > 500 m (> 1,640 ft) as in previous water years (Table 48), except for WY2021 when the springbrook was only 15.6 m. The WY2021 sample occurred after one of the driest years on record in the Tucson area (WY2020) and prior to the record setting 2021 summer monsoon. In WY2022, wetted width and depth averaged 64.5 cm (25.4 in), 7.2 cm (2.8 in), respectively, within the first 100 m—the deepest average depth recorded at this site. We only collect width and depth measures for the first 100 m. Our WY2022 wetted extent data suggest a rebound from the extremely dry conditions of WY2021.
Water Quality
Core water quality (Table 49) and water chemistry (Table 50) data were collected at the primary sampling location of Scarlet Spring (a small pool that occurs at the top of the springbrook). Dissolved oxygen and pH were slightly lower than previously observed at Scarlet Spring, whereas alkalinity was higher than measurements from prior years. All other values were within the range recorded in prior years.
Scarlet Spring Data Tables
| Sampling Location | WY2022 Value (range of prior values) | Prior Years Measured (# of measurements) |
|---|---|---|
| 002 | 6.4 ± 0.1 (2.6–13.8) | 2018–2020 (3) |
| Measurement | WY2022 Value (range of prior values) |
Prior Years Measured (# of measurements) |
|---|---|---|
| Width (cm) | 64.5 ± 58.7 (65.2–119.4) | 2018–2021 (4) |
| Depth (cm) | 7.2 ± 9.9 (0.7–5.1) | 2018–2021 (4) |
| Length (m) | 100.0 (15.6–100.0) | 2018–2021 (4) |
| Sampling Location | Measurement Location (width, depth) |
Parameter | WY2022 Value (range of prior values) |
Prior Years Measured (# of measurements) |
|---|---|---|---|---|
| 001 | Center | Dissolved oxygen (mg/L) | 6.97 (7.81–7.82) |
2020–2021 (2) |
| 001 | Center | pH | 6.47 (7.00–7.32) |
2018–2021 (3) |
| 001 | Center | Specific conductivity (µS/cm) | 46.4 (5.3–46.2) |
2018–2021 (3) |
| 001 | Center | Temperature (°C) | 12.4 (12.2–13.8) |
2018–2021 (3) |
| 001 | Center | Total dissolved solids (mg/L) | 30.0 (30.0–32.5) |
2018–2021 (2) |
| Sampling Location | Measurement Location (width, depth) |
Parameter | WY2022 Value (range of prior values) |
Prior Years Measured (# of measurements) |
|---|---|---|---|---|
| 001 | Center | Alkalinity (CaCO3) |
40 (10–25) | 2018–2021 (4) |
| 001 | Center | Calcium (Ca) |
2 (0–72) | 2018–2021 (4) |
| 001 | Center | Chloride (Cl) |
21 (1–19) | 2018–2021 (4) |
| 001 | Center | Magnesium (Mg) |
0 (b.d.l.–11) | 2018–2021 (4) |
| 001 | Center | Potassium (K) |
1.4 (0.6–0.8) | 2018–2021 (4) |
| 001 | Center | Sulphate (SO4) |
0 (0–6) | 2018–2021 (4) |
Report Citation
Authors: Kara Raymond, Andy Hubbard, Cheryl McIntyre
Raymond, K., A. Hubbard, and C. McIntyre. 2024. Climate and Water Monitoring at Saguaro National Park: Water Year 2022. Sonoran Desert Network, National Park Service, Tucson, Arizona.

